BITCOIN - Is a pull back/reversal imminent?I use a method of analysis using the Fibonacci re-tracement where I market out the lowest low to the next highest high (for an up trend), which then becomes the FIB range to work within (A - B) . In order for this FIB range (A - B) to be valid, we need to have the highs of two candles lower on either side of the highest high. Depending on where the market falls to within this (A - B) range determines the target on the next rally. More often than not the target is hit (D) to the "pip" at which stage a new FIB range is established. On a rally(up or down), it has been typically observed for 7 - 11 candles, and as we get to within this range of 7 - 11 candles, we need to be cautious of a short term reversal or pull back.
Looking at the current weekly of the BITUSD, Bitcoin last week smashed through this FIB target 2090USD (D), to set an all time high at 2757USD and the rally lasted for 9 weeks which is 9 candles - so following this pattern movement of 7 - 11 candles, we perhaps have another 2 weeks of rallying or more than likely sideways movement as it begins the turn around. Assuming the current Highest High at 2757USD is our new High for the FIB range ( A - B)( remember we are waiting for 2 candles on either side with lower highs to form as confirmation), I am expecting a fall back to the last level of support (C) on the weekly chart, which is 1271 - 1355USD before the climb again on the next wave up to the 3000 mark (3264 - 3915USD) (D) .
Many called last weeks pull back a CRASH, however I think it was just pull back! to let the market know that its ready to for a reversal.
Based on my analysis, I think the next few weeks we will see the pull back continue to happen as BITCOIN sorts out its fundamental issues over the next few months. As it does, I believe we will see a flow of BITCOIN into the ALT (Alternative) CrptoCoins over the next several weeks.
What are your thoughts??
Bitcoincharts

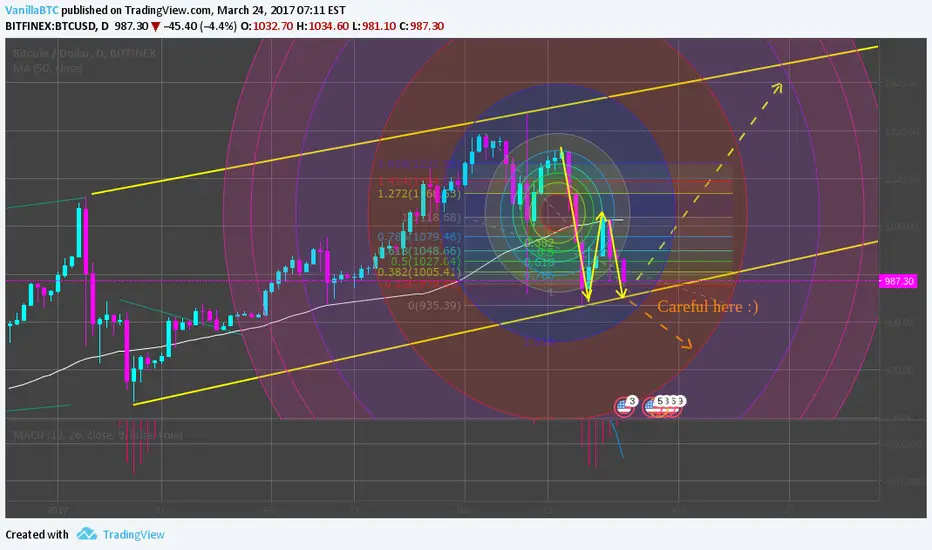
BTCUSD Reversal in play!Last week I said that BITCOIN was going to fall and it did, based on the signals I was seeing with candle formations on the daily and 4hr charts. As I expected it broke the inner trend line, and I expect it to continue to fall until it hits around the 1355 mark, at which point it will hit a support level missed on the weekly chart, and then the next rally will begin to around the 3200 - 3900 mark. Refer to the link to related ideas below for more information on last weeks analysis.
As I expected BITCOIN fell to the 2100 mark to touch the next inner trend line and then proceeded to move back up to the 2600 mark which is the 0.786% of the sub-FIB level This point is the right tip of a crown formation, so I expect from sometime from now until the start of the London trading session it will begin to make the next fall to the -0.27 level on the FIB which is 1924. Breaking of this trend line to hit the 1924 will be confirmation that it will then move to the towards the outer trend line and then the 1355 area of support.
I expect to see a break of the next inner trend line which I think will be around Tuesday or Wednesday of this week.
As normal let me know what you think! :-)


Short term BTC short incomingWedge formation indicates trend reversal forming, with the short term bearish divergence supporting this analysis. Longer term trend will continue once correction ends, which should be around 1530-1550 if it ends at first line of support as the fib retracement illustrates.

Long live Bitcoin, last call before climbing that canal.As usual, beware downward breakout, especially considering the news and the ethereum stelaing the hype lol, but bitcoin will always remain bitcoin, should have a place in a trading portfolio.
The double bottom is pretty nice, I think it just want to confirm the 1000 cap, as for the target, once again how long can you wait before closing position, if you can wait until top of the canal and beyond well,that's the real challenge, but that's the spirit of swing trading otherwise take it until you feel the up trend is heading toward retracement and retake position a little bit downer.
Cheers all cryptotraders out there :)
BITCOIN PRICE FORECASTPlease do not trade this without your own TA. I hope that this can help with target pricing :> Forecast is made using simple S/R and measures.
I have yet to explore the possible downside of this , so I will confess that this is very bias.

Short-term Long for BTCUSD until ETFI expect the price to float above 1200 as we wait for SEC to announce the ETF outcome this Friday. This is a good opportunity for a very short-term long. Be on your toes at all times. Good luck trading!

Bitcoin one year regression trend shows $1100-$1200 is comingLooking at one year regression trend for Bitcoin, it's very clear within range and will continue to USD 1100 - 1200 (and possible break AT H) within the next two months. Strong buy signal, going LONG.

Longing for BTC before its financial birthday on monday =)Waiting for a breakout, & continue heading north for this winter would be the idea, if no breakout, further retracements might occur due to profit taking, but the consensus is definitely being long, at least for long term.


Bitcoin BTCUSD Short positionThe last impulse complete the structure. Short position is the best strategy for the next 3 months.
The first objective is 750/730 for the wave A
Later a corrective wave back the price over the 800 dollars, the objective of the B wave is approximately 850 but first need see completly "A" for a better opinion.
The finally objetctive of "C" Wave is arround of 650 dollars.

BTC Weekly Candles Shows Upcomming CorrectionWeekly Candles have stopped making big wicks,
we are up for a correction ?
Jurik's RSI (smooth rsi) also shows overbought levels and
after every bull phase, btc has correction so i guess we are going to go sideways
and then a dump maybe and then form support and hit 6000 levels.

BITE FROM BITCIONOK GUYS, GALS AND PALS. BITCOIN PROBABLY MAY MAKE SOME NEW HIGH BUT VERY LIMITED AS THE RED RESISTANCE LINE IS IN PLAY. BUT ALSO HAS SOME GOOD UPSIDE POTENTIAL. PROBABLY IN A ZONE TO BUY FOR SHORT TEMR HOLD AND SELL IT DEPENDING ON SITUATION PROBABLY LAT OF THIS YEAR OR EALY NEXT YEAR AND GO FOR SHORT SIDE ONCE THEY BREAK THE 1ST GREEN SUPPORT LINE AND SHOWS WEAKNESS IN THE MARKET.

Bitcoin is on the way to $800 and $1,000. Bitcoin has been running far into the apex of its potential triangle pattern. Usually this means the pattern is either not happening or the move out of it will only be very shallow.
Overall the consolidation does not change the big picture.
Bitcoin is on the way to $800 and $1,000.
Let your winning run and keep your stop at $465
