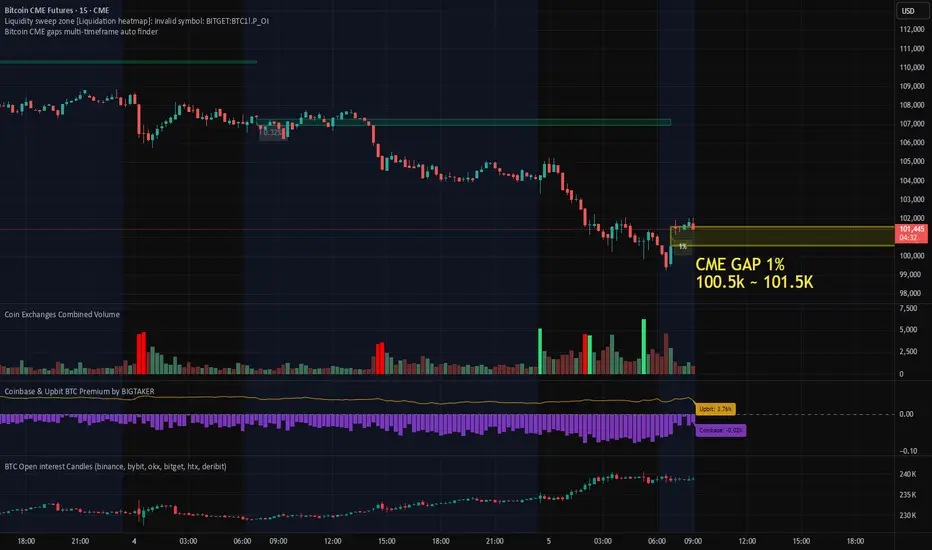
1% Bitcoin CME Gap Formed, Futures Market Data AnalysisThis morning, a ~1% gap formed on the Bitcoin CME futures chart.
Given that the gap occurred after a sharp decline, it’s important to consider the possibility of both a gap fill and a retest of recent lows in the short term.
The Coinbase Premium remains in negative territory, though it has shown slight improvement compared to yesterday, suggesting that U.S. spot selling pressure has somewhat eased.
In addition, Open Interest has increased, with data indicating a rise in short positions.
This suggests that selling pressure has been building during the recent decline, which may lead to a period of heightened short-term volatility and consolidation before the gap is fully filled.
Summary:
CME Gap Range: Approximately 1%
Market Structure: Short-term downtrend followed by consolidation
Coinbase Premium: Still negative, but slightly improved
Open Interest: Increasing (inflow of short positions)
📍In the short term, it is crucial to monitor whether the price enters the gap fill zone and retests the recent lows, while maintaining support at 98K, which remains a key short-term level.
Bitcoincmefutures
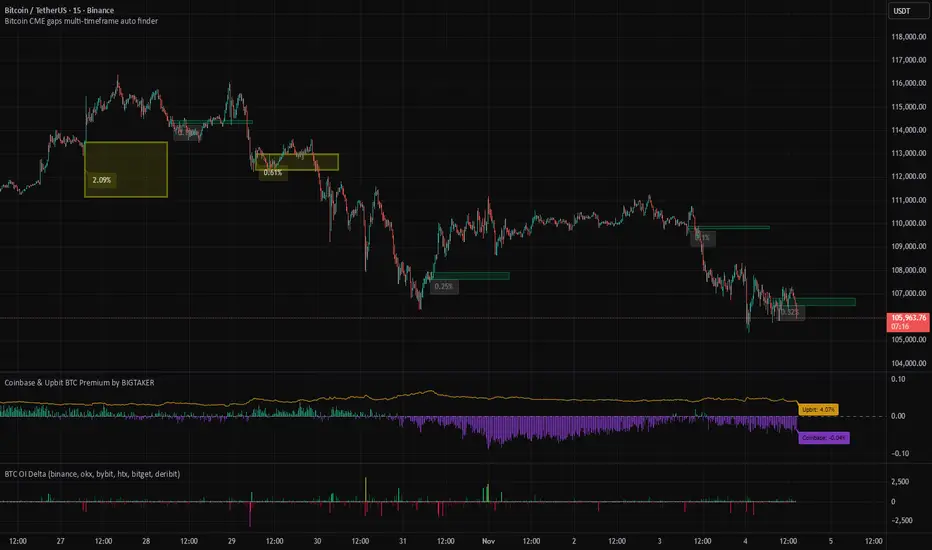
How to use bitcoin CME gap auto finder indicator on tradingview📊 Bitcoin CME Gap Auto Detection and Visualization Indicator
The Pine Script-based indicator Bitcoin CME gaps multi-timeframe auto finder is a TradingView tool designed for cryptocurrency traders and investors to automatically identify and visualize Bitcoin CME (Chicago Mercantile Exchange) futures market gaps across multiple timeframes.
The Bitcoin CME futures market often creates price gaps after weekends or holidays when trading resumes. These gaps typically represent market imbalances, and many traders believe that price levels where gaps occur are likely to be revisited in the future.
This concept is known as the "Gap Fill" theory, where such gaps are considered key price zones that may act as support or resistance levels.
Traditionally, manually identifying these gaps requires checking multiple timeframes and verifying weekend/holiday sessions, which is both tedious and time-consuming.
Indicator Link: Bitcoin CME gaps multi-timeframe auto finder
🔑 Key Features of the Indicator
Automated Gap Detection: Saves traders the time and effort of manually searching for and marking gaps.
Cross-Exchange Synchronization: CME gap boxes are displayed in sync on other Bitcoin charts such as BTCUSDT, BTCUSDT.P, and BTCUSD.
Multi-Timeframe Analysis: Displays gaps simultaneously across various timeframes (5m, 15m, 30m, 1h, 4h, 1D), providing multiple market perspectives.
Visual Clarity: Clearly highlights gap zones, with major gaps emphasized for quick trader recognition.
Strategic Trading Support: Provides essential information for developing and executing gap fill-based trading strategies.
CME Gap History: Allows users to review all past CME gaps formed in historical candles.
Alert Functionality: Sends real-time notifications when new gaps are detected, helping traders respond promptly to market changes.
⚙️ Main Functions and Usage
This indicator provides a wide range of customizable input options, allowing traders to adapt it to their specific analytical needs.
CME Gap Settings:
CME Symbol for Gaps: Specifies the symbol used to fetch CME futures data. The default is “BTC1!” (Bitcoin CME Futures).
Minimum gap percentage (%): Sets the minimum price movement recognized as a gap, allowing users to filter out minor fluctuations and focus on significant ones.
Display Timeframes:
Enables or disables gap visualization for each timeframe (5m, 15m, 30m, 1h, 4h, 1D). Users can activate only the timeframes they prefer to analyze.
Box Colors:
Customizable colors for each timeframe and gap direction (upward/downward), allowing easy visual distinction between gap types.
Box Extension Lengths (Bars):
Sets the number of bars the gap box extends to the right for each timeframe.
This visually illustrates how gap zones can remain relevant as future support/resistance levels.
Label Settings:
Show labels: Toggles the display of percentage labels for gaps.
Label position: Adjusts where the label appears inside the box.
Label text size: Controls the label font size.
Highlight Settings:
Highlight gap % (>=): Emphasizes gaps larger than a specified percentage, providing visual alerts for major gaps.
Highlight label text color: Sets the text color for highlighted gap labels.
Highlight box color: Defines the color for highlighted gap boxes.
Highlight box border width: Adds adjustable border thickness to highlighted gap boxes, making significant gaps stand out even more.
Alert Settings:
Enable Alerts: Toggles alert activation when gaps occur.
Alert Timeframe: Choose specific timeframes for receiving alerts or enable alerts for all timeframes.
🚀 How It Works
The indicator retrieves CME futures data (BTC1!) and compares the previous bar’s close/high/low with the current bar’s open across multiple timeframes to identify gaps.
It is specifically designed to detect gaps that occur when the market reopens after weekends or holidays.
Once a gap is detected, the indicator draws a box to visually mark it on the chart.
If the gap size exceeds the user-defined threshold, the box is emphasized using a highlight color and thicker border for greater visibility.
💡 Trading Strategies and Applications
Support and Resistance Identification:
CME gap zones often act as strong support or resistance levels.
Unfilled gaps may indicate potential price return zones, serving as signals for possible reversals or trend continuation.
Gap Fill Strategy:
Many traders believe that gaps tend to be filled eventually.
This indicator can help identify potential entry and exit points for gap fill trades.
For example, after a downward gap, traders might consider entering a long position when the price begins to recover toward the upper boundary of the gap and close the trade once the gap is filled.
Market Sentiment Analysis:
The size and frequency of gaps can reflect strong market movements or uncertainty.
Large gaps often indicate intense buying or selling pressure, and highlighted gaps help quickly identify these significant market events.
Multi-Timeframe Confirmation:
When gaps occur simultaneously across several timeframes, it underscores the importance of that price zone.
For instance, if a gap appears on both the 1-hour and 4-hour charts, traders should pay close attention to potential price reactions at that level.
Opportunity Detection via Alerts:
By enabling alerts, traders can monitor market changes in real time and act immediately when new gaps form — particularly useful for short-term or high-frequency strategies requiring fast decisions.
🚨 Cautions
Gap fills are not guaranteed: While gaps often tend to be filled, not all of them will, and some may take a long time.
Time zone configuration: Since the CME operates in specific trading hours, make sure the indicator’s GMT+9 timezone matches your local trading setup on TradingView.
Avoid using in isolation: Combine this indicator with other technical tools (e.g., moving averages, RSI, volume indicators) to enhance reliability and accuracy.
※ If you found the Bitcoin CME gap auto finder indicator helpful, please give it a like and follow.
Bitcoin CME Futures Daily Trend AnalysisMarkets move in cycles, and different cycle durations help confirm trends ranging from short-term to long-term. Based on my analysis of the 5-day cycle, the Bitcoin CME Futures show a bearish signal. This suggests that the closing price on May 16, 2025, is likely to be lower than the opening price on May 13, 2025, which is 103100.
The current trend remains bullish, with a trailing stop-loss placed at 101059. A close below this level would confirm a sell signal.
Disclaimer: This is my personal market view and not a buy or sell recommendation. Traders should conduct their own technical analysis and follow sound risk management practices before taking any position.

Understanding Bitcoin CME Gaps: Importance/Trading StrategiesBitcoin CME Gaps are price gaps that occur in the Bitcoin futures market, specifically on the Chicago Mercantile Exchange (CME). These gaps happen when the closing price of a Bitcoin futures contract on the CME differs significantly from the opening price of the next contract. Here's why they are important and how to trade them briefly:
Importance:
Technical Analysis: Traders often pay attention to CME Gaps because they can act as significant support or resistance levels on Bitcoin's price chart.
Market Psychology: These gaps can signal abrupt shifts in market sentiment, which can influence future price movements.
Volatility: Bitcoin is known for its price volatility, and CME Gaps can exacerbate price swings, making them important for risk management.
How to Trade:
Fill the Gap: Some traders believe that CME Gaps tend to get "filled" eventually, meaning that Bitcoin's price will return to the level of the gap and close it. They might place buy orders just above the gap and sell orders just below it.
Confirmation: It's essential to wait for confirmation before trading CME Gaps. This can include observing price action, volume, and overall market sentiment.
Risk Management: Trading CME Gaps can be risky. Use stop-loss orders to limit potential losses, and don't bet too much of your capital on a single trade.
Remember that while CME Gaps can be significant, they are not foolproof trading signals, and trading cryptocurrencies is inherently risky. It's crucial to have a well-thought-out trading plan and consider other factors, such as fundamental analysis and market news, in your decision-making process.

TWO GAPS to FILL. Which one comes first?Traders,
Our CME BTC Futures chart now shows (2) two gaps to fill. We know that over 90% of all gaps are eventually filled. Usually, this occurs sooner rather than later. The big question is which one of these gaps will be filled first if we assume they will both be filled? Post your best guess in the comments below.
The other thing I am looking at on this chart is a possible retest of our previous channel. Previously, the top of this channel acted as resistance. The market likes to come back and test previous resistance as support. Will it do so this time as well?
Stay tuned,
Stew

Bitcoin #CME Unfilled Gaps#Bitcoin #CME
Unfilled Gaps
There are some unfilled gapes in $BTC that can be filled via down trend 🐻
#BTC price can increase to fill the gap between $5545 and $49265, then with an unexpected drop go for filling the $41185 and $39955, then more drop to fill gap between $33405 and 22860. 🐻🐻

BITCOIN prediction ANALYSIS price has broken out and above this triangle pattern that we have marked up.
-we could potentially see a retest which would be the safe bet to wait for
-price action has alot of free volume to cover up if we see a rise up to the next resistance area.
we have been seing some good fundamentals about bitcoin so lets see what happens and execute with a sharp mind but also manage risk.

I'm not saying anything about this analysis.hey guys ..
If you invest and you are greedy
Your place is not here
You know nothing about the market
I say clearly
This job is not good for you
good luck


BTC Calling Bottom Elon Price Manipulation, -In this post i will be explaining why the bull market is not over and why i am very confident this is the bottom for BTC's recent pullback.
-In the past 2 months we know that BTC has been moving sideways.
-We also know that BTC Dom Chart is dropping which is a good indicator that it is alt season.
-We saw major Pairs like ETH LINK and LTC drop draws and make people Ridiculous amounts of money. While BTC moved sideways for 2 months between the $44k-$62k, this is a large indicator for alt-season.
-Here are some Reasons on my Theory with Elon.
-Elon tweeted a few days ago saying how Tesla will no longer accept Bitcoin payments due to the fact of Environmental Reasons and they will be looking for other cryptos to accept in the future.
-ELON IS CREATING FUD AND MANIPULATION IN PRICE DUE TO HIS LARGER FOLLOWERS. YOUR TELLING ME A COMPANY WITH A MARKET CAP OF 568 BILLION DOLLARS DID NOT DUE BACKEND RESEARCH ON A INVESTMENT??? I DONT BUY THAT AT ALL.
-Elon/Tesla also announced that they have sold 10% of there Bitcoin holding to show liquidity.
-This also plays a role on how he is controlling the price. He announced Telsa has sold 10% for liq reasons and a week later he announces that Tesla will no longer be accepting BTC. This is clearly a manipulation in price and movement in the markets.
-Elon and Tesla are most likley buying this dip with that 10% they sold earlier so they can gain more BTC.
-On the TA level i have a few supports in mind We are currently testing the $44k level which is also bouncing off the Blue bullish trendline that i drew from mid December of 2020.
-This leaves me to believe that if we do now hold the $44k level that we will retested $42k and if 42k does not hold Last resort is the last Support i have $38k.
Now We recently have closed the weekly timeframe above the Bull Market Support Band which is a great sign.
Also Keep in Mind that we havent not painted any top wick yet and just the bottom another reason i am bullish.
-We have also seen the fear and greed index hit a 20/100 the lowest we have seen all of 2021.
-As far as recovery i do believe that this will take time to recover with such nasty news and major FUD seen on twitter and many crypto Community that 1 man has created. My guess is Trading Volume will be very low which means that we will see very slow movement across the board on these blue chip and mid cap coins.
-To Finalize this post i would like to say a few things.
-THIS MARKET CYCLE IS FAR FROM OVER
-You must be greedy while others are fearful and that is what is exactly happing in this market rn alot of Fear.
-I have Orders at 44k 42k as well 38k this is not the market top but defiantly a local top for a good amount of time.
-Im not selling any of my portfolio and all this fear and FUD just makes me want to buy more.
-Thanks for reading my Thoughts on the Bitcoin and if you dont know already BTC will determine how Alts perform If BTC keeps dropping Alts will drop hard and if BTC accumulates we will see some random coins pump.

Bitcoin - SHORT; SELL this high-confidence Market Top!Unless it can push above $84130 by next week, it's likely done for, at these levels.

Bitcoin Analysts Today!I made a simple analytical for Bitcoin today. BTC will be pump until 20k.
Correct me if I am wrong.
Need your inputs guys!
Thanks!

Bitcoin Double Bottom continuesDear patrons,
This is my new analysis and update on BTC moving up in the chains. We bottomed out at 17650. On my last post I noted that I entered this trade at 17850 to hopefully get some solid bounce to the upside, and set my stop losses in the 17650 area.
Continued to today I am riding this upside, we clearly passed the neckline of the double bottom and now we have a new support. I moved my stop losses up to the zone where if the neck line breaks then we will have some profit.
Currently we are testing the 18800 resistance. Wait for conformations on the four hour candles to assume breakouts, etc.
Note: if you miss a double bottom, you can always purchase the breakout above the neckline (circled in purple). I also circled the zone of which I entered which is the bottom.
Another thing to consider on the chart, Red is stop loss, Blue lines are key supports and resistances. hopefully we can get some more upside to this trend.
Please like and share, my last analysis was pretty accurate, we can all make money together! happy trading :)
When a man falls he can get up, when a leaf falls it is stepped on.
-The one and only, fallingleaf

Bitcoin (with 1D chart explanation) - November 19Hello?
Dear traders, nice to meet you.
"Like" is a huge force for me.
By "following" you can always get new information quickly.
Thank you for always supporting me.
-------------------------------------------------- -----
(1D chart)
You should watch for any movement that deviates from 17422.0-18280.5.
If it falls below the 17422.0 point, it is a short-term Stop Loss.
I expected a'Pull Back' pattern to emerge, but it is on the rise.
We have to see if we can keep the price between 17422.0-18280.5 by around November 23rd.
I think this is the time to see the reaction of altcoins.
If BTC dominance rises above 67.44 points, it is expected that among altcoins, coins that renew their lowest point this year will be created.
(1h chart)-short-term strategy
We check the movement in the 17422.0-18280.5 section, and since the 17422.0 point is Stop Loss, we will post a short-term strategy for this.
(LONG)
1. Entry point: When exceeding 18280.5 point
Target point: 19287.5 points or higher
Stop Loss: 17422.0 point
(However, it is recommended to enter the flow after the time indicated on the chart.
Also, if it falls without breaking above the uptrend line (5), it is Stop Loss.)
2. Entry point: When touching the 16290.0-16730.0 section and breaking above the 16730.0 point
Target point: 17422.0 points or higher, 2nd 18280.5 points or higher
Stop Loss: 16290.0 point
(However, if it falls without breaking above each uptrend line (1), (2), (5), it is Stop Loss.
You're entering a rebound on a downturn, so you need to watch the price movement.)
(SHORT)
Entry point: When breaking down from 17422.0 point
Target point: 1st 16730.0 point or less, 2nd 16323.5 point or less
Stop Loss: 17654.0 point
(However, if it rises without breaking below the upward trend lines (1) and (3), it is a Stop Loss.
If it falls below the uptrend line (4), the short-term uptrend channel is broken.)
------------------------------------------
(BTC Dominance 1D Chart)
It is rising to near the 67.44 point
We must see if it breaks above 67.44.
To expect the altcoin price to rise, BTC dominance should decline.
--------------------------------------------
(USDT Dominance 1D Chart)
If USDT dominance declines, it is expected that funds are being used or withdrawn to buy coins in the coin market.
However, as USDT continues to increase, it appears to be used to buy coins.
(USDT 1D chart)
-------------------------------------------------- -------------------------------------------
** Check support, resistance, and abbreviation points.
** Support or resistance is based on the closing price of the 1D chart.
** All explanations are for reference only and do not guarantee profit or loss on investment.
Explanation of abbreviations displayed on the chart
R: A point or section of resistance that requires a response to preserve profits
S-L: Stop-Loss point or section
S: A point or segment that can be bought for profit generation as a support point or segment
(Short-term Stop Loss can be said to be a point where profits and losses can be preserved or additionally entered through installment trading. You should trade from a short-term investment perspective.)
GAP refers to the difference in prices that occurred when the stock market, CME and BAKKT exchanges were closed because they do not trade 24 hours a day.
G1: Closed price
G2: Market price at the time of opening

Bitcoin (with 1D chart explanation) - November 18Hello?
Dear traders, nice to meet you.
"Like" is a huge force for me.
By "following" you can always get new information quickly.
Thank you for always supporting me.
-------------------------------------------------- -----
(1D chart)
It is on the rise after breaking above the 17422.0 point.
We need to see if we can get support and climb in the 17422.0-17562.0 range.
It is on the rise while absorbing the amount of water with a continuous'Pull Back' pattern.
It remains to be seen whether the climb will continue towards the 18506.0 point, or will the'Pull Back' pattern be supported and rise again at 17090.0-17562.0.
If it falls at 17090.0, it is a short-term Stop Loss.
In addition, if it falls below the 16368.5 point, which broke above the previous'Pull Back' pattern, I think it is necessary to trade in split to preserve profit and loss.
It is rising to a high point with no previous data.
Now, I think that it is necessary to respond to a sudden drop in case by pre-order with a mechanical stop loss correction.
(1h chart)-short-term strategy
Among the previous short-term strategies, it entered the LONG strategy and ended by touching the target point.
Shows a short-term strategy that includes points on the 1D chart, points 17090.0, 17422.0, and 17562.0 points, and points at Stop Loss, points 16368.5.
It's been soaring for two days in a row, so it's expected to undergo a downward correction.
Therefore, we don't show any ascent strategy above the 17660.0 point.
(LONG)
1. Entry point: When supported in the section 17422.0-17562.0 and breaks upward from 17566.5
Target point: 17759.0 point or higher
Stop Loss: 17422.0 point
(However, if it falls below the uptrend line (2), I think it is better not to enter.
If you enter, you should check if it breaks above the 17660.0 point.)
2. Entry point: When supported in the section 16989.0-17090.0, and breaks above the 17090.0 point
Target point: 17278.0 point or higher, 2nd 17562.0 point or higher
Stop Loss: 16989.0 point
(However, if it falls without breaking above the 17422.0 point, it is a Stop Loss.)
(SHORT)
Entry point: When breaking below the 17562.0 point
Target point: 1st 17422.0 point or less, 2nd 17090.0 point or less
Stop Loss: 17660.0 point
(However, if it fails to break below the uptrend line (2) or below the 17422.0 point, it is a Stop Loss.)
--------------------------------------------
(BTC Dominance 1D Chart)
We have to see if it touches the 67.44 point between November 19-21.
If you touch the 67.44 point and start falling, the altcoins are likely to start rising.
However, if it rises above 67.44 points, it is expected that more and more coins will renew their lows this year.
Therefore, you should not climb above 67.44 points.
If it goes up, I expect the BTC price to start falling eventually.
--------------------------------------------
(USDT Dominance 1D Chart)
You should check for any movement that deviates from the 3.596-3.760 segment.
-------------------------------------------------- -------------------------------------------
** Check support, resistance, and abbreviation points.
** Support or resistance is based on the closing price of the 1D chart.
** All explanations are for reference only and do not guarantee profit or loss on investment.
Explanation of abbreviations displayed on the chart
R: A point or section of resistance that requires a response to preserve profits
S-L: Stop-Loss point or section
S: A point or segment that can be bought for profit generation as a support point or segment
(Short-term Stop Loss can be said to be a point where profits and losses can be preserved or additionally entered through installment trading. You should trade from a short-term investment perspective.)
GAP refers to the difference in prices that occurred when the stock market, CME and BAKKT exchanges were closed because they are not trading 24 hours a day.
G1: Closed price
G2: Market price at the time of opening

Bitcoin (XBTUSD,BTC1!,BTM1!,Trading ) - November 16Hello?
Dear traders, nice to meet you.
"Like" is a huge force for me.
By "following" you can always get new information quickly.
Thank you for always supporting me.
-------------------------------------------------- -----
I stopped using the charts I had been using for more than 2 years and started over with a new chart.
(1W chart)
There is a sharp upward trend.
With the start of the new week, it remains to be seen that the decline in the 14838.0-15143.0 range.
Otherwise, the upward trend is expected to continue.
(1D chart)
If it falls between 15605.0-15791.5, it is a short-term Stop Loss.
Any interval that is likely to transition from an uptrend to a downtrend should fall between 14838.0-15143.0.
(1h chart)-short-term strategy
We have posted a short-term strategy that includes a short-term stop loss point of 15605.0 points.
(LONG)
1. Entry point: When exceeding the 16001.0 point
Target point: 1st 16123.0 point or higher, 2nd 16219.0 point or higher
Stop Loss: 15914.5 points
(However, if it falls without breaking the downtrend line, it is Stop Loss.)
2. Entry point: When touching near the 15545.5 point and breaking above the 15605.0 point
Target point: 1st 15791.5 or higher, 2nd 15914.5 or higher
Stop Loss: 15545.5 points
(SHORT)
1. Entry point: When rising above 16001.0 point and breaking down below 16001 point
Target point: 15834.0 point or less
Stop Loss: When the downtrend line is crossed upward
2. Entry point: When breaking down from 15791.5 point
Target point: 15605.0 point or less
Stop Loss: 15834.0 point
-------------------------------------------------- ----
(CME Bitcoin (BTC1!) 1D chart)
It started with a fall in the gap (16270.0-16035.0).
We have to see if we can get support at 16000.0 and climb above 16220.0.
You should also watch if it falls and touches the uptrend line (7).
If it falls below the uptrend line (7), i.e. at 15825.0, it is a short-term stop loss.
----------------------------------------
(BTC Dominance 1D Chart)
You should check for any movement that deviates from 64.63-66.39.
------------------------------------------
(USDT Dominance 1D Chart)
We must see if we can get resistance at the downtrend line (2) and move down.
-------------------------------------------------- -------------------------------------------
** Check support, resistance, and abbreviation points.
** Support or resistance is based on the closing price of the 1D chart.
** All explanations are for reference only and do not guarantee profit or loss on investment.
Explanation of abbreviations displayed on the chart
R: A point or section of resistance that requires a response to preserve profits
S-L: Stop-Loss point or section
S: A point or segment that can be bought for profit generation as a support point or segment
(Short-term Stop Loss can be said to be a point where profits and losses can be preserved or additionally entered through installment trading. You must trade from a short-term investment perspective.)
GAP refers to the difference in prices that occurred when the stock market, CME and BAKKT exchanges were closed because they are not trading 24 hours a day.
G1: Closed price
G2: Market price at the time of opening

Bitcoin (XBTUSD, BTC1!, BTM1!) - November 14Hello?
Dear traders, nice to meet you.
"Like" is a huge force for me.
By "following" you can always get new information quickly.
Thank you for always supporting me.
-------------------------------------------------- -----
(1D chart)
It is rising due to volatility around November 12 (November 11-13).
We must see if we can ascend to the 16384.5-16700.0 range.
It remains to be seen if the volatility around the 17th of November results in any movement outside the 15674.0-17090.0 range.
If it falls at the uptrend line (8), it is a short-term Stop Loss.
Further increases in the wRSI_SR indicator are raising expectations that a downward divergence could be avoided.
(1h chart)-short-term strategy
The Fibonacci retracement metric used in this chart has been changed to introduce a new short-term strategy.
The possible entry point from your current location is 16167.0.
However, as it is currently rising, it will remain to be seen if it will be able to touch the 16167.0 point again.
(LONG)
1. Entry point: When it exceeds the 16167.0 point and rises above the 16219.0 point
Target points: 1st 16384.5 points or higher, 2nd 16604.0 points or higher
(However, the 16123.0 point is the Stop Loss point.)
2. Entry point: When exceeding 16411.5 point
(It is recommended to enter after the time indicated on the chart.)
Target point: 1st 16604.0 point or higher, 2nd 16700.0 point or higher
Stop Loss point: 16384.5 point
(However, the Stop Loss point is short. You need your own strategy to take the risk.)
(SHORT)
Entry point: When breaking below 16123.0 point
Target point: 1st 15844.5 points or less, 2nd 15545.5 points or less
Stop Loss point: 16219.0 point
(However, it is recommended to enter after the time indicated on the chart.
If it rises without falling in the upward trend line (B)-(8), it is Stop Loss.)
-------------------------------------------------- -------
(CME Bitcoin (BTC1!) 1D chart)
It started with the gap (16240.0-16350.0) rising and closed at 0.52%.
You need to make sure you can get support at 16220.0.
It remains to be seen whether it will start above the uptrend line (6) or above the uptrend line (7).
-------------------------------------------------- -----------
(BAKKT Bitcoin (BTM1!) 1D chart)
It started with the gap (16150.0-16467.5) rising and closed at 0.82%.
You should check if you can start at 16261.5 point or higher.
--------------------------------------------
(BTC Dominance 1D Chart)
It rose due to volatility around November 11.
You should check for any movement that deviates from 64.63-66.39.
----------------------------------------------
(USDT Dominance 1D Chart)
We have to see if we can get below the 3.760 point.
-------------------------------------------------- -------------------------------------------
** Check support, resistance, and abbreviation points.
** Support or resistance is based on the closing price of the 1D chart.
** All explanations are for reference only and do not guarantee profit or loss on investment.
Explanation of abbreviations displayed on the chart
R: A point or section of resistance that requires a response to preserve profits
S-L: Stop-Loss point or section
S: A point or segment that can be bought for profit generation as a support point or segment
(Short-term Stop Loss can be said to be a point where profits and losses can be preserved or additionally entered through installment trading. You should trade from a short-term investment perspective.)
GAP refers to the difference in prices that occurred when the stock market, CME and BAKKT exchanges were closed because they are not trading 24 hours a day.
G1: Closed price
G2: Market price at the time of opening

Bitcoin (XBTUSD, BTC1!, BTM1!) - November 13Hello?
Dear traders, nice to meet you.
"Like" is a huge force for me.
By "following" you can always get new information quickly.
Thank you for always supporting me.
-------------------------------------------------- -----
(1D chart)
We have to see if we can climb above 16384.5 points.
It is rising due to volatility around November 12th (November 11-13), but the volatility period is not over, so careful trading is necessary.
It remains to be seen whether it will rise to the 16384.5-16700.0 range and gain support, and whether it will rise to the 17422.0 point, or if it will decline without breaking the 16700.0 point.
The volatility caused by the surge can lead to a lot of movement.
Therefore, careful trading is necessary.
If it falls at 15791.5, it is a short-term Stop Loss.
If it falls at 14838.0, it is a Stop Loss to preserve profit and loss.
(1h chart)-short-term strategy
Among the previous short-term strategies, the LONG strategy is still in progress.
--------------------------------------------
(BTC Dominance 1D Chart)
BTC dominance is rising with BTC price.
If it breaks above the 67.44 point, I think the coin market is likely to turn downward.
I think BTC dominance must fall in order for altcoin price to rise.
---------------------------------------------
(USDT Dominance 1D Chart)
You should check for any movement that deviates from the 3.760-4.390 section.
-------------------------------------------------- -------------------------------------------
** Check support, resistance, and abbreviation points.
** Support or resistance is based on the closing price of the 1D chart.
** All explanations are for reference only and do not guarantee profit or loss on investment.
Explanation of abbreviations displayed on the chart
R: A point or section of resistance that requires a response to preserve profit
S-L: Stop-Loss point or section
S: A point or segment that can be bought for profit generation as a support point or segment
(Short-term Stop Loss can be said to be a point where profits and losses can be preserved or additionally entered through installment trading. You should trade from a short-term investment perspective.)
GAP refers to the difference in prices that occurred when the stock market, CME and BAKKT exchanges were closed because they do not trade 24 hours a day.
G1: Closed price
G2: Market price at the time of opening

Bitcoin (XBTUSD, BTC1!, BTM1!) - November 12Hello?
Dear traders, nice to meet you.
"Like" is a huge force for me.
By "following" you can always get new information quickly.
Thank you for always supporting me.
-------------------------------------------------- -----
(1D chart)
You need to make sure you can get the support above the 15791.5 point.
It remains to be seen if the volatility around November 12 can rise along the uptrend line (8).
It remains to be seen if further gains can break the bearish divergence formed in the wRSI_SR indicator.
I think we are at the crossroads between rising and falling.
Accordingly, if it falls at 15568.5, it is a short-term Stop Loss.
Also, if it falls at 14838.0 point, split trading is needed to preserve profit and loss.
Short-term Stop Loss is a Stop Loss with additional entry in mind, so you should be able to check the flow of the chart.
(1h chart) - short-term strategy
Among the previous short-term strategies, it ended with the LONG strategy.
Since the 15568.5 point is a short-term stop loss point, we have established a strategy that includes this.
Breaking upward through the expansion triangle concluded the previous LONG strategy.
It seems that you will need to check the flow after the time indicated on the chart to see if you can keep the expanding triangle's channel.
(LONG)
1. Entry point: when supported at 15568.5 and ascend
Target point: 1st 15776.5 point or higher, 2nd 16384.5 point or higher
(However, if it falls from the uptrend line (C), it is Stop Loss.)
2. Entry point: When the upward trend line (C) -15776.5 is supported and rises above the 15791.5 point
Target point: 1st 16384.5 points or higher, 2nd 16700.0 points or higher
(However, if it starts to rise after the time indicated on the chart and falls below the uptrend line (8), it is Stop Loss.)
(SHORT)
Entry point: When breaking below the 15568.5 point
Target point: 1st 15340.0 point or less, 2nd 15143.0 point or less
(However, if it rises above the upward trend line (B), it is Stop Loss.)
-------------------------------------------------- --------
(CME Bitcoin (BTC1!) 1D chart)
Today's gap is 15805.0-16000.0.
We need to see if we can get support and climb at point 15825.
You should also look to see if it can rise above the 16220.0 point by ascending along the uptrend line (6).
If it falls at 15685.0, it is a short-term Stop Loss.
If it falls at 14970.0 point, you need to trade to preserve the profit and loss.
-------------------------------------------------- ----
(BTC Dominance 1D Chart)
You should check for movements that deviate from 64.63-66.39 due to volatility around November 11 (November 10-12).
If it falls below the 64.63 point and falls towards the 63.38 point, the altcoins' price is expected to show a significant rise.
If not, however, the current uptrend is only a rebound and the downtrend is expected to continue.
So, if you want to invest in altcoins, you have to respond in the short term.
-------------------------------------------------- -------
(USDT Dominance 1D Chart)
You should check for movements that deviate from the 3.760-4.390 section around 7-12 November.
-------------------------------------------------- -------------------------------------------
** Check support, resistance, and abbreviation points.
** Support or resistance is based on the closing price of the 1D chart.
** All explanations are for reference only and do not guarantee profit or loss on investment.
Explanation of abbreviations displayed on the chart
R: A point or section of resistance that requires a response to preserve profit
S-L: Stop-Loss point or section
S: A point or segment that can be bought for profit generation as a support point or segment
(Short-term Stop Loss can be said to be a point where profits and losses can be preserved or additionally entered through installment trading. You should trade from a short-term investment perspective.)
GAP refers to the difference in prices that occurred when the stock market, CME and BAKKT exchanges were closed because they do not trade 24 hours a day.
G1: Closed price
G2: Market price at the time of opening

Bitcoin (XBTUSD, BTC1!, BTM1!) - November 11Hello?
Dear traders, nice to meet you.
"Like" is a huge force for me.
By "following" you can always get new information quickly.
Thank you for always supporting me.
-------------------------------------------------- -----
(1D chart)
You should check for movements that deviate from the 14838.0-15791.5 zone due to volatility around November 10 (November 9-11).
We have to see if we can get support at 15143.0 and rise above 15568.5.
The 14838.0 point is a possible entry point, but if it falls it is also a short-term stop loss point.
Therefore, careful trading is necessary.
The wRSI_SR indicator (interpreted in the same way as the StochRSI indicator) is entering the oversold section.
As a result, I think that the fluctuation range may increase in the short term.
The Fibonacci retracement ratio is not using the existing one, but changing the ratio value as my style is because it is easier to interpret.
You are not crossing the 15568.5 point, which is the support and resistance test point that must be crossed before ascending to the next leg.
If the rise above the 15568.5 point continues and the failure continues, there is a possibility that it will decline to the previous segment of 13698.0-14321.5.
The two points form a sideways section, and between these sections, the force is stored to see if it is possible to ascend to the next section.
Also, you will see if a fake comes out from a point as a single point.
The division of the section is not accurate, but I think movement is occurring near the divided section or point.
It seems that the appearance that is currently coming out from the 15568.5 point is likely to be a'Pull Back' pattern.
So, we have to see if we can complete the'U'.
If the letter'U' is completed, it is expected to see a surge.
All patterns can be known only after they are completed, so I think the best way to trade is to respond to the movement of the chart.
(1h chart)-short-term strategy
The old short-term strategy is still in effect.
You should check for possible flows outside the range of triangles indicated on the chart.
As the fluctuations are expected to increase, the short term seeing if it deviates from the uptrend line plotted on the current chart, i.e., between the uptrend line (6)-(8) and whether it rises along the upside channel within the uptrend by touching the trendline and falling I think the strategy can be applied.
-------------------------------------------------- ----------
(CME Bitcoin (BTC1!) 1D chart)
We need to check for movements that deviate from the 15260.0-15825.0 range due to volatility around November 11 (November 10-12).
You also have to watch if you can move up along the uptrend line (7).
You can gain support and climb in the 14345.0-14970.0 range, so you need to trade carefully.
-------------------------------------------------- -------
(BTC Dominance 1D Chart)
You should check if there is any movement that deviates from the 64.70-66.39 range due to volatility around November 11 (November 10-12).
We also have to see if we can get below the 63.38 point.
If it falls below the 63.38 point, I think altcoins are likely already on the uptrend.
-------------------------------------------------- ----
(USDT Dominance 1D Chart)
You should check for any movement that deviates from the 3.760-4.390 segment between 7-12 November.
-------------------------------------------------- -------------------------------------------
** Check support, resistance, and abbreviation points.
** Support or resistance is based on the closing price of the 1D chart.
** All explanations are for reference only and do not guarantee profit or loss on investment.
Explanation of abbreviations displayed on the chart
R: A point or section of resistance that requires a response to preserve profits
S-L: Stop-Loss point or section
S: A point or segment that can be bought for profit generation as a support point or segment
(Short-term Stop Loss can be said to be a point where profits and losses can be preserved or additionally entered through installment trading. You should trade from a short-term investment perspective.)
GAP refers to the difference in prices that occurred when the stock market, CME and BAKKT exchanges were closed because they are not trading 24 hours a day.
G1: Closed price
G2: Market price at the time of opening

Bitcoin (XBTUSD, BTC1!, BTM1!) - November 10Hello?
Dear traders, nice to meet you.
"Like" is a huge force for me.
By "following" you can always get new information quickly.
Thank you for always supporting me.
-------------------------------------------------- -----
(1D chart)
You should check for movements that deviate from the 14838.0-15791.5 zone due to volatility around November 10 (November 9-11).
You also have to see if you can climb along the uptrend line (8).
If you are supported at 14838.0, this is a new entry point.
It is expected to absorb the amount of water as it moves up and down a lot with considerable fluctuation.
In a market situation where it is not easy to trade, I think the way to avoid double losses is to be directed, move, and find a trading spot.
(1h chart)-short-term strategy
Among the previous short-term strategies, it ended with Stop Loss after reaching the 1st target point of the SHORT strategy.
Movement came out around the 15340.0-15395.5 section.
Additionally, support and resistance were identified between the uptrend line (B)-(8).
Short-term strategies for this have been described.
If you cannot continue to see the chart after entering, it is recommended not to enter.
We believe that volatility is likely to occur near the time indicated on the chart.
(LONG)
1.Entry point: When rising above the 15340.0-15395.5 section, supported by the upward trend line (8)
Target point: 1st 15553.0 point or higher, 2nd 15776.5 point or higher
(However, if it falls below the uptrend line (8) or falls below the 15340.0 point, it is a Stop Loss.)
2. Entry point: When supported in the section 14669.0-14838.0 and breaks above the 14838.0 point
Target point: 16384.5 points or more
(However, if it rises above 15340.0 and falls from 15340.0, it is Stop Loss.)
(SHORT)
Entry point: When rising above 15395.5 point and breaking down below 15340.0 point
Target point: 1st 15102.0 point or less, 2nd 14863.0 point or less
(However, if it rises above the upward trend line (B), it is Stop Loss.)
-------------------------------------------------
(CME Bitcoin (BTC1!) 1D chart)
Today's gap is 15450.0-15435.0. (Not shown on the chart.
We need to check if the volatility around November 11 (November 10-12) results in a movement that deviates from the 14970.0-16220.0 range.
If it falls, we have to see if we can get support above 14170.0 and move above 14970.0.
We have to see if we can climb along the uptrend line (7).
-------------------------------------------------- ----
(BTC Dominance 1D Chart)
You should check for any movement that deviates from 64.63-66.39.
In order to expect the altcoin to rise, I think it must fall near the 63.38 point or fall below the 63.38 point.
As funds are concentrated in BTC, there is a market situation where some altcoins are pumping.
Although it is difficult to access the market, I think it is better to understand the movement of the coins you want to invest in, and the points of support and resistance in such a case.
-------------------------------------------------- ------
(USDT Dominance 1D Chart)
Between 7-12 November, you should check for any movement that deviates from the 3.760-4.390 segment.
-------------------------------------------------- -------------------------------------------
** Check support, resistance and abbreviation points.
** Support or resistance is based on the closing price of the 1D chart.
** All explanations are for reference only and do not guarantee profit or loss on investment.
Explanation of abbreviations displayed on the chart
R: A point or section of resistance that requires a response to preserve profits
S-L: Stop-Loss point or section
S: A point or segment that can be bought for profit generation as a support point or segment
(Short-term Stop Loss can be said to be a point where profits and losses can be preserved or additionally entered through installment trading. You must trade from a short-term investment perspective.)
GAP refers to the difference in prices that occurred when the stock market, CME and BAKKT exchanges were closed because they are not trading 24 hours a day.
G1: closing price when closed
G2: Market price at the time of opening

Bitcoin (XBTUSD, BTC1!, BTM1!) - November 9Hello?
Dear traders, nice to meet you.
"Like" is a huge force for me.
By "following" you can always get new information quickly.
Thank you for always supporting me.
-------------------------------------------------- -----
(1D chart)
We have to see if we can ascend above the 15568.5 point.
The volatility around November 10th should be checked for movement outside the 14838.0-16384.5 range.
If it falls at 15143.0, it is a short-term Stop Loss.
Also, if it falls from 14838.0 point, I think it is necessary to trade in installments to preserve profit and loss.
Support testing is expected to follow.
Please check the support and resistance points or sections to withstand this.
(1h chart)-short-term strategy
Among the previous short-term strategies, the short-term strategy ended with Stop Loss after reaching the 1st target point.
We have written a short-term strategy for short-term stop loss and breaking through important highs.
We expect there will be a support test, so keep an eye on the charts after entering the strategy.
If you still cannot see the chart, it is recommended not to enter.
(LONG)
Entry point: When exceeding the 15791.5 point
Target point: 1st 16384.5 points or higher, 2nd 16700.0 points or higher
(However, the Stop Loss point is 15568.5 points.)
(SHORT)
Entry point: When breaking below 15143.0 point
Target points: 1st 14838.0 points or less, 2nd 14669.0 points or less
(However, the Stop Loss point is 15340.0 point.)
-------------------------------------------------- -----
(CME Bitcoin (BTC1!) 1D chart)
Today's gap is 15630.0-15665.0. (Not shown on the chart.)
You should check for possible movement outside the 14970.0-16220.0 range.
We have to see if we can ascend above 15825.0 points
If it falls from the uptrend line (7) or 15260.0, it is a short-term Stop Loss.
If it falls from 14170.0 point, I think it is necessary to trade in installments to preserve profit and loss.
It's time to trade carefully to avoid double losses due to volatility.
-------------------------------------------------- ----
(BTC Dominus 1D Chart)
You should check for any movement that deviates between the 64.63-down trend line (3).
-------------------------------------------------- --------
(USDT Dominance 1D Chart)
Between 7-12 November, you should check for any movement that deviates from the 3.760-4.390 segment.
-------------------------------------------------- -------------------------------------------
** Check support, resistance, and abbreviation points.
** Support or resistance is based on the closing price of the 1D chart.
** All explanations are for reference only and do not guarantee profit or loss on investment.
Explanation of abbreviations displayed on the chart
R: A point or section of resistance that requires a response to preserve profits
S-L: Stop-Loss point or section
S: A point or segment that can be bought for profit generation as a support point or segment
(Short-term Stop Loss can be said to be a point where profits and losses can be preserved or additionally entered through installment trading. You should trade from a short-term investment perspective.)
GAP refers to the difference in prices that occurred when the stock market, CME and BAKKT exchanges were closed because they are not trading 24 hours a day.
G1: closing price when closed
G2: Market price at the time of opening

Bitcoin (XBTUSD, BTC1!, BTM1!) - November 8Hello?
Dear traders, nice to meet you.
"Like" is a huge force for me.
By "following" you can always get new information quickly.
Thank you for always supporting me.
-------------------------------------------------- -----
(1D chart)
It fell sharply from the 15568.5 point of the Fibonacci retracement ratio.
The fluctuation was similar to the rise on November 5.
It was expected that there would be a short-term decline, but the support range was extended because there was more fluctuation than expected.
We need to see if we can climb along the uptrend line (8).
Also, we have to see if we can ascend above the 15143.0 point.
If it falls, you need to make sure you get support at 14227.5.
It remains to be seen if the volatility around November 10 could lead to a movement that deviates from the 14227.5-15568.5 range.
The new wave is thought to have been created by breaking above the 13642.5 point.
Therefore, if you do not touch the 13642.5 point, the uptrend is expected to continue.
The wRSI_SR metric was created from the StochRSI metric.
Therefore, the interpretation can be interpreted in the StochRSI method.
You can finally analyze the SR motion made as the intermediate value of the RS motion.
You can see that the rising wave is still going on.
(1h chart)-short-term strategy
Among the previous short-term strategies, the SHORT strategy is still running.
If the current SHORT strategy ends after the time indicated in the chart, we will look at the situation and publish a new short-term strategy.
-------------------------------------------------- ----------
(CME Bitcoin (BTC1!) 1D chart)
Closed.
-------------------------------------------------- -------------
(BAKKT Bitcoin (BTM1!) 1D chart)
Closed.
-------------------------------------------------- --------
(BTC Dominance 1D Chart)
We have to watch for possible movements that deviate from 63.38-67.44.
If it moves above the 67.44 point, the bear market is expected to be underway.
If it falls below the 63.38 point, it is expected to be on an uptrend.
-------------------------------------------------- ------
(USDT Dominance 1D Chart)
It remains to be seen if the volatility around November 7-12 could lead to a movement outside the 3.760-4.390 range.
-------------------------------------------------- -------------------------------------------
** Check support, resistance, and abbreviation points.
** Support or resistance is based on the closing price of the 1D chart.
** All explanations are for reference only and do not guarantee profit or loss on investment.
Explanation of abbreviations displayed on the chart
R: A point or section of resistance that requires a response to preserve profits
S-L: Stop-Loss point or section
S: A point or segment that can be bought for profit generation as a support point or segment
(Short-term Stop Loss can be said to be a point where profits and losses can be preserved or additionally entered through installment trading. You should trade from a short-term investment perspective.)
GAP refers to the difference in prices that occurred when the stock market, CME and BAKKT exchanges were closed because they are not trading 24 hours a day.
G1: closing price when closed
G2: Market price at the time of opening
