Bitcoin Welcome to VolA very decent step down, this is not just bitcoin, futures are ugly. Save some cash, this is the first day of serious selling, there may be more on the way. We have brexit and Covid-19 mutation to deal with. For anyone that has bought BTC in the last few days, welcome to the club. This is part of the deal.
Bitcoincorrection

BTC will make a -30% correction ritual👀Historically, $BTC always made around -30% correction, even in a bull market
It's time to sell Bitcoin; Revealed!!!Hello, in this analysis I want to show you how to sell and how to bougth Bitcoin in key zones usign indicator keys to study it.
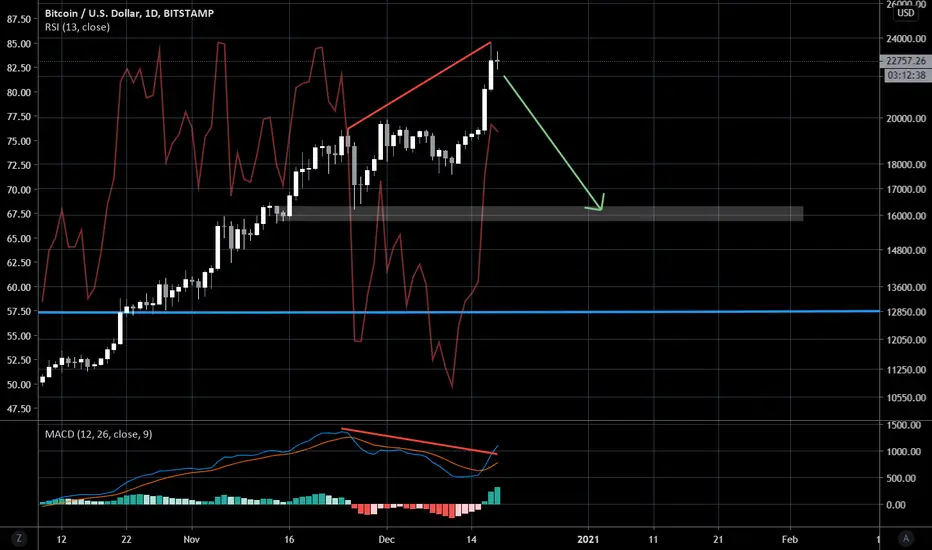
Ok, this strategy it's called bought cheap and sell expensive usign the price action + RSI. So, in this scenario we have that Bitcoin it's far away from $10,000 USD to $19,000 USD. Now, the crypto-markets need a correction before to continue up. So, we are in weekly timeframe and I use the RSI and also I quit some configuration and I did a personalized my configuration to understand it to invest in long term in Bitcoin. So, I add this green and red line. all lines are horizontal in the RSI.. The green line it's a zone to bought and the red line it's a zone to bought. And also, I share you this with arrows. Now, this broken line it's any key to bought, but yes it's so consider it as support. Now, the strategy it's simple to invest in Bitcoin in long term. So, I add this red line touching the past RSI point in the past bull rally 2017
Looking this screenshoot, we have that when the RSI touch the red line, this it's a sell iniminent that how occur in the past and then, the RSI it's nos leading down to find down the green line, that's mean a bought. It's simple, using the price action, using any indicator like RSI. Now, in case when Bitcoin starting a bearish trend like 2018, so we have this sitution.
As Bitcoin broke down the green line, so that obviously the trend could be bearish and then, using some configuration as I share you, we could to have any alert of then.
Now, actualy we are in the selling zone. So, my reccomendation for you it's that we can to see some days of correction and then, we would need to still pending in two levels to bought. My 2 possible levels that Bitcoin could to down are the $16, 500 USD and $13,800 USD. So, in these zones are possible boughts!!!
So, I will going to update this par when Bitcoin touch these possibles correction wheter are $16,500 USD or $13,800 USD.
***My purpose it's to share and have any plan

HODL! but not to your crypto...It is just an addition to my previous BTCUSD idea which was more based on RSI indicator. Here we have not 1, not 2 but 4 different resistances: the first and the most obvious one comes from the previous ATH, the second and the third one comes from the upper levels of the upward channels 1 & 2. The forth resistance presents itself in the RSI - currently we are stuck at 84 value. But wait, there's more: Greed and Fear index is 95 which is crazy even for Bitcoin (this index has never seen bigger numbers). And hey, we still have to see at least 25% correction and touch 20 weeks MA.

Bitcoin it's into this bearish movement soon!!! ABC correction!!So, this is a counsel for you on what kind of trend we are. So, at the moment, we could to continue drop in the next days, remember that Bitcoin doesn't have force to continue up and maybe a correction it's neccesary to continue up!!! Now, I believe that Bitcoin it's trying to break up the historic maximum near of $20,000 USD. Remember the Bitcoin history maximum was $19,664 USD. That it's a higher price that Coinbase exchange registered in the history of Bitcoin.
So, I have my own target to find down a short position if Bitcon for second time doesn't find with successful to break down the maximum historic price that Bitcoin it's reach up!!!

Nailed BTC Top - Short continuation of C Wave 30% DROP!Take a look at the charts for better direction. on the 4h chart we have lots of indecision happening. With one hour left on the closing of the candle, it can go both ways. There is hanging man fighting the bears for its life.
This can go both ways, I am not shorting here just yet, however I see a high probability that we are going to zig zag down to my final target. If it breaks down to my first target down, I will open my short. For now play safe & keep an eye out for this crazy monster.
My tops and bottom indicator has signal the end of the up movement.
Happy trading & stay safu!

Bitcoin Bottom might be near but its not there yetI believe once 200 EMA crosses 350 EMA from above we might see the bottom and end of this bear market. After that we can start asking the moon questions LOL

we are on the 5th wave now?Hmm I actually though we ended our 5th wave and we were in a correction, but after looking at the Renko Chart view this time in a 4h time frame, it clearly shows that we are in our 5th wave now, and could end in the 12,100'sh range. then the real big correction should begin down to 8,500-8,800 range.
what are your thoughts?

BTC testing the bull/bear lineWhile many were promoting purchasing BTC, I was airing caution. The green trend line off higher lows remains the battle line between bulls and bears. We already have a bearish cross on the longer term 4h chart and a candle close below the green line coul open the door for 10k and possible even 8,000. The bearish scenario would fit well with a more normal primary wave that would generate a more typical 50-61.8% retracement. In addition, BTC had traced out a bearish Gartley with a target below 8,0000. The war is underway. I'm not holding BTC and been looking for the bearish resolution to provide an ideal entry.

BTC/USD Support and Resistance. 2 most probable scenarios 2017.There are two support levels to watch and hope for. If we break Support Zone 1 in the next couple hours, the price will go down to Support Zone 2 and most likely bounce back to resistance level ~17K.

Bitcoin artificial price maintaining and DROP Bitcoin price correction and this so called "levels of artificial price" which is being hold by sharks 'n' wales should not last long.
When Bitcoin makes his next retracement (which is happending already), you should all cashout your positions (except maybe XRP or few more altcoins), but, in general, whole market will make a 30%+ dropdown.
Therefore, i' m suggesting you to cashout your positions on time, because BTC will RESET MARKET ON FACTORY SETTINGS. Keep that in mind.

BTC Shorts BTC hit 19,700 to the point and started falling. Bitcoin corrections have started and we can see price drop to as low as 5k. If we break the supply zone of 10k I see btc falling more if we see reversals form on the 4h and Daily charts I will buy btc there
