Somethings Off. Santa Clause Rally Ending In Sync w/Dollar Drop?Trading Fam,
Providing a quick update on a few new and alarming chart events and indications I am seeing. Usually, when the dollar drops, as long as the VIX remains low, stocks and crypto will rise. However, an anomaly is currently occurring on the charts. As stocks seem to be topping, the dollar is also testing major 17 year and 42 year support! I am not quite sure how to read this, but it seems that in this case, we could see stocks drop along with the dollar. How could this happen? Unknown. Could it have something to do with BRICS? Could it have something to do with the upcoming Fed decision? I honestly don't know how to answer this. I am simply just reading what the charts are showing me and telling you what it might mean for stocks and crypto.
Let's dive in!
✌️Stew
Bitcoincrash

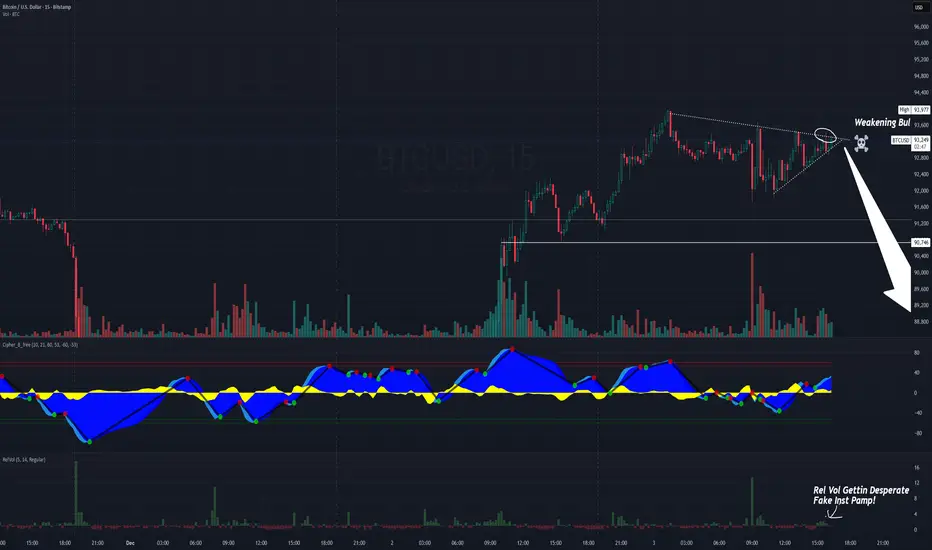
The Bitcoin Meteorite and MSTR falling knifeThe US Trading session just ended and handed Asia a Bitcoin Meteorite. If there's one thing Asia hates - it's fake pumps...and that's all today was on BTC. We'll be lucky if BTC is over $90k when the US market opens tomorrow on 12/4.
Asian session behavior is predictable:
They love to liquidate overleveraged U.S. breakout traders
They fade fake pumps
They push price back toward equilibrium
At the very least we pull back to $92, and while I think $91k is more likely and even $90 isn't out of the question. The other concern is all the benevolent articles coming out about BTC. Larry Fink said bitcoin is the new bellbottoms...or whatever. When they flood the market with bogus 'opinion' pieces, these people only speak because they want to influence retail traders. You really think the CEO of black rock wants to drive the price of BTC UP before they expand their holdings... If they're talking about something...they're selling you a bridge. I think BTC and it's biggest holding company MSTR (which managed to buy only 130 Bitcoins this cycle (BWHAHAHA) is going to crash even harder than it has been. $1.4B in cash reserves to fund $773+ Million in annual dividends while diluting shares is a recipe for bankruptcy and a $.01 share price...
Shorting BTC and MSTR all week long and twice on Sunday.
Bitcoin Ready to Casually Liquidate $300MLadies and gentlemen, today is November 26. If you’re still alive in the market, let me be the first to congratulate you—because that means you actually use proper capital management and set stop losses.
In this analysis, we’re going to pinpoint Bitcoin’s next triggers together, get a crystal-clear picture of the current structure, conditions, and scenarios, and trade them side by side.
Hey, I’m Skeptic , and this is Skeptic Lab . If you want to level up your trading knowledge through data, psychology, and real strategy and actually become consistently profitable, you’ve come to the right place.
Let’s jump straight to the charts. 📉
In the daily timeframe , after that massive sell-off candle on November 21, Bitcoin immediately went into ranging mode. Volume dropped hard, and RSI bounced back above 30. After breaking 100k—as I’ve been saying for weeks—the MWC has officially turned bearish, so every bounce back to that zone is nothing more than a pullback. If this 4H correction we’ve started continues, it can easily reach 91,213.99 (the 0.5 Fib), so if you’re opening longs, your target should be exactly 91,213.99.
🔍Now let’s drop to the 4H timeframe to hunt for actual triggers.
In the 4H, we have a weak upward channel that’s really just the daily bearish correction. We’re ranging between two key levels:
- Resistance: 88,118.70
- Support: 86,224.62
Breaking either one is our long or short trigger.
But here’s the risk-management difference: 📍
For longs (which are counter-trend to the MWC), we use a very tight stop loss and take profit quickly.
For shorts, we can accept slightly higher risk and scale out with partial profits.
Important note: Throughout this entire range box, volume has been consistently dropping—this means the next move is getting closer and closer. Stay very alert inside this box.
If this analysis helped you, I’d really appreciate a boost—it gives me energy to keep going.🩵
Now get outta here.

You’re Not Supposed to See This Analysis…Ladies and gentlemen, previously on Skeptic Lab—if you're following the page, you're probably short from the 101k level —we talked about upcoming support levels for Bitcoin. We pointed to the first support at 98k, then in order 95k and 91k. But one by one, all the supports got blown through, and now it's consolidating below the key 91k support. So, it's best we do an update on the overall structure that's formed, the next supports, scenarios, and triggers we could have.
Let's start from the weekly timeframe:
It makes sense that this week's candle has a smaller size—we've reached a daily support level, which is exactly 91,213.99 . If we lose that, the next support levels are at 87,566.47 .
In the daily timeframe
I see a high probability of ranging here. First off, the amount of liquidations has been decreasing each time: initially 300 million $ liquidated on the 101k break, then 250 million on the 95k break, but yesterday only about 195 million dollars in long positions got liquidated (if you notice, volume has also been getting lower and lower on the drops somewhat). This means the big traders aren't really present down here in a serious way, which could lead to a multi-week range. That's assuming the support zone from 90k to 91,213.99 holds— if it doesn't , we could see more downside to the weekly level I mentioned.
In the 4H timeframe
if you're with me on a position from 101k, I think it's a good spot to fully take profit. I see potential for ranging here or a reversal from this level, since it's a very key support. My long trigger here is specified as breaking the resistance at 96,066.89 in the 4H timeframe—that'd be our first long trigger. Why this level? Because after reacting to it, we dumped 7% :) So it's a super important level. For shorts, I'm waiting for a range box to form here—otherwise, I'm not opening any positions right now. Generally, opening positions right on strong support/resistance zones leads to your win rate dropping. Why? High volatility / high chance of fakes / lots of shadows... all of that tanks the win rate.
Finally, BTC.D also dropped super sharply with Bitcoin's dump.
This means going forward, if Bitcoin ranges or does a bearish range + BTC.D goes a bit uptrend, altcoins will give really good short triggers. That's it. Now get outta here.

BULLRUN IS OVER, ALTSEASON WAS A DREAM—WE ARE DONE!!!!Ladies and gentlemen, as I'm writing this idea on November 13, 2025, Bitcoin is in the midst of breaking its crucial 100k daily support. Let's dive into a quick analysis together and figure out what we should do next.
If the daily candle closes like this, what does it mean? Starting with the candle itself: upper shadow about 1.5x the body, tiny lower shadow, and a solid body. This screams that buyers tried hard to drive the price up—they burned through a ton of cash—but sellers absolutely crushed them, dragging it right back down to the support level with overwhelming force. That leaves buyers running on fumes for any follow-through, and a sharp 10-15% plunge? Totally not out of the question after a candle like this. Not trying to scare you—just calling it like the chart sees it.
Point two: Before this floor break, we were consistently printing lower highs, with volume dipping during corrections and spiking on the drops.
So, what's next? If the candle closes in this shape, come next week, every scenario shifts to short-only—we're not even entertaining longs anymore. Scenario B: If this candle reverses with a strong shadow and closes back above 100k, tomorrow we'll ABSOLUTELY hunt for long positions, as it'd form a classic V-pattern in the lower timeframes. Either way, we gotta be ready.
Interesting note: Dominance is climbing alongside Bitcoin's dump, which means shorts on altcoins could yield even sweeter profits going forward. USDT.D is closing above its daily resistance too—not a good sign for the market at all, and it supercharges our bearish scenario.
That's it... Now, after reading this, go do your own market analysis—far away from any FOMO. Grab a notebook, jot down every scenario, and map out your Plan A, B, C, D... And for the love of gains, don't forget capital management. Now get outta here.

Bitcoin Daily Analysis #11 – November 05, 2025 Scared? 😅
Good — pay close attention to how you feel these days and journal everything. The most valuable financial lessons come exactly from moments like these. 📖
As you can see, Bitcoin is under heavy selling pressure, and its sharp drop around the $100,000 zone has so far been supported by buyers.
If that support breaks again, you could consider opening a short position, but ⚠️ don’t hold it too long — the overall trend remains bullish, and a strong rebound could follow.
Around $104,000, we might see a risky long trigger, but only with tight risk management and a controlled position size.
If Bitcoin tests $104,000 and gets rejected, a deeper correction or even a sharp drop could follow.
We’re in a phase where the market could swing both ways — once it breaks out of this uncertainty, expect a powerful move. ⚡
Macro data and recent economic news still favor Bitcoin, and interestingly, during this decline, the big players have mostly stayed on the sidelines, with lower-than-average trading volume. 📈
No matter which way Bitcoin moves, your risk management will determine your success. 🎯
So avoid emotional decisions and let the chart structure guide you. 📊
Disclaimer:
This content is for informational purposes only and does not constitute financial or investment advice. © DIBAPRISM
Larry D.Kohn

Bitcoin Update – November 1, 2025 - Revised 2026 target $46KBitcoin and Crypto Market Update – November 1, 2025
Bitcoin has completed its cup-and-handle pattern , hitting the technical target near $118,000 before rolling over into a fresh rising-wedge formation . The new structure is supported by declining volume , hinting at fading momentum and a potential pullback toward $46,000 .
Today’s move mirrors broader macro caution—the Fed’s pause on rate cuts and Trump–Xi trade tensions have triggered a wave of risk-off sentiment. Bitcoin is down 3.8% to $110,063 , Ethereum −3.6% ($3,853), and XRP −4.1% ($2.51).
Despite the dip, ETF inflows remain strong (BTC +$202 M, ETH +$246 M), showing institutions still buying the weakness. November historically delivers +42.5% average gains, but traders should stay alert as the rising wedge matures.
Technical summary:
* ✅ Cup & Handle target ≈ $118 K (completed)
* ⚠️ Rising Wedge forming → Target ≈ $46 K
* 📉 Volume decline = weakening trend strength
* 🟢 Institutional inflows = long-term support, volume declining over 5-10 year cycle
📊 Posted by Market Monkey — decoding the market’s next move.

BTC 1d forecastBTC WILL GO DOWN from 11-20 of August till the end of Aug (25 +/-1day)
From there we are PUMPING till beg of Nov, from there DUMP till mid Dec and one last PUMP til mid JAN beg FEB!
Than - THE END!!!! FINISH! Sayanara

Bitcoin: The Final Distribution Phase BeginsBTC - "beta test coin" was a great success. Time to release the real true currency.
📊 The chart tells the story, Bitcoin has reached its peak cycle, and the mainstream distribution is underway. 📉 MACD flipping bearish, RSI divergence, and key market phases indicate the shift. 💰 The next evolution of money is coming. Are you ready?
NASDAQ:MSTR NASDAQ:COIN NASDAQ:MARA NYSE:CRCL TVC:GOLD TVC:SILVER CRYPTO:BTCUSD

BTCUSD (Bitcoin) Setting Up for a Trap and Crash📊 BTCUSD Smart Money Breakdown – May 23, 2025
This is a textbook liquidity trap setup — and the roadmap is crystal clear. The market already induced buyers at the top, is now tapping into an Order Block (OB) + 79% zone, and is preparing to nuke.
🔍 Market Narrative:
Strong high established – retail likely placing longs above that.
Clean retracement into Order Block zone (110,322 – 110,850) – where Smart Money is selling into demand.
PA is projected to fake a bullish breakout, reverse, and go for a deeper Fair Value Gap fill near 107,786, eventually targeting the Sell-Side Liquidity zone at 106,188.31.
📍 Key Confluences:
✅ OB + 79% Fibonacci = strong SMC reversal zone
✅ Clear FVG waiting to be filled = imbalance = magnet
✅ Weak low at 107,786.83 = perfect inducement for Smart Money run
✅ Final stop = Sell Side Liquidity sweep below 106,200
📉 Price Path Forecast:
Reject Order Block + Premium zone (110,496 – 110,850)
Retrace → FVG fill (between 108,900 – 107,800 zone)
Minor pullback or fake rally
Final move: liquidity raid under 106,188
Smart Money buys low again, setting up next bullish leg (later)
🎯 Trade Plan (Short Idea):
Entry Zone: Between 110,322 – 110,850 (OB)
SL: Above 111,000 (above inducement)
TP1: 107,786 (Weak Low)
TP2: 106,188 (Sell-Side Liquidity Pool)
RRR: Approx. 1:4 to 1:5 🔥
🧠 Institutional Logic:
Retail sees sideways structure = buys top resistance
SM sees that = sells into premium zone
This is accumulation → manipulation → distribution at its finest.
💬 Think BTC’s about to drop hard? Type “DUMP” or 🔻 in the comments! Let’s see who’s trading with the big boys.

Bitcoin: Breaking Below $80K Soon,10% Correction on the Horizon?Hey Realistic Traders, Bitcoin is consistently hitting new lower lows. Could this signal that the bear market is here to stay? Let’s dive in.......
On the H4 chart, Bitcoin is clearly in a bearish phase. It consistently trades below both the trendline and the EMA 200, reinforcing the downtrend. Additionally, a rising wedge pattern has formed and broken out, and the MACD has shown a bearish crossover. This crossover is a key indicator, signaling that momentum is shifting from buyers to sellers.
Together, these signals suggest that Bitcoin may drop toward our first target at 79,081. After reaching this level, a short pullback is expected as traders take profits before the price continues its descent toward a new low at 73,633.
This outlook remains valid as long as the price moves below the stop-loss level at 89,557
Support the channel by engaging with the content, using the rocket button, and sharing your opinions in the comments below.
Disclaimer: "Please note that this analysis is solely for educational purposes and should not be considered a recommendation to take a long or short position on Bitcoin.

BTC Distribution towards 65k / 50k - ExplanationIn this video, I break down why Bitcoin's market structure is shifting bearish.
I explain the distribution phase, the key signs to watch for, and why I believe price is likely to trade lower. To give you a clearer picture, I also show a real example for comparison.
🚀 Topics Covered:
BTC structure switching bearish 📉
Understanding the distribution phase
Why I expect price to drop 🔻
A real example for comparison
If you find this analysis helpful, like & subscribe for more insights!
Let me know your thoughts in the comments.

bitcoin to 15k a bearish pattern just appeared on the monthly chart ,it suggest an unexpected move to 15k , this sounds crazy but that what my pattern says, If price broke all time highs then this pattern is invalid however as long as we are trading below all time highs the pattern remains strongly suggests the bearish move, there might be a fundamental reason in the near future that supports the idea

Bitcoin: The Final Move Before a Crash to $3000It seems that Bitcoin has started forming an ending diagonal, which serves as the final impulsive waves in Elliott Wave Theory but has a corrective 3-3-3-3-3 structure, also known as a rising wedge. This wave will likely mark the end of a cycle pattern that began with Bitcoin’s inception, correcting all the growth achieved so far. A correction of this magnitude has no strict limit, but it will likely end at the lower-degree fourth wave, around $3000 per Bitcoin. This is also where the power line lies according to the volume profile. This scenario will gain more weight if, in the coming days, instead of heading to new highs, we drop below $66,500 again. In that case, I expect a correction to the $59-60K range, followed by the last upward three-wave move toward $80K. From there, at the first signs of a reversal, I believe it will be prudent to focus exclusively on short positions, targeting extremely low levels below $10,000 per Bitcoin.

BTC Price Targets $44K & $15K - ETHBTC & BTC.DIn this video, we dive deep into the current bearish market structure
Focusing also on ETH/BTC and Bitcoin Dominance (BTC.D). Understanding these key indicators is crucial for gauging the broader market trend and positioning yourself for potential moves ahead.
We’ll start by breaking down ETH/BTC, analyzing the weakness in Ethereum’s price action relative to Bitcoin, and what this could mean for altcoins in general. Next, we’ll examine the Bitcoin Dominance (BTC.D) chart, which is showing a shift in capital allocation within the crypto space. This movement could signal Bitcoin's growing dominance as altcoins lag behind.
Lastly, we discuss two critical Bitcoin price targets: the near-term resistance at $44,000, and the potential downside scenario to $15,000. These levels could define the next big moves for Bitcoin and the overall market direction.
Make sure to watch until the end to get a complete picture of the market’s current state and how to navigate it!
🔔 Don't forget to like, subscribe.

#BTC Below 48K..Are You Ready? Market Braces for Sudden Downturn#BTC Crash Looms: Market Braces for Sudden Downturn.
BTC may start dumping from 66600. This dump will be primarily to liquidate long positions. I have already shared trades for all altcoins. Please DM me for timely updates and all trades.

BTC remains bearish next targets 57.7k and 56kIn this video, I provide an update on my previous trading analysis.
I'll discuss the current targets for the bearish scenario and highlight the key levels to watch. Additionally, I present a bullish counter-idea and explain where the invalidation of the bearish thesis might occur. This way, you'll be well-prepared no matter which direction the market takes. Stay tuned to catch all the important details!

BTC SHORT The chart indicates a potential move where Bitcoin (BTC) is currently testing an area of interest around 60,715.9 USDT. The price is approaching a key resistance zone marked as MMSM, which could provide a selling opportunity if the price fails to break above it convincingly.
Trade Setup:
Stop Loss: Place a stop loss just above the 62,500 USDT level to protect against potential false breakouts above the resistance zone.
The initial target for this trade would be around the 55,940.7 USDT level, where there is an imbalance wick, which could serve as the first point of profit-taking. Further downside targets could be around the 48,889.4 USDT level, representing a more extended move.
Risk/Reward: This setup offers a favorable risk/reward ratio, as the downside potential outweighs the risk if the resistance level holds.
Additional Notes:
- If price breaks and holds above the 62,121.2 USDT level, reconsider the short idea as it would invalidate the current bearish setup/structure.

BTC Bullish Target $70K vs. Bearish Drop to $41K | ICTIn this video, I dive deep into two potential scenarios for the market:
A bullish scenario targeting $70,000 and a bearish scenario pointing towards $41,000.
I explore the concept of a smart money reversal and the market maker sell model to provide a detailed analysis of possible price movements.
Additionally, I discuss the bearish price structure and what it could mean for the market in the near term. Whether you're bullish or bearish, this analysis will help you understand the key levels to watch and the strategies that may unfold.
I would love to get some feedback! 🔥

BTC SHORT TO 41kTrade Rationale:
Price has reached a significant resistance level, and there is a clear bearish structure indicating potential downside movement. The current setup offers a high risk/reward ratio, targeting a return to the previous low, with a stop loss placed just above the recent high.
This trade is based on a continuation of the bearish trend observed over the past several weeks.

BTC might dump to 41k (Black Swan)Market Maker Sell Model Analysis | Potential Short Targets
Description:
In this video, I dive deep into the Market Maker Sell Model and discuss potential short targets. We'll explore how Market Makers build their positions during a downward move and how you can effectively capitalize on these movements to trade profitably.
Watch the video and let me know your thoughts or any questions you may have in the comments!

BTC SHORT BLACK SWAN 41k per BTCMarket Maker Sell Model with Potential Black Swan Event
This trade represents a classic Market Maker Sell Model (MMSM), where the smart money appears to have engineered a sell-off after accumulating positions at higher price levels.
- Initial Setup: The price action shows a significant liquidity grab at the top, leading to a sharp decline, indicating the possible distribution phase by market makers. The sell-off from the "SMR" level confirms the beginning of the MMSM.
- Entry Point: After the final push-up to the "SMR" level, where the market takes out liquidity, I entered short once the price confirmed rejection and began its downward trajectory.
- Targets:
- TP1: Set at the first significant support level.
- TP2: Set at a lower support level, which aligns with the overall downward trend.
- Market Context: The sharp decline hints at broader market instability. This pattern, combined with macroeconomic indicators, suggests the possibility of an incoming Black Swan event, which could exacerbate the sell-off and lead to a further drop in BTC price.
- Risk Management: Stop-loss was placed slightly above the "SMR" level to protect against potential false breakdowns. However, considering the potential Black Swan scenario, additional caution is warranted.
Conclusion: The price action strongly indicates that market makers have distributed their positions, and the sharp decline aligns with the Market Maker Sell Model. Given the possibility of an unforeseen market shock, this trade could be a precursor to a more significant market downturn.

BTCUSD SHOWING A GOOD DOWN MOVE WITH 1:10 RISK REWARDBTCUSD SHOWING A GOOD DOWN MOVE WITH 1:10 RISK REWARD
DUE TO THESE REASON
A. its following a rectangle pattern that stocked the market
which preventing the market to move any one direction now it trying to break the strong resistant lable
B. after the break of this rectangle it will boost the market potential for break
C. also its resisting from a strong neckline the neckline also got weeker ald the price is ready to break in the outer region
all of these reason are indicating the same thing its ready for breakout BREAKOUT trading are follws good risk reward
please dont use more than one percentage of your capitalfollow risk reward and tradeing rules
that will help you to to become a bettertrader
thank you
