#BTC Bear Flag $10k FloorWhen in doubt Zoom out.
A picture can paint a thousand words.
85% Draw Down?
75% Draw Down?
IMHO, Bearish looking to play the Bull trap back down to $10k btc.
Bitcoincrash

#BTC $10k - 40% Rug PullBTC is in for another repeat of history.
After a 75% draw down from the previous ATH, BTC seems to drop another 40% from the 75% draw down level to meet the historic 85% draw down narrative.
BULL TRAP Zone:
$18.1k to $20k
Correction to $16k

#BITCOIN CRASH IT ABOUT THAT TIME BINANCE:BTCUSDT
Hello everyone bitcoin is about to make another scary move again (11k or 10k range),
I'm not always happy to see bitcoin falling but what do we do?
Yet every fall Is always an opportunity for those who understand. so let go to the main discussion where I'll be expecting the next stop of #BITCOIN price movement.
no long story if you have been following my previous BTC IDEAS if you haven't watched my previous bitcoin ideas go and do so now to understand my price tags and movements.
so, my next stop where I'll be expecting bitcoin is at price ($11,620.45 ---- 10,086.26) at this range do not expect bitcoin to go lower meanwhile this could possibly be the golden button ever!!!!

Bearish flag resulting in 10k Bitcoin
Bear flag:
Short term:
Bitcoin seems to have a systematic bounce from its current bottom in the 40k range, where the consolidation zone may bring k the price to the 45k range where the over-arching trendline is crossing and continuation to 49-51k.
In the short term can we see a bottomed out MACD and an bottomed out RSI with room to reach levels of 45k and 51k range.
Long term:
After re-touching 45k and 51k ranges, would the price crash downwards as buyers have taken profit at these two price ranges.
The bearish flag is formed and the the over arching trend is found once again on this down sloping trendline.
Price movers which pushes the price downwards are:
- The recession warning from Fed, impacting eg. the housing bubble
- The supply-chain crisis impacting the economy negatively, eg. the food prices negatively
- Increased oil prices
- War time
These factors in a period of economic slow down will make people less likely to invest in cryptocurrencies to keep dollar in their wallets. Here is there a negative correlation between DXY (Dollar Cost Index) and the price of Bitcoin.
These reasons may cause the price of Bitcoin to follow the bearish flag formation resulting in a strong downtrend and reaching prices of 20k and 10k.

🌕 BITCOIN (BTCUSD) - 23RD LUNAR DAY CAPITULATION WARNINGToday is the 23rd Lunar day, the moons final phase. If Bitcoin breaks that neckline, today is the day.

Bitcoin Bottom Might Be $6,883This is a chart of the Natural Log of the YOY Running ROI of BTCUSD/SPX:
Ln
The pattern formed is striking in that the tops and bottoms both form perfectly linear patterns going back to the creation of Bitcoin.
Using the same steep slope this indicator had at the end of the last 2 cycles indicates a value of -2.07 at the end of this cycle, if the pattern holds perfectly.
Assuming the SPX stays constant at 3,900, Bitcoin would need to drop to $6,883.69 for the value to equal -2.07.
Alternatively, if Bitcoin were to remain constant at $17,000, the SPX would need to raise to $9,631.56.
TLDR: FOR THIS PATTERN TO CONTINUE, BTCUSD WOULD NEED TO BOTTOM AT $6,883 (GIVEN A CONSTANT VALUE FOR THE SPX)

BTC/USDT In Freefall - $14K Incoming? 📉🚨Wow... What a crazy past few days in crypto with Binance and CZ gobbling up FTX.
This along with insolvency rumors not just at FTX, but other large exchanges is causing a serious meltdown across all cryptocurrencies. ❌
Looking at the Bitcoin 8H chart, we see that we just crashed through a major support zone. This goes in tandem with our mid-term thesis that Bitcoin is in for more pain. 🤝
We're looking for a local bottom around $14-16K.
Still a volatile week ahead with CPI and elections finishing up.
Stay safe and eyes peeled! 👀

BITCOIN (BTCUSD) - Support Retest 📉BITCOIN (BTCUSD) - Support Retest 📉
Take profit and stop loss levels shown. Please make sure you implement your risk strategy when reaching each TP, by either tightening stop loss or taking partial profits.

BITCOIN CRASH MORE?Price of btc coming to retest its strong level of interest where previous strong suppor now as a resistance and also rejecting from the level. SO good short trade according to levels given in the chart.

Bitcoin heavy coin inflow into exchangesNext week we have the FOMC meeting.
Most likely the Federal Reserve will raise rates by 75 basis points. In case of 100 basis points increase, i expect a sell-off in the markets.
Major cryptocurrencies have seen heavy coin inflow into exchanges recently.
I expect a strong sell pressure next week.
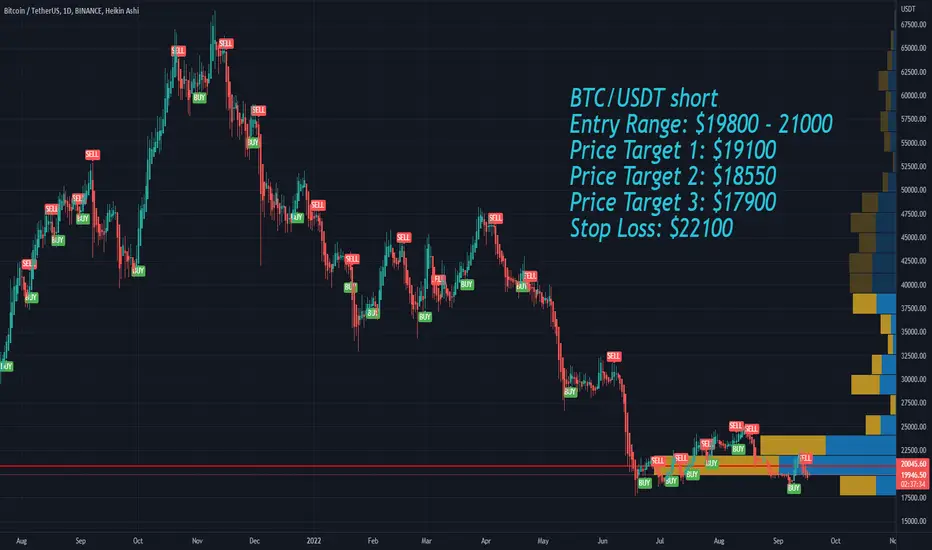
BTC/USDT short
Entry Range: $19800 - 21000
Price Target 1: $19100
Price Target 2: $18550
Price Target 3: $17900
Stop Loss: $22100
bitcoin trap /227800 good short $BTC Get ready for a huge dump. we're not going anywhere. September and October is usually bad for crypto and this little pump is
right on time to fool a few people into buying at these prices. keep buying, I'll wait.

$ETHUSDT UPDATE!!!Hi Snipers,
Please refer to the recording for the next price levels and scenarios.
Thanks
MS

CRYPTO MARKET UPDATE!!! BITCOIN HANGS ON!Hi Snipers,
Please refer to the recording for the next price levels and scenarios.
Thanks
MS

CRYPTO MARKET UPDATE!!! BITCOIN REBOUNDS! Hi Snipers,
Please refer to the recording for the next price levels and scenarios.
Thanks
MS

$AVAXUSDT UPDATE!!!Hi Snipers,
Please refer to the recording for the next price levels and scenarios.
Thanks
MS

$LTCUSDT UPDATE!!!Hi Snipers,
Please refer to the recording for the next price levels and scenarios.
Thanks
MS

$SOLUSDT UPDATE!!!!Hi Snipers,
Please refer to the recording for the next price levels and scenarios.
Thanks
MS

CRYPTO MARKET UPDATE!!! A BULL TRAP SET UP! Hi Snipers,
Please refer to the recording for the next price levels and scenarios.
Thanks
MS

$FTMUSDT UPDATE!!!!Hi Snipers,
Please refer to the recording for the next price levels and scenarios.
Thanks
MS

$QTUMUSDT UPDATE!!!Hi Snipers,
Please refer to the recording for the next price levels and scenarios.
Thanks
MS

CRYPTO MARKET UPDATE!!! CRYPTO BUILDS STRUCTURE!Hi Snipers,
Please refer to the recording for the next price levels and scenarios.
Thanks
MS

CRYPTO MARKET UPDATE!!! WHAT TO EXPECT THIS WEEK?Hi Snipers,
Please refer to the recording for the next price levels and scenarios.
Thanks
MS

CRYPTO MARKET UPDATE!!! MARKETS LOOK AHEAD!Hi Snipers,
Please refer to the recording for the next price levels and scenarios.
Thanks
MS
