BITCOIN now in Cycle ATH Zone but is BTC still in Cycles ?I first drew this chart back in 2024 and it is amaxing how things have played out,
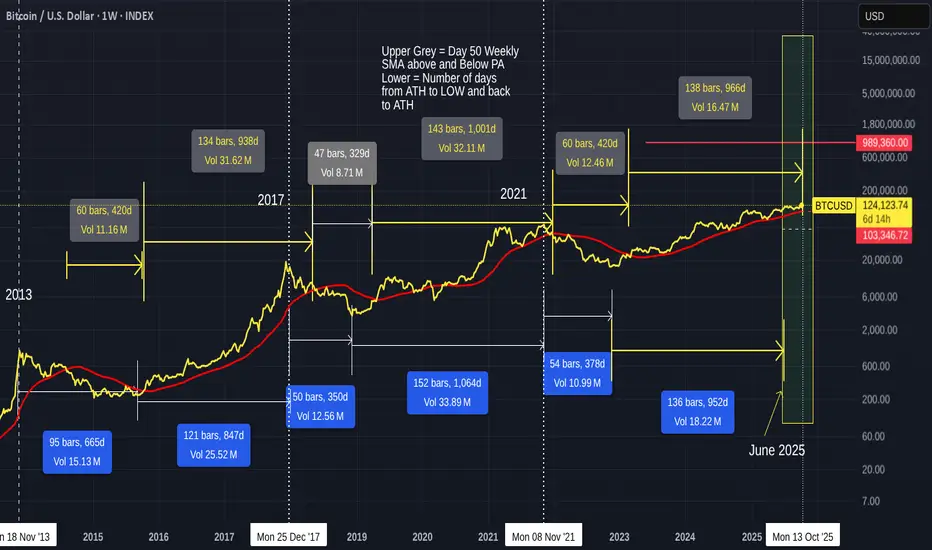
The Numbers in Grey boxes are the number of Days the 50 SMA ( red) has been above and below PA.
The Blue, Below PA is the day count for PA Cycle High to cycle Low and Back to Cycle high.
We have already past the "High Low" Day count for this cycle ATH and we are now on the Zone for the 50 SMA day count ATH. The peojected date for this ATH is 13 October.
Note how Similar PA & 50 SMA is in the 2013 - 2017 Cycle.
I was also running a PA Fractal chart showing similarities to PA and we can see how close it was until February this year
For me, the reason we went "Flat" from February onwards is simly because of the Long Term resistance over head.... a line that has rejected EVERY Bitcoin ATH = this is all explained in previous posts. See the Blue Arc.
It is that Blue Arc we need to Cross over. This Arc has kept PA Flat this cycle......
Looking at a Zoomed in Chart, we can see how that 50 SMA is a line of strong support.
Should PA retreat, the 50 SMA is at around 103K at this time.
The MACD is just under but in a zone where PA has retreated from
This does NOT automatical Mean PA will Drop from here. Though on lower Time Frames, MACD is up High in Oversold.
However, as the 4 hour shows us, It is already dropping from OverSold and yet PA has hit a high
Divergence is in play
One thing that dies hint at a pull back is the RSI being up in Oversold on a Daily chart
But it should be understood, RSI Can range High or Low
So, are we in Cycle Still ?
If we are, we should expect a beginning of a BEAR market in the next few weeks. But we have not really seen the "Top" pattern and Profit taking yet.....
Until that happens, I really am inclined to believe we have broken the cycle patterns.for a number of reasons.
For instance, the MVRV Z Score
This has not even past the levels seen in previous Runs
BUT as a precaution, it is worth noting that Dash orange line, that starts where the Nov 2021 ATH Was.
We have been rejected from that level already this run But we Still have room to get back up to that level at the mooment.
The Main reason i feel things are different are that Blue Arc I mentioned earlier.
We HAVE to break above that and remain there.....
We are too close at this moment and a Bear market WILL take us back below that HUGE line of Very Very Strong resistance. The Daily chart below shows this
We need one more push to take us Higher, to give us Room to remain above, even when Bitcoin Does correct .
Note that 3 Fin extension on the last chart posted.
We just got above the 6. We need to Rise far enough over that for it to act as support ewhn retested.
3, 6, 9
9 Fib extension at around 180K
Just saying
NEW CYCLES ARE BEGINNING
Bitcoinfib
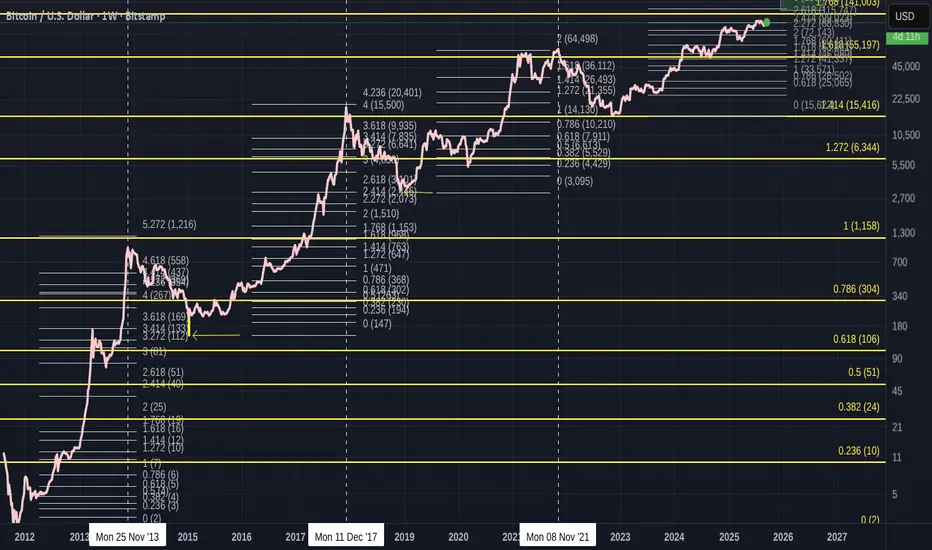
Bitcoin Global / Local Fib Levels point to the TOP area to watch
Each Low to ATH has a "Local" Fib extension Set
And the Yellow Fib extension is from the 2011 Low to the 2013 ATH and I use this as a "Global" Fib as that was, in reality, the first ever Low to ATH before a sustained draw back.
Please Note that as Candles would not show very clearly at this scale, I have used a Line. This has some inaccuracy as to true candle Ends. As a result, it looks like some Fibs are misplaced but I assure you, each are placed accurately, using candles and then the Line is used.
The Fibs are accuratly placed.
Local Fib extension ATH Fib number
2013 November - 5.272
2017 December - 4.236
2021 November - 2
2025 Current just above 2.618
Global Fib extension ATH number
NOTE- See on chart how ATH is just above this Fib level, except for Fib 1.
2013 November - 1
2017 December- 1.414
2021 November - 1.618
2025 Current Fib just below 1,758 - if we follow trend, I expect ATH to be using this 1.768 line, the next in sequence of Fib numbers.
Local Fib charts
2011 low to 2013 ATH
2015 low to 2017 ATH
2019 low to 2021 ATH
2023 low to current position
To me, there are a number of things to see here.
More than anything, what is plain to see is how Bitcoin has used the Global Fib numbers like stepping Stones. Currently just below the 1.768, which is the next in sequence. ( Yellow lines )
All but the First ATH were recorded just above the Global Fib lines ( the First was on the line ) and I have little doubt we will do this again.
And if we look at the pattern of the Local Fib lines, we can see that we missed the 3.236 line in 2021
We went from 5 to 4 to 2. ( ignoring the 236 bit for now.)
We missed 3
See how the first 2 Local Fibs dropped by nearly one complete Fib number, from 5.272 to 4.236
By the time we headed towards the 2021 ATH, the market accelerated hugely, mostly due to the idea of Get Rich quick and no tax rules..GREED WAS UPMOST.
Even at the time, I considered this cycle Abnormal. Many charts show why, and I will not expand further here.
The Local Fib level for that run was distorted by the swift recovery from the low in 2019.
While this was not a bad thing, it changed the cycle dynamics.
This cycle, currently, we have returned to a more sensible approach and we appear to be heading to the 3 local Fib zone, maybe as we should have done in 2021.
This also happens to be just above the 1.768 Global Fib line, The next expected Global ATH line.
So, we are currently approaching that 1.7668 Global Fib line and we can expect the ATH to be above this, if we follow the previous 2 ATH.
And if we go above that Global line the same as we have in the last 2 previous cycles, we find the Local 3 Fib extension.
IF we were to follow previous, this could be expected ro be the 3.236, at around 190K
I think this is doubtful and maybe the 3 itself is more realistic at 155K
So, there you have it.
Bitcoin and its Fibs have a pattern, it get broken and it looks like it is trying to regain that pattern.
And this is all done by Humans trading........
Astounding.
and that 2 Global Fin line in 2029 ? Will we get there ?
Given the introductions of ETF and Corprate Long term holders....Will we see a bear market before we rech that 2 Global Fib ?
So many questions...
One real answer is BUY BITCOIN AND HOLD ON TO IT
Bitcoin Daily shows us that a HUGE Hurdle has been crossed
The question I will answer in this post is "What is the significance of that Blue line that BTC PA is now sitting on"
On the Daily chart, we can see it has been tested as support and Held.
Previously, it was resistance..
So what ? This has happened many times before.
Lets zoom out and look at the weekly.
So, we see that the Blue line was also the rejection zone in 2021.
Infact, if you look, it has rejected BTC PA 5 times since March 2021 and we have finaly managed to get over it and seem to be comfortable using ot as support now.
This leaves the door open to move higher once PA is ready
But there is WAY MORE to this
Lets look at the monthly chart
So now we see that that same Blue Arc has also been rejecting BTC PA since 2011.
That is nearly the entire life span of Bitcoin and it is certainly the entire life span of its current Bullish momentum since we entered the current channel we are in..
So, in many way, this could be seen as a new beginning, a New cycle.
We do need to remain cautious for now though. As we can see, we did get over this line in 2013 but fell back below......and of course, the possibility for this to happen again exists BUT we now have massive Corporate investment. This could stop that fall.
PA needed to get over this line or fall.
Should this fail to hold for now, we will return to lower lines of support, around 70K- 80K but I would anticipate a massive buying spree should that happen.
The next few months in Bitcoin are absolutely CRUCIAL.
We need to remain above this Arc.
And as I have shown months ago, this Arc is not just a line drawn freehand.
It is actually calculated and is part of a Fibonacci Arc.
The Monthly chart also shows us we are near the ATH Zone on a time span shown under PA on this chart.
We may not see the steep rise we have previously...but the Major Victory is remaining ABOVE this Blue Arc
Fingers Crossed

What if I show you Bitcoin is at end of 1st cycle only ?
The Chart above involves TWO things we may need to pay attention to.
There is so much involved in this and I could go on for hours because, for me, this opens the door to so many things for Bitcoin.
And I am now looking at this past 14 years as the "Beginnings".
And we need to wait and see Where we go next before we label that
So..
What do we have here.
The ARC of Resistance. - I have talked about this before. Simply put, PA on every ATH since 2011 has been rejected by the same line / Arc - This needs no more than the Arc on a chart to see...
It is as simple as that.
Beneath this, we have that Dashed line of Support that has Never been Broken. Created off a High in 2011, it got retested as support in 2015 and not again until 2023.
Between these two points, you will notice how that Arc of resistance was at its furthest points from the line of support below.
It is like the Beginning and End of a sequence.......
The next thing we have is a Very interesting thing called the Trend-Based FIB Time.
It is important to understand what this is, So ;-
Trend-Based Fib Time is a technical analysis tool that uses the Fibonacci sequence to predict probable price corrections within an existing trend. It is represented by vertical lines at specific time intervals that show potential areas where a swing high, low, or reversal could occur. These intervals are based on the Fibonacci sequence and are not concerned with price levels but rather with time. The tool helps traders identify how far a wave is likely to travel in the trend.
Note what is in Bold there.
And then look at the chart..It clearly shows us, where PA touched that line of support twice, the Cycle / Wave. The RED zones. And between these was the Trend. The over all Gain in price, over Time.
We have 3 Waves in total. The 3 ATH to ATH from 2017 to now
To further support this idea, see how PA did not come down to the Line of support between the 2017 - > 2021 ATH's
That was MID CYCLE - Strength
And so now, while we all wait for the next push up, I want to show you a zoomed, Daily version of this chart
The Current ATH we have was absolutely on the day of the END of this Fib Time cycle.
I promise you I did not "Adjust this to suit." That was the genuine result.
And I was Stunned.
And more than that, This image also very clearly shows us that Time and Room is running out for PA.
It faces the strongest lines of Support and resistance it has ever faced and these lines reach an apex in Dec.....
PA ALWAYS REACTS BEFORE THE APEX
So, What is Next ?
The chances of Bitcoin crashing to the Floor are highly unlikely unless all the corporations that have been buying BTC, decide to sell them all at the same time.
This IS a possibility ONLY if they are working with the TradFi banking organisations, that tried to Crash BTC in 2022 / 2023
OK OK, that involves ridiculous amounts of Losses for many ..so..NO
BUT PA IS GETTING SQUEEZED
And so we wait....and Wait till we see Bitcoin PA break out, Enter a Brand New Trend..a Long Term Cycle.....and we may call it Adulthood.....
Or, we will have a Story to tell our Grandchildren about a Dream of breaking Free of Banking that Came Oh so Close
I cannot wait to see what happens Next - and I am HODL

BTC | AIM 32K! So, imagine you're a sniper, carefully eyeing your target through your scope. Suddenly, you notice something strange - the movements of your target seem to be following a pattern! You take a closer look and realize it's the Fibonacci sequence!
As any savvy sniper knows, Fibonacci retracements can be a handy tool in trading. So you whip out your Fibonacci tool (which, for the record, looks a lot like a ruler with some fancy numbers on it), and start drawing your lines.
You carefully calculate your entry and exit points, making sure to account for all the Fibonacci levels. And then, just as you're about to pull the trigger (on your trade, of course), your target moves - just like the sequence predicted!
You adjust your aim slightly, recalculating your Fibonacci levels on the fly. And then, with a steady hand and a calm mind, you take the shot.
The market reacts with a satisfying ka-ching, and you walk away with a tidy profit. As you pack up your gear and head off into the sunset, you can't help but think: "Sniping is all about precision and timing - just like trading with Fibonacci retracements!

BTCUSD : Jouer encore une fois le rebond du Bitcoin ? XBTUSDSi cassure de la tendance je tente un rachat sur les Fibonnaci pour jouer le rebond
Target 1 Buy 9700-9800
Target 2 Buy 8500-8600
Pas de short du ponzi en attendant
Compte Amateur


Bitcoin Encapsulation Fib Circle 15 APR UpdateAs the title says...
BTC is currently encapsulated in a Fib Circle.
I expect to move around the Turquoise & Blue Circle for a while.
Breaking 9000 and staying there would be a good bull run confirmation for me.
We shall see how it develops.
For now... it will bounce between those circles.

#BTC bitcoin - hopeful journey to 13K+BTC in an ascending channel and is getting a lot more volume. Once we reach next level on the FIB it will be a good indication of things to come.
I expect to be in the 11.7k to 13.1k range in the month of March.
