BITCOIN - Time to buyBITCOIN (BTC/USD) has recently been stuck inside a triangle channel pattern and has struggled to break out for a few weeks. However, the price has recently broken a strong resistance level (the white trend line shown on the chart) - The price is currently above the trend line which acted as a strong resistance level and is now very likely to hit the next resistance zone which is labeled as the take profit level. Time to buy bitcoin!
Bitcoinidea

BTC End-of-Week Pullback Potential Here's My Trade PlanBitcoin BTC has been bullish this week, pushing higher as momentum continues to favour the upside. 🚀📈 But as we approach the end of the week, we need to be cautious because BTC is now trading directly into a key resistance zone. This is normally where trends start to slow down, weaken, or even pull back. 😮💨
Just like with any strong move, a bullish trend doesn’t mean endless continuation. Institutions and major players often begin reducing exposure toward the end of the week, which can trigger retracements or consolidation. So the big question becomes: do you really want to chase longs right as BTC is hitting major resistance and the weekly trend is reaching potential exhaustion? ⚠️
Looking at the structure, Bitcoin has climbed into a level where we’ve seen previous selling and heavy order activity. This makes the current area a strong resistance zone, and personally, it’s not somewhere I’d want to be looking for new long positions.
If anything, heading into Thursday and Friday, we could see Bitcoin pull back from this resistance as buyers take profit and institutions rebalance their positions before the weekly close. 🕒🔄
Be patient, stay aware of the levels, and let price tell you the story.
Not financial advice.

Bitcoin Weakness Unfolding – Kijun Break Confirms Bear Bias🚨 BITCOIN (BTC/USD) BEARISH PROFIT PATHWAY 🚨
Hey Traders! 👋 A compelling bearish setup is unfolding on PURPLETRADING:BTCUSD. This swing trade plan leverages a classic Ichimoku signal with a sophisticated entry method for optimal risk distribution.
📉 THE BEARISH THESIS:
The bearish momentum is confirmed by a decisive breakout BELOW the Kijun Sen (Baseline). This indicates a significant shift in medium-term momentum, favoring the sellers.
🎯 MY TRADING PLAN:
Direction: BEARISH 🐻
Style: Swing Trade
Strategy: "The Thief" Layer Entry
⚡ ENTRY STRATEGY (The "Thief" Layer Method):
Instead of one risky entry, we use multiple sell limit orders at key resistance levels. This averages our entry price and builds a position as price moves in our anticipated direction.
Proposed Sell Limit Layers:
Layer 1: 96,000.00 🟥
Layer 2: 94,000.00 🟧
Layer 3: 92,000.00 🟨
Layer 4: 90,000.00 🟩
You can adjust the number of layers and prices based on your capital & risk appetite.
🛑 RISK MANAGEMENT (STOP LOSS):
A safety stop loss is placed above a key resistance zone at 98,000.00.
⚠️ IMPORTANT NOTE: This is MY plan. You MUST adjust your stop loss based on your personal risk tolerance and strategy. Protect your capital!
🎯 PROFIT TARGET (TAKE PROFIT):
Our primary target is 82,000.00, where we expect a confluence of:
Strong Support from the Triangular Moving Average (TriMA).
Oversold Conditions on lower timeframes.
A potential bull trap being sprung.
💡 SMART EXIT TIP: Consider taking partial profits on the way down. You are NOT obligated to hold until the final target. Secure profits according to your own plan!
🔍 RELATED ASSETS & KEY CORRELATIONS:
Watching these related markets can provide confirmation and strengthen the thesis:
TVC:DXY (U.S. Dollar Index): 🟢 A stronger DXY often puts downward pressure on Bitcoin. Watch for bullish momentum in the dollar as a tailwind for this bearish BTC setup.
BITSTAMP:ETHUSD (Ethereum): Crypto majors often move in tandem. If Ethereum shows similar weakness and breaks key supports, it confirms a broader crypto market pullback.
^SPX (S&P 500 Index): In recent years, BTC has shown correlation with risk-on assets. A declining stock market could accelerate the sell-off in Bitcoin.
AMEX:GBTC (Grayscale Bitcoin Trust): Monitor for significant discounts or premiums to NAV, as it can reflect institutional sentiment.
✅ LIKE & FOLLOW if you find this analysis helpful! It helps the algorithm and keeps you updated on my latest market insights. ✅
📣 Let me know your thoughts in the comments! Are you bullish or bearish on Bitcoin here? 👇

Bitcoin Momentum Building — Bullish Plan Activated!BTC/USDT — “BITCOIN VS TETHER”
Crypto Market Opportunity Blueprint (DAY / SWING Trade) 💹✨
🔥 Plan: Bullish plan confirmed
The structure is supported by a Hull Moving Average (HMA) pullback, behaving like a clean re-accumulation phase — showing buyers quietly loading before the next expansion wave.
This pattern typically appears before trend continuation legs, especially when volatility compresses after a strong impulse.
🎯 Entry
📌 YOU CAN ENTRY AT ANY PRICE LEVEL
(Structure shows strength across multiple levels with buyers defending dips.)
🛡️ Stop Loss
⚠️ This is thief SL @ 86000
Dear Ladies & Gentleman (Thief OG's), adjust your SL based on your own strategy & personal risk tolerance.
🔍 Important:
I am not recommending to use only my SL.
It's your own choice — you can make money then take money based on your own risk.
🎯 Target
Price is moving into a zone where the moving averages act as a strong resistance, combined with overbought conditions and potential trap formation, so escaping with profits is wise.
📌 Our target @ 98000
Again — Dear Ladies & Gentleman (Thief OG's):
I am not recommending to set only my TP.
You can make money then take money at your own risk.
📡 Related Pairs to Watch (Correlations & Key Behaviors)
Below are correlated assets that help confirm BTC/USDT’s flow, momentum, and broader crypto market direction. These are presented in $ format for TradingView tagging.
1️⃣ BINANCE:ETHUSDT (Ethereum)
Strongest beta-pair to Bitcoin.
When BTC shows re-accumulation, ETH often leads the breakout earlier.
If ETH breaks major resistance first → increases confidence in BTC continuation.
2️⃣ BINANCE:SOLUSDT (Solana)
High-momentum asset; reacts faster than BTC.
If SOL pumps aggressively while BTC consolidates → indicates risk-on sentiment across crypto.
Good for measuring market confidence.
3️⃣ BINANCE:BNBUSDT (BNB)
Acts as a market stability indicator.
If BNB stays firm above key moving averages, liquidity remains strong across the crypto market.
Helps confirm medium-term bullish structure.
4️⃣ BINANCE:ETHBTC (Ethereum / Bitcoin Ratio)
A critical relative-strength indicator.
If ETHBTC drops → capital rotates into BTC dominance, supporting your Bitcoin bullish plan.
If ETHBTC rises → broad alts strength, but BTC may not accelerate instantly.
5️⃣ CRYPTOCAP:TOTAL2 (Altcoin Market Cap)
When TOTAL2 rises with BTC → marketwide confidence.
When TOTAL2 stagnates but BTC rises → BTC-only rally (typical before big breakouts).
Useful to detect inflow distribution.
6️⃣ TVC:DXY (US Dollar Index)
Inverse correlation with Bitcoin.
If DXY weakens → supports BTC bullish continuation.
Important for swing traders taking multi-day positions.
7️⃣ CRYPTOCAP:USDT.D (Tether Dominance)
When USDT.D drops → money flowing from stablecoins into crypto.
When USDT.D rises → risk aversion.
Perfect tool for confirming if BTC demand is real.
📈 Summary Insight
Together, BTC’s HMA pullback + re-accumulation structure, rising momentum across correlated pairs, and declining defensive indicators build a high-probability bullish continuation environment for the next expansion wave.

BTC/USDT Weekly AnalysisBitcoin is currently in a corrective phase after a strong weekly sell-off.
Price has a clear Weekly Fair Value Gap (FVG) sitting around the previous weekly high in the 95k–97.5k area.
📌 Technical idea:
Price could retrace back into the weekly FVG to rebalance inefficiency and grab liquidity above the previous weekly high.
After tapping that zone, a bearish reaction is expected.
Final target is the previous weekly low, where major liquidity rests.
📍 Key levels:
Weekly FVG zone: 95,000–97,500
Liquidity grab above previous weekly high
Target: previous weekly low around ~75,000
🎯 Bias: Bearish after mitigation

Will Bitcoin Price Under $95,000 Benefit From $2 Billion BuyingBitcoin is trading at $92,047, holding above the critical $91,521 support level while remaining trapped under the month-long downtrend. Recovering from this position requires a decisive breakout, which has yet to materialize despite recent attempts.
Invalidating the downtrend demands a flip of $95,000 into support. Given the ongoing accumulation and tightening exchange supply, such a move remains possible. Additional support from institutional buyers would further strengthen Bitcoin’s path toward $100,000, restoring bullish momentum.
If large holders remain sidelined, Bitcoin may continue to struggle. A failure to sustain support could send BTC back below $89,800 and toward $86,822. This would reinforcing bearish sentiment and delaying recovery attempts.

BTC/USD (Bitcoin) LONG SET UPEntry Price 1: $89,500
Entry Price 2: $85,500
Stop Loss: $79,500
Take Profit 1: $94,500(Close 25%)
Take Profit 2: $99,500 (Close 50%)
Take Profit 3: $105,500 (Close 75%)
Take Profit 4: $110,500 (Close 100%)
Status: ACTIVE

BitcoinBTCUSD
- Completed " 12345 " Impulsive Waves
- RSI - Divergence
- Change of Characteristics
- Fair Value Gap
- Order Block

BTC is Bearish 81400 Head & Shoulders Pattern Good morning
As you can see easy to spot head and shoulders pattern for this Bearish move for BTC with a target of $81,400 range and yes we can go lower however in this trade this is currently the target.
Any questions or struggling with understand on how to trade BTC let us know more than happy to help
Mindbloome Exchange/ Kris

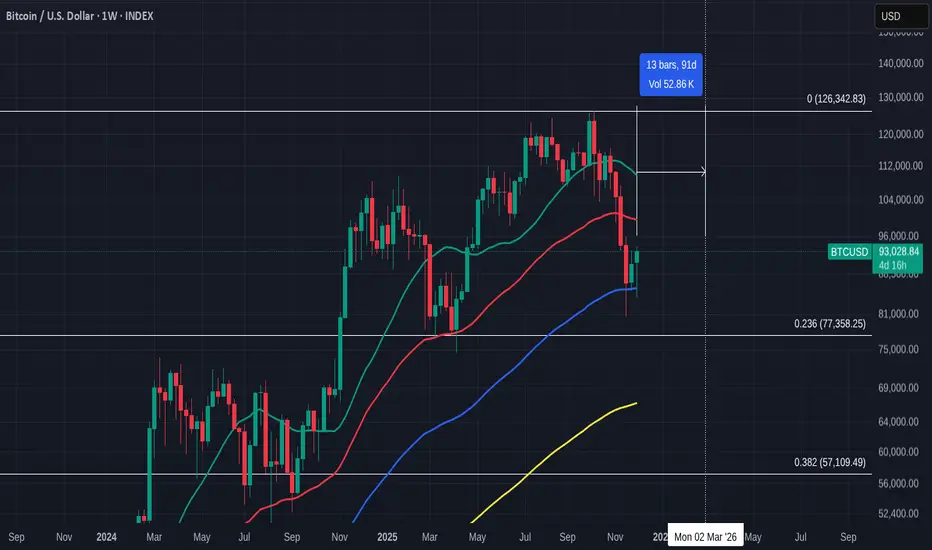
It Looks like Bitcoin is repeating the 2021 ATH Moves and SMA 50 Week SMA ( RED )
100 Week SMA ( BLUE )
In the Chart above, take Note of the Drop in PA after the first ATH and how PA bounced off the 50 week SMA ( RED ), Bounced up to a New ATH and then Dropped back, fell through the 50 and is currently Bouncing off the 100 Week SMA ( BLUE )
Also notice the 91 day count, which takes us to March 2026
Also note how all this has happened between the 0 and 0.236 Fib retracement lines.
Now lets look at what happened in 2021
The Drop in PA after the first ATH and how PA bounced off the 50 SMA area , Bounced up to a New ATH and then Dropped back, fell through the 50 and Bounced off the 100 SMA
Almost EXACTLY what we are currently Seeing.
That bounce, that we maybe currently recreating, lasted 91 days before it fell through and into the Bear market.
Notice how PA got rejected by the 21 SMA ( GREEN ) before it fell through the 236 Fib line
For me, that Bear Market began as soon as PA fell through the 236 Fib line.
Should we recreate that 2021 sequence, it may look something like this
We currently have not yet returned to the 236 Fib Line as we did in 2021.This gives us a little more Room to move thankfully.
But we should certainly keep an eye on that 21 Week SMA.
Bells will Ring when the 21 crosses under the 50
This may get invalidated if PA rises and remains above the Jan 2025 ATH at around 108K usdt
We Wait, Time will tell
Bitcoin's Next Move: What 4 Timeframes Reveal Right NowWeekly
A sustained move through the key resistance on this timeframe at105,000 to 110,000, could confirm a reversal. For now, the weekly outlook shows a potential market in correction rather than reversal.
Daily
After dropping nearly 5% yesterday, Bitcoin has rebounded sharply today with a gain of about 6.7%. The price is currently up $5775 at $92,060. Today’s low at $86,190 followed yesterday’s deeper dip to $83,814. The daily chart may suggest further upside potential.
4H
Momentum on RSI has turned higher on the 4-hour chart, lifting from oversold conditions and breaking back above the midline. This suggests improving intraday demand and provides a base for further upside if price continues to hold above the recent breakout level. The next resistance sits around 96,500, the prior swing high on this timeframe.
1H
The hourly timeframe shows the price bouncing back above the 50, 100 and 200-hour moving averages, which are currently clustered around $87,500 and $89,320. If the price stays above these converged moving averages, it can signal continued buying pressure in the near term.

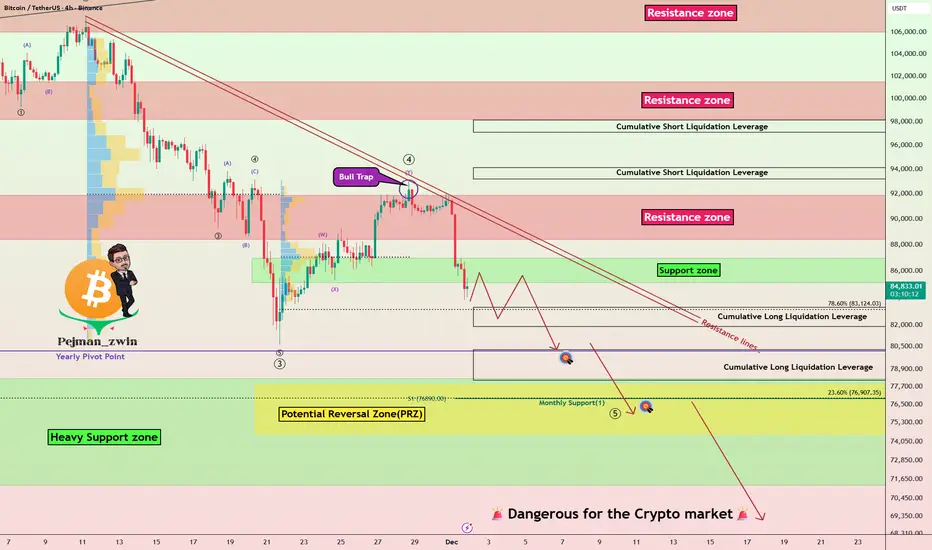
Bitcoin’s Worst November Ever — More Dump?In the past 24 hours, Bitcoin( BINANCE:BTCUSDT ) has dropped by more than -8%, marking its worst November performance ever, with a decline of about -17.67% this month alone.
Now, the question is whether Bitcoin will continue its downward trend or start to rebound. So, stay tuned!
At the moment, it seems that Bitcoin has successfully broken through the support zone($87,000-$85,130) and is moving toward the Cumulative Long Liquidation Leverage($83,273-$81,900).
From an Elliott Wave perspective, it appears that Bitcoin has completed its main wave 4, forming a bull trap, and is now in the process of completing the main wave 5.
On the fundamental side, we need to pay attention to a few key factors:
1-For one, the USDT.D% ( CRYPTOCAP:USDT.D ) is on the rise, and this could put downward pressure on the crypto market.
2-Another point is that the stock market is also trending upward, but unlike stocks, Bitcoin tends to react more negatively when the stock market declines.
3-The US 10-Year Government Bond Yield ( TVC:US10 ) also appears to be trending upward, causing riskier assets like stocks and Bitcoin to decline.
4-Additionally, geopolitical tensions, especially between the US and Venezuela over the past 72 hours, could also trigger further declines in Bitcoin if they escalate.
Considering all of this, I expect Bitcoin to continue its downward trend and test the heavy support zone($78,300-$71,280). The Potential Reversal Zone(PRZ) might serve as a rebound point for Bitcoin, but if the heavy support zone($78,300-$71,280) is broken, we could see a more severe sell-off in the crypto markets.
What do you think? Will Bitcoin drop below $70,000 or not? Let me know your thoughts!
Cumulative Short Liquidation Leverage: $97,100-$98,135
Cumulative Short Liquidation Leverage: $93,215-$94,130
Cumulative Long Liquidation Leverage: $80,263-$78,131
First Target: Cumulative Long Liquidation Leverage: $80,263-$78,131
Second Target: Potential Reversal Zone(PRZ)
Stop Loss(SL): $90,423
Points may shift as the market evolves
💡 Please respect each other's opinions and express agreement or disagreement politely.
📌Bitcoin Analysis (BTCUSDT), 4-hour time frame.
🛑 Always set a Stop Loss(SL) for every position you open.
✅ This is just my idea; I’d love to see your thoughts too!
🔥 If you find it helpful, please BOOST this post and share it with your friends.
BTC/USDT Analysis. Reaching a Key Support Zone
Hello everyone! CryptoRobotics trader-analyst here, and this is your daily market update.
Yesterday, as expected, Bitcoin continued its decline and reached the next major support zone. Upon touching the upper boundary of this area, we immediately saw a moderate bounce.
At the moment, the market is moving within a corrective upward phase. However, buying pressure remains weak: throughout the entire upward move, cumulative delta has continued to fall, indicating the absence of strong market demand.
Our primary expectation now is a retest of the support zone and a potential liquidity grab below. This scenario is most likely to play out either through a retest of the ~$88,000 area — where the strongest sell-bar volume is concentrated — or after testing the higher resistance zone. In these regions, we watch for delta and volume deviations to look for a speculative short setup.
Buy Zones
$84,000–$82,000 (volume anomalies)
Sell Zones
$89,800–$90,800 (cluster anomalies, mirror zone)
$94,000–$97,500 (volume zone)
$101,000–$104,000 (accumulated volumes)
$105,800–$106,600 (local resistance)
This publication is not financial advice .

Bitcoin - The only 100% probability setup!🔪Bitcoin ( CRYPTO:BTCUSD ) will drop -40% very soon:
🔎Analysis summary:
If we just take a look at previous cycles, Bitcoin is already starting a major -40% correction. If we then also take market structure and price action into account, this becomes a 100% probability setup. The next clear crypto bearmarket is starting right now.
📝Levels to watch:
$100,000
SwingTraderPhil
SwingTrading.Simplified. | Investing.Simplified. | #LONGTERMVISION

BITCOIN GET READY FOR MASSIVE HIGH PROBABILITY BULL MOVE SOON!!!🚨 BITCOIN HIGH PROBABILITY BUY SETUP 🚨
* Here We Can See Clearly The Next Potential Moves For BTCUSD Coming Hours/Days.
* Keep Your Eyes Close On Your Trading Positions.
* Happy PIP Hunting Traders.
FXKILLA.

Wave 4 Trap Complete as Bitcoin Prepares for Final Flush6 Days Ago:
3 Days Ago:
1 December 2025
BTC moved into the expected corrective zone last week but stayed inside the falling channel, showing that wave 4 was only a temporary bounce. Buyers failed to break any key resistance, and momentum kept fading. This kept the broader outlook bearish and hinted that wave 5 was still pending.
BTC has now broken below the short-term rising structure, confirming that wave 4 topped out near the 0.786 retracement. The rejection from that zone triggered a clean shift back into the main downtrend, with price sliding toward the key 86,280 support. As long as BTC holds below the upper channel boundary, the market remains positioned for further downside, with the 1.618 extension around 79,650 emerging as the next probable target for wave 5 completion.
Note:
The rejection from the 0.786–resistance zone shows buyers failed to take control.
Wave B at 86,280 is the immediate pivot level; staying below it keeps downside pressure intact.
The next major target for wave 5 sits near the 1.618 extension around 79,650.

BTC 1H – Bearish Retracement Before Potential ContinuationBTC is currently pulling back after rejecting the upper volatility band, forming a clear lower high on the 1H timeframe. Price is trading back under the EMA ribbon, signaling a short-term bearish retracement within the broader bullish structure. This cooldown is healthy and expected after the recent impulsive move up.
Downside targets are aligned with the Fibonacci retracement levels:
🔻 TP1 – 38.2% Fib: ~$89,766
🔻 TP2 – 61.8% Fib: ~$88,923
🔻 TP3 – 100% Fib: ~$87,658
As long as BTC holds above the deeper Fib zones and maintains higher-timeframe structure, this move is likely just a corrective dip before buyers step back in. Once the retracement completes, a continuation to the upside remains the more probable scenario.

BTCUSDT - What's Next? Bullish is over???BTC Daily & 4H Outlook
Bitcoin is showing mixed signals across the 1D and 4H timeframes. On the daily chart, BTC failed to hold the strong support zone and has now officially flipped it into a resistance. The drop also swept liquidity down to the 80.600 area before rebounding from the daily OB, which gives us a temporary relief bounce. Right now, price is pushing upward and may retest the resistance/supply zone above.
If BTC rejects strongly from that resistance, the market could be in trouble again because the downside target reopens toward the 83k–86k region. This area becomes even more important when we look at the 4H chart, where we still have a key support between 85.650–85.000. This zone must hold—if it breaks, then 83k becomes likely, and a worst-case scenario returns us to the 80k sweep zone.
For BTC to reclaim momentum and shift into a bullish structure, the market needs to break out above the major supply at 93.240. A clean breakout and confirmation would show strength and could trigger the next leg toward 98k–100k. If that happens, we may also see a strong positive impact on altcoins.

BTCUSDT (bitcoin) toward $91k?Hi!
BTC has finally broken its major descending trendline, signaling a shift in market sentiment after a long period of selling pressure. Following that break, price formed a clear inverse head and shoulders pattern, showing that buyers stepped in aggressively after the final liquidity sweep at the Head. Since then, BTC has been moving inside a well-defined ascending channel, consistently printing higher highs and higher lows, which confirms bullish momentum.
As long as price respects the lower boundary of this channel, the upside structure remains intact. The next significant resistance sits at 92,500–93,000, which also aligns with the previous breakdown zone you highlighted. This area is likely to attract sellers, making it a logical target for the current move.
Overall, the chart supports continued upside toward 93K, unless price breaks below channel support, which would weaken the bullish reversal setup.


mrmoney limited BITCOIN trading ideabitcoin is in a strong bullish momentum since it tapped into our monthly demand zone giving us a overall bullish moves

Bitcoin and the US PresidentsDemocrats and Obama:
177,202,485.71%
GOP and trump 1.0:
5,192.94%
Let the plebs and paid influencers talk their way, but facts will be facts, always.
Why he wants to deregulate crypto now, we might only speculate. But Ross William Ulbricht is free, pardoned by Trump.
If the trust in cryptocurrencies is compromised, expect a deep ABC correction. ;)
It is not a political post, nor is intended to be interpreted like one. It is just market observing one.
Be safe. Protect Your money.
Cheers

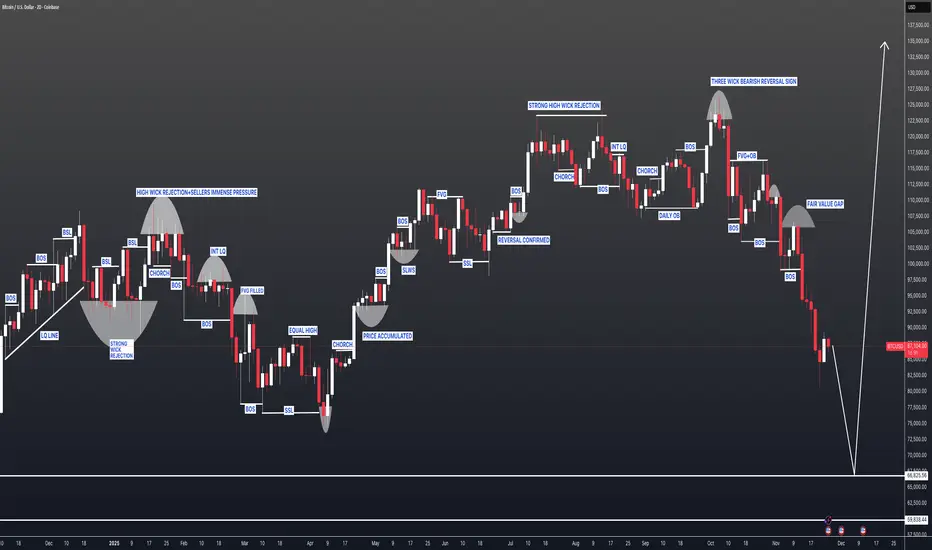
BITCOIN(BTCUSDT): First Setup Dropped From $107k To $80K, Next? Dear Traders,
Bitcoin has fallen from our selling point as described in our previous trading setup on BTCUSDT. The price has dropped significantly from $107k to $80k.
We anticipate a further decline to approximately $66k to $57k. This area appears to be a discounted price point where a large number of buyers are likely to be present. Once the price reaches our entry point marked by two white lines, we believe it will follow a strong bullish impulse. This will likely take the price from $60k to $140k.
We wish you the best of luck and trade safely.
Team Setupsfx