BTCUSDT(BITCOIN): Bitcoin is bearish for now at least! Bitcoin is in distribution phase if we using the smart money concept, that is why we think price is at the final point before it drop faster. There will be mixed views regarding the bitcoin, but this is our personal view and which is more likely view compare to buying. Please use accurate risk management while trading bitcoin. This setup may take time to get it completed, and we will keep you guys updated.
Good luck and trade safe!
Team Setupsfx_
Bitcoinidea

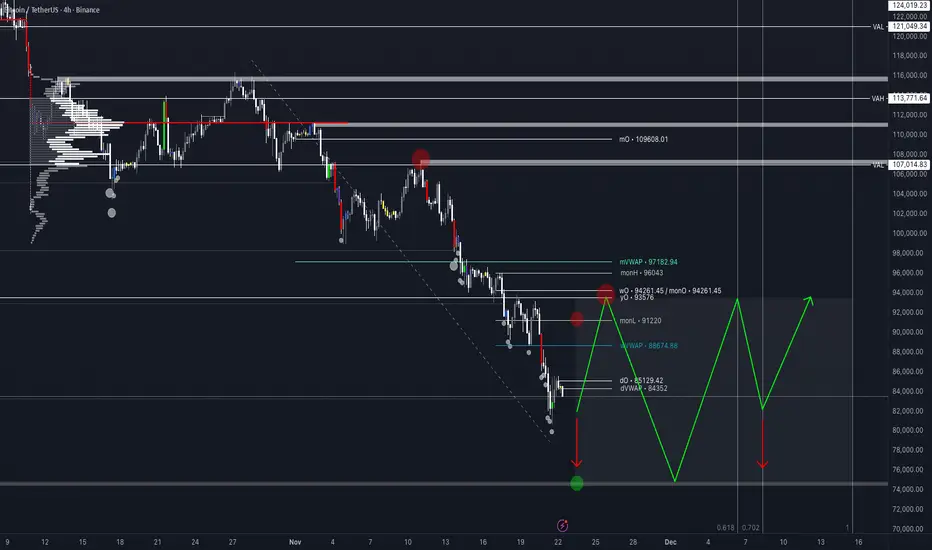
BTC to 100,000$CRYPTOCAP:BTC – Elliott Wave Roadmap (4H Chart)
Still tracking a higher-degree Wave 4 completion before the macro trend resumes upward. Structure is behaving exactly as a textbook corrective.
🧩 What the chart shows:
🔻 Wave (1) & (2) already completed
• Strong impulsive (1)
• Shallow corrective (2) inside the channel
🔻 Wave (3) extended:
• Deep, high-momentum decline
• Clean sub-waves inside the downward channel
🔵 Wave (4) bounce currently unfolding:
• Reaction up from the (3) low
• Expected to remain below channel resistance
• Most likely forming a zigzag or flat before final drop
🔻 Wave (5) down still pending:
• Should take price into the C/4 completion zone
• Likely near the lower channel + horizontal support cluster
🟢 After Wave 4 completes:
• Expect a major trend reversal up
• First target = break out of the channel
• Mid-term goal = region around the previous X high
📌 Summary:
BTC is preparing a Wave (4) corrective bounce → final (5) dip → major upside leg.

The Bear MarketHere’s my current view of the Bitcoin market:
The 4-year cycle still appears intact, and many who doubt it seem to be in the denial phase. While some market dynamics have changed, the overall structure is still on track. Based on prior cycles, I expect a bear-market bottom to form roughly 324–340 days from now. Until then, I plan to avoid leverage and focus on accumulating during deeper pullbacks. I view Bitcoin around $68k as fair value, with prices above that currently leaning toward overvaluation.
I also disagree with the idea that the cycle can’t be over simply because “too many people are calling the top.” As Bitcoin matures and more cycles unfold, more traders naturally recognize recurring patterns. Increased awareness doesn’t invalidate the possibility that the top is already in.
Comparing this cycle to 2021 is also misleading. The previous double-top was heavily influenced by the pandemic, unprecedented Federal Reserve intervention, stimulus payments, and the surge of retail traders stuck at home. Those conditions don’t exist today. This cycle has been driven instead by regulatory clarity, institutional involvement, and growing governmental trust—resulting in a healthier, more sustainable rally.
Despite extreme fear in the market and widespread pessimism, I believe we still have downside ahead due to broader economic fragility. My current expectation is for a market bottom around October 2026, followed by a renewed parabolic move into the next bull market. I don’t expect Bitcoin to reach $1 million by 2030, though it may be possible someday.
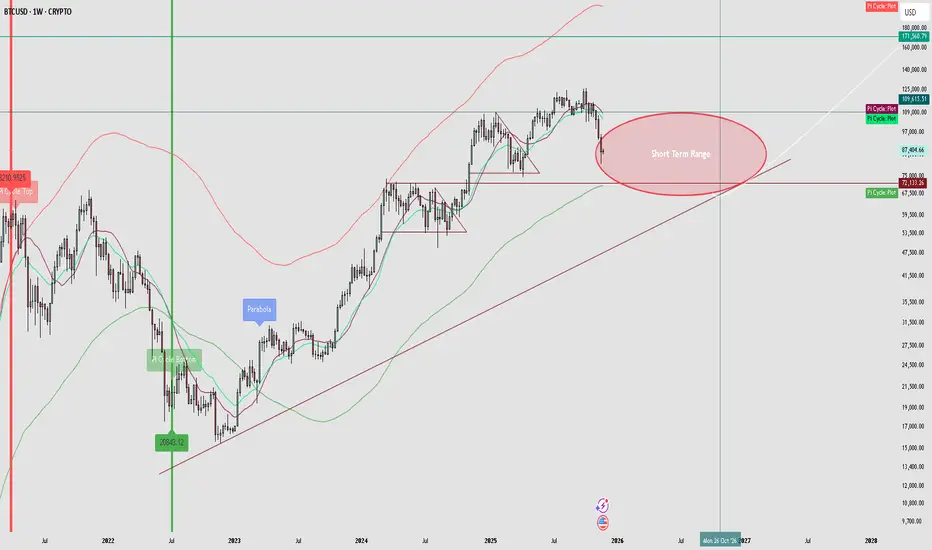
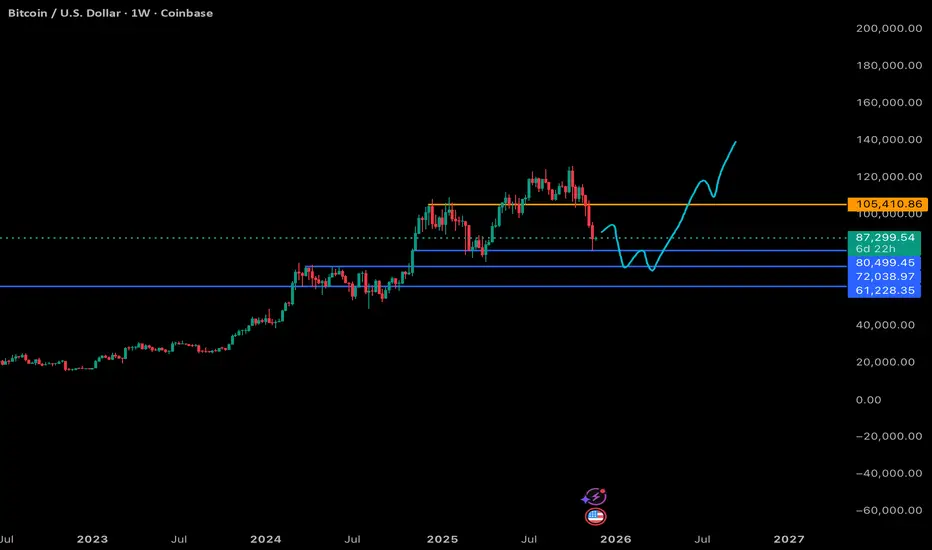
BTC 1W Breakdown: My Current Read on the Structure - Nov 23 2025Here’s the simplified version of what I’m seeing (and expecting) on this weekly chart.
Blue zones = support
Orange zone = major resistance
Teal path = my forward outlook into next year
Support Levels (Blue)
I’ve mapped out three key support areas that I think matter most on the weekly:
$80.4K: First major support. If BTC is going to bounce early, this is where it would probably try.
$72K: The big one for me. This has historical confluence, prior consolidation, and strong demand. If we’re going to get a proper “cycle reset” type pullback, this is where I think it happens.
$61K: Deeper support. I’m not calling for this in the baseline scenario, but if things get extra sloppy or we see forced liquidations, this is absolutely on the table.
Resistance (Orange)
$105K is still the level BTC needs to reclaim to flip the macro structure back into full-on expansion mode. It was the rejection area earlier in the run, and I expect it to act as the mid-cycle ceiling until momentum rebuilds.
My Expected Path (Teal)
This teal line is basically my roadmap:
Dip into support: I’m leaning toward at least a move into the low-$70Ks.
Choppy consolidation: The usual mid-cycle grind. Weeks of sideways action, fakeouts, and probably a lot of frustration.
Reclaiming the mid-range: A slow climb back toward $100K–105K.
Breakout later next year: Once that resistance is cleared, I think BTC finally gets the strength to push into new highs and run toward the $140K–160K zone.
This is the kind of structure that shakes out weak hands, clears leverage, and resets indicators before a real expansion phase kicks in.
Overall View:
It’s not the clean, vertical moonshot scenario… but honestly, this kind of multi-month reset is exactly what fuels the next big leg. If this plays out, there’s going to be plenty of opportunity to accumulate before the breakout.
This is a long-game weekly view: slow, messy, but ultimately bullish.
BTCUSD – 1H Short Setup BITSTAMP:BTCUSD has pushed into a local resistance zone near 87.8k, aligning with the upper volatility band and showing early signs of exhaustion. Price is also interacting with the 38.2% retracement level, which often acts as a reversal pivot in corrective structures.
Bearish Confluences
Overextended into upper band resistance, historically a fade zone on this timeframe.
Lower-timeframe momentum slowing, with smaller-bodied candles and wicks rejecting the highs.
Fibonacci alignment at 38.2%, matching the start of prior impulsive sell-offs.
Trend ribbon overhead still angled downward, suggesting broader trend pressure remains bearish.
A rejection from the current zone may initiate a pullback toward deeper fib targets as BTC resets from its overextended push.
🎯 Fibonacci Targets
TP1 — 38.2%: ~86,587
TP2 — 61.8%: ~85,784
TP3 — 100% extension: ~84,483
SL above 87,887

[WEEKLY] ANFIBO | Bitcoin BTCUSD - Downtrend? [11.24 - 11.28]Hi traders, Anfibo’s here!
BTCUSD – Technical Outlook
Overall Picture:
Last week, BITSTAMP:BTCUSD dipped into the 80,000 USD support zone, a key area that has previously acted as a structural demand region during corrective phases. The market reacted well, showing a notable bounce—though not yet strong enough to confirm a full trend reversal. Current price action remains in a broad corrective structure, and until BTC reclaims major broken levels, we treat all upward movements as retracements within a larger correction. The next week will be crucial, with clear opportunities both for strategic dip-buying and trend-continuation selling depending on how price behaves around major zones.
Weekly Trading Plan:
>>> BUY ZONE:
ENTRY: 83,000 – 85,000
SL: 80,000
TP: 96,000 → 98,000 → 102,000
(Looking to buy the retest of the previously broken structure around 98k. This is a classic “reclaim & retest” setup if momentum continues to recover.)
>>> SELL ZONE:
ENTRY: 98,000 - 102,000 (retest of breakdown)
SL: 106,000
TP: 87,000 → 80,000 → 77,000 → 72,000 → ...
(These levels align with the deeper correction targets. I will only execute these sells if BTC shows clear rejection signals, matching the purple-arrow projection.)
Risk Management:
Keep position size moderate until BTC confirms a clear trend direction.
Prioritize setups with clean invalidation points such as the 98k retest and the 76–71k demand range.
Avoid chasing price mid-range; trade only from well-defined boundaries.
Always secure partial profits once the market moves in your favor to reduce emotional pressure.
Conclusion:
BTC is showing signs of stabilizing after the bounce from 80k, but the market remains in a broad corrective phase. The plan for the upcoming week is straightforward: look to buy corrective pullbacks into the 98k retest, while also preparing to sell deeper breakdowns toward the 76–71k zone if bearish confirmation appears. Flexibility is essential—trade the chart, not the prediction.
HAVE A POWERFUL WEEK, GUYS!

BITCOIN TRADE IDEA Waiting for btcusd to buy …will use a buy stop in order to catch the move to the upside as it’s been dropping for soo long and now needs to retest a fair amount to the upside

Bitcoin: Is the Market Reaching a Historical Turning Point?📅 Update: October 2025
💡 Format: Educational analysis — not financial advice
Historical Context
Looking back at Bitcoin’s (BTC) price history, a clear pattern emerges: roughly every four years, the market experiences a major correction following a strong bullish cycle.
Key examples include:
2011
2013–2014
2018
2022
Each time, Bitcoin saw a drawdown of –75% to –93% from its previous highs. These deep retracements have historically marked the end of a growth phase and the beginning of a new accumulation cycle.
Current Elliott Wave Structure
According to Elliott Wave analysis, Bitcoin appears to have completed its third and fourth waves, while the fifth wave is currently unfolding.
However, the recent price action suggests that this fifth wave might already be nearing its conclusion.
The price remains within an upward channel, testing the trendline for the fourth time — a technical signal that often indicates weakening bullish momentum and a potential transition to a corrective phase.
Main Scenario: Possible Trend Reversal
For a confirmed shift in trend, Bitcoin would need to break below the channel’s lower boundary.
A typical technical sequence would look like this:
A breakdown below the trendline
A retest of the broken level from below
The beginning of a stronger downward move
This process usually unfolds over months, not days — a slow structural change rather than a sudden reversal.
Potential Downside Range
Based on historical patterns, a post-peak correction could bring Bitcoin into the $40,000–$30,000 range.
This is not a forecast, but rather an educational scenario grounded in the recurring market behavior seen in previous cycles.
Conclusion and Community Discussion
📊 At this stage, Bitcoin’s overall structure remains bullish, but signs of momentum exhaustion are becoming more apparent.
The key factor to watch is how price reacts to the main trendline — whether it holds as support or gives way to a deeper retracement.
❓Which scenario do you find more likely?
Continued growth and new highs
Or a corrective phase toward lower levels?
🗨 Share your thoughts and charts in the comments — let’s discuss it together.
🔔 Follow for more educational breakdowns, and suggest which tickers you’d like to see analyzed next.

Bitcoin Toxic Flows! We need to find balance. After the violent & toxic order flow selling this week on CRYPTOCAP:BTC spot holders in pain, but as traders we have a few key levels to observe. READ PREVIOUS POST ^ for dates & timing. We have major weekly level at 75k & yOPEN 93.5k.
The cleanest outcome is to auction price with organic flows, how does the market find balance? We range. This can come from a squeeze up 1st to test the 93.5k supply or rip the band aid off & give us 75k test. From there? we simply need to observe all flows with zero bias as mercenary sharp shooting traders.
80K is well supported for now. 1.49billion aggregated. But as we have seen this week, key levels breaking one after another. Either way, I would enjoy a range here, why? it simply makes for better trading.
Have a great weekend all!
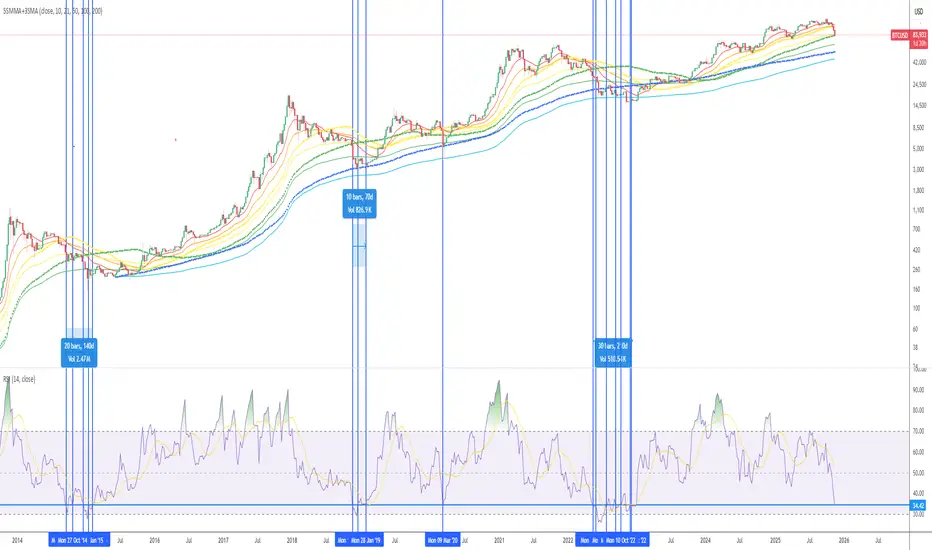
Keep it Simple. How Rare is today in Bitcoin?Lets look at how many times we have reached today's RSI levels.
Each vertical line is a point in history where Bitcoin has been at today's RSI levels.
Start of a bear market or already pretty deep in the bear market, seemingly an accumulation....
1)What
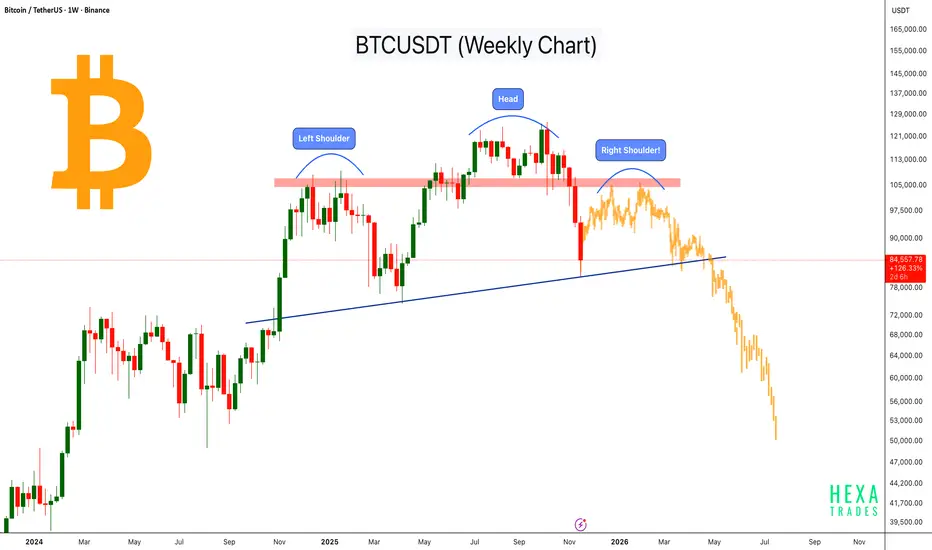
Bitcoin’s Macro H&S Structure Building Up!Bitcoin is developing a potential Head and Shoulders pattern on the weekly timeframe, a classic bearish reversal structure. The price has repeatedly rejected the major resistance zone marked in red, indicating strong selling pressure.
As of now, the left shoulder and head are already formed, and based on the current structure, the right shoulder could form within the next 1–3 months if BTC continues to face resistance near this zone $100k- $107k
Price is currently hovering near the long-term ascending trendline (neckline), which will play a key role in determining whether this pattern completes and confirms.
The yellow candles represent a forecast, illustrating a possible scenario if the right shoulder forms and the neckline breaks.
Key Highlights
- Left shoulder and head are already formed; right shoulder may form in the next 1–3 months.
- Strong rejection from major resistance, similar to classic H&S structures.
- Ascending neckline acting as final support.
- Yellow candles are only a forecast, not actual price data.
- Pattern confirmation requires a decisive break below the neckline.
This is an early-stage macro pattern, and traders should watch how BTC reacts around the resistance zone and the neckline in the coming weeks.
Cheers
Hexa
1H BTCUSD BearishBTCUSD on the 60-minute chart remains in a firm downtrend, with clear lower lows and lower highs and price trading well below the 20, 60 and 120 MAs. A recent bearish Market Structure Shift and rising ATR confirm strong downside momentum. The former support zone at 88,399–89,251 has flipped into resistance, while a higher resistance cap sits near 93,000. On the downside, short-term support is trying to form around 82,400, but it’s still unproven.
The primary path favors selling failed bounces. If price rejects higher and we see a 1H close back below 86,000, it would confirm sellers back in control, keeping a short bias toward 81,000, with invalidation above 88,500, just beyond the resistance band. A clean break beneath 82,400 would further validate the trend and increases the probability of extending the move toward 81,000 and, in a stronger flush, the 75,000 area.
Aggressive bears can also watch for a 1H close below 82,300 as a continuation trigger toward 75,000, with risk capped above 85,500. Any sustained reclaim and hold above 93,000 would invalidate this bearish view and shift the bias back to neutral, if not cautiously constructive. This is a study, not financial advice. Manage risk and invalidations.
Thought of the Day 💡: Let the trend do the heavy lifting—your job is to define risk and respect invalidation.
-----------------------
Thanks for your support!
If you found this idea helpful or learned something new, drop a like 👍 and leave a comment, I’d love to hear your thoughts!

BTC: Black Friday Crash & The Road to 74k. H&S in the making?We are seeing a true Black Friday on Bitcoin today 😵😱🤬—price is diving below 82k, and the 126k top feels like jusst history.
Looking at the 1D structure, the market is clearly aiming for a "hard reset," magnetically pulled toward the 1.0 Fibonacci level around 74,600 USDT. We’ve already smashed through key supports, including the 0.786 Fib, which usually opens up a highway for a full retracement.
In my view, this drop is setting the stage to build the Right Shoulder of a massive Head and Shoulders pattern. If t he 74k zone holds—and it’s a major technical support—I expect a demand reaction there (marked with the green arrow). The target for this relief rally would be a return to the 100k area (0.5 Fib), completing the shoulder structure before any potential further downside.
The situation is confirmed by Trading Cipher X. Money Flow is flashing thick red, signaling that big capital is still exiting the market, while the wide momentum waves at the bottom indicate heavy selling pressure. There are no reversal signals yet; the daily candles (basically bearish Marubozu) and rising bars on the cumulative volume (WWV) confirm that the bears are in total control right now.
Game Plan: I’m not catching falling knives here. I’m patiently waiting for the price to hit the "kill zone" at 74,600 USD. Only there, upon confirmation (I’m looking for a bullish divergence on TCX), will I look for a Long entry to play the bounce. On the flip side, mid-term Shorts will only become attractive if we revisit the 98k-100k zone. Keep your eyes on 74k—it’s make or break for the bulls in the coming weeks.

BTC MAJOR RALLY INCOMING!!!Get ready for the major #Bitcoin rally soon.
Buying region 83-80k targeting upto 165k.
You also know what else is going to come with it ;)

Bitcoin Downtrend UpdateAlright friends, Bitcoin has confirmed its intention to move toward 86,000 and lower.
My previous forecast with the invalidation zone at 96,600 is still valid, but I decided to make a fresh post.
At the moment, my new invalidation level is 96,012.5.
From a broader perspective, I’m still expecting Bitcoin to reach 83,000.
But as I mentioned earlier, we first need to see 86,000 tested — because once that level is hit, Bitcoin may go into a correction before continuing toward 83,000 and below.
Yes-yes, I do expect it even lower, but more on that in the upcoming updates.
Make sure to follow so you don’t miss them

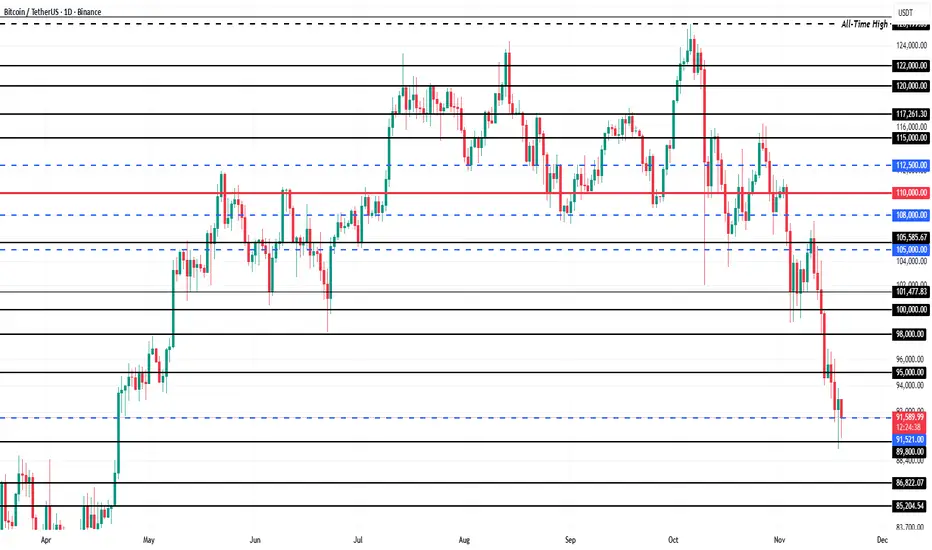
Bitcoin’s Price at $90,000 Is Signaling a Bottom Formation
Bitcoin trades at $90,331 and holds above the $89,800 support level, which has become a key buffer during the decline. The recent drop to a multi-month low has increased caution, but technical and behavioral signals suggest downside pressure is easing.
Based on investor support and historical patterns, a deeper drop appears unlikely. A bounce from $89,800 could push BTC back toward $95,000 as confidence improves. Strengthening demand and exchange outflows reinforce the possibility of a recovery in the near term.
If bullish momentum fades and broader weakness intensifies, Bitcoin could slip below $89,800 and fall toward $86,822. Such a decline would invalidate the current bullish thesis and signal a deeper retracement.
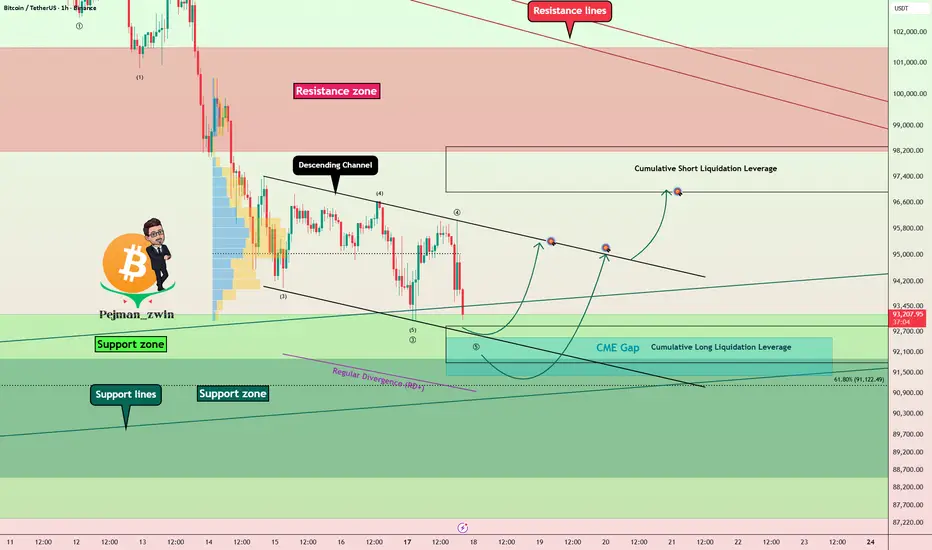
Bitcoin Roadmap: Major Support Ahead — Bounce or Breakdown?As expected in the previous idea , Bitcoin ( BINANCE:BTCUSDT ) has dropped to $93,040(Target done) .
The question now is whether Bitcoin will continue its downward trend or not.
Currently, Bitcoin is moving near the Support zone($93,200-$87,340) and key Support lines .
From the perspective of Elliott Wave Theory , Bitcoin seems to be completing Wave 5 , with the Wave 3 being extended .
I expect Bitcoin to start rising again by entering the Cumulative Short Liquidation Leverage($92,869-$91,763) and possibly from the lower line of the descending channel.
There is a possibility of a fake breakout , but be careful of the momentum of the decline.
First Target: $95,297(near the upper line of descending channel)
Second Target: $96,831
Stop Loss(SL): $90,727
Points may shift as the market evolves
Cumulative Long Liquidation Leverage: $98,338-$96,913
CME Gap: $92,525-$91,415
Note: Since Bitcoin has had a high correlation with the S&P 500( SP:SPX ) recently, and if the S&P 500 continues to decline, we can expect Bitcoin to follow suit.
Another important note is that rising tensions between the U.S. and Venezuela could also impact the crypto market, so we should keep that in mind.
Where do you think Bitcoin’s correction will go?
Please respect each other's ideas and express them politely if you agree or disagree.
Bitcoin Analysis (BTCUSDT), 1-hour time frame.
Be sure to follow the updated ideas.
Do not forget to put a Stop loss for your positions (For every position you want to open).
Please follow your strategy and updates; this is just my Idea, and I will gladly see your ideas in this post.
Please do not forget the ✅' like '✅ button 🙏😊 & Share it with your friends; thanks, and Trade safe.
BTCUSD – Summary of the Higher-Timeframe Buy ScenarioBitcoin has already printed a major Break of Structure (BOS) to the upside, establishing a long-term bullish trend. The current sell-off is a corrective leg, unwinding inefficiencies created during the prior expansion phase.
Price is now gravitating toward a key daily demand zone, which is the origin of the BOS and the zone that previously launched the strong bullish impulse. This area remains unmitigated and holds institutional order-flow significance.
If price retraces into this zone, a reaction is highly probable. The expectation is for consolidation, a shift in short-term structure, and then a new bullish leg that continues the higher-timeframe trend—targeting new highs once the market rebalances.
This setup frames the demand zone as the strategic value area for long-term buyers, aligning with structural bias and discounted pricing.

Bitcoin Can reach 93000 Bitcoin could reach the price level of $93,000 in the coming weeks.
There is a possibility that after breaking the midline of its long-term weekly channel, it may move up to the indicated FVG level to fill the remaining unfilled orders.
After that, it could start a new bullish rally aiming for the upper boundary of the channel.
This is purely an analysis and should not be considered as financial advice.
Buying or selling is at the trader’s own risk.

Bitcoin / Gold (BTC/XAU) – Monthly Chart OutlookTVC:BTCXAU is pulling back into the mid-range of the long-term consolidation that has held since 2021. Price is currently trading around 22, while spot TVC:GOLD is near $4000 and BITMEX:XBT near $90,000.
The pair recently lost the 20-month EMA, showing weakening momentum after multiple failed attempts to break the upper boundary of the range near 41. As long as BTC/XAU remains below the EMA, the risk leans toward continued mean reversion inside the horizontal structure.
The key support zone sits between 14–16, aligned with the major volume node on the right-side profile. A deeper washout toward 10–12 is still possible if sellers continue to defend the EMA and the mid-range resistance around 26.
For bulls, the structure doesn’t shift back to strength unless price reclaims the EMA and closes above 26 again. A breakout above 41 would signal a new macro expansion phase favoring Bitcoin over gold.
Until then, BTC/XAU remains range-bound, and the current rejection hints at further consolidation or downside toward the high-volume support areas.

BTC Weekly View !BTC / USD
Bitcoin (BTC) followed my previous analysis on October 30th, dropping from $110,000 to its current price of $96,000. check here
What's Next?
Take a Look at the weekly chart:
Bitcoin is currently at a "do or die" support level (trend line + 50-week moving average).
This moving average has been a turning point in previous cycles.
If the price breaks below this level, it will confirm a mid-term bear trend with minimal target around 74k so keep an eye on this chart.

Bitcoin - This chart is crumbling!⛔️Bitcoin ( CRYPTO:BTCUSD ) creates a massive top:
🔎Analysis summary:
All the previous cycles on Bitcoin have been lasting about 1,000 days. And exactly three years ago, Bitcoin retested the previous all time high, starting the next bullrun. If we soon see bearish confirmation on Bitcoin, this crypto will lead to another insane bloodbath.
📝Levels to watch:
$100,000 and $50,000
SwingTraderPhil
SwingTrading.Simplified. | Investing.Simplified. | #LONGTERMVISION

BITCOIN : First Drop Then Shoot Up To $150,000Overview🧠
Bitcoin is in a bearish trend since it reversed from our previous trading zone. We expect the price to continue declining between 60,000 and 70,000. This is a suitable time to consider buying Bitcoin. Once the trade is activated, there are three potential targets: 90,000, 120,000 and 150,000.
Please use appropriate risk management when trading Bitcoin as it is a more volatile asset.
We wish you the best of luck.
Team Setupsfx_❤️🏆
