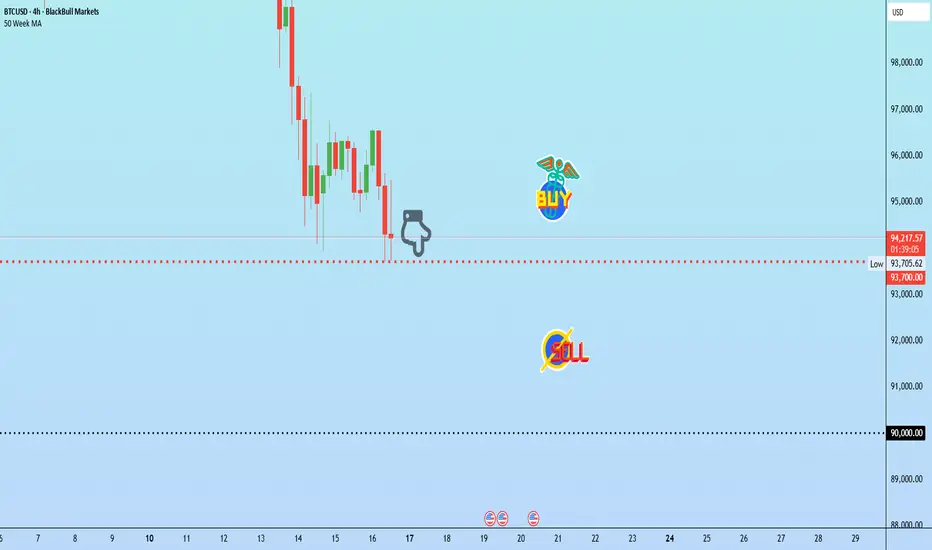
BTC needs to hold this level or risk a slide toward 90K?Bitcoin is at a crucial juncture. This week’s move could possibly prove vital for the cryptos forecast leading into Christmas.
Bitcoin has extended losses for a 4th session, now trading less than $95K. 93,700 dollars is possibly the most immediate support on the chart.
For any recovery to gain traction, price might need to reclaim 101,150 dollars and establish higher lows above it.
Perhaps the most important fundamental issue pressuring BTCUSD are the remarks from Fed officials questioning whether a December rate cut is warranted. Adding to the downside, Japan Exchange Group has apparently paused the listing of three crypto treasury firms while it reviews new compliance and disclosure rules. Japan remains the largest market in Asia for listed Bitcoin treasury firms, with fourteen companies currently holding BTC.
Bitcoinidea
BTC: Major RSI divergence - Next stop around $69K?Bitcoin is showing strong warning signals that the current bull run may be ending. On the weekly chart, we can clearly see a massive RSI bearish divergence, similar to what happened before previous cycle tops.
Today’s BTC options expiry added extra pressure, and with no quick resolution in sight for the Ukraine war, alongside worsening global economic conditions (trade wars, inflation, tightening liquidity), the macro environment does not favor sustained risk-on sentiment.
The chart highlights a likely correction path, with the next major support zone sitting around $64K–69K (previous resistance turned support). If this level breaks, further downside cannot be excluded.
For now, caution is advised – this may mark the end of the bull run and the start of a new accumulation phase.


Bitcoin Daily — Correction Gone WavyHey everyone!
The correction in Bitcoin turned out bigger than I expected — it unfolded as a clear three-wave ABC, and wave A itself was a flat ABC.
Right now, I believe the correction has come to an end, and Bitcoin is already hinting at another leg down.
🎯 My downside targets:
• Target 1 — $102,000
• Target 2 — $98,000
• Target 3 — $94,000 (I’m placing Target-3 at $94K, but I don’t rule out a drop to $92K)
❌ Invalidation Zone — $107,100
Also, just to remind — globally I’m still expecting Bitcoin to reach around $83,000.
However, after a drop toward ~$94K, there might be corrective bounce, so BTC can gain some strength before continuing lower.
⚠️ As always — don’t trade without stop-losses!
If you enjoy my daily Bitcoin outlooks and want to see more of my market vision, don’t forget to like, comment, and follow — your feedback means a lot! 💬🔥
Stay tuned for what’s next! 🚀

Bitcoin: Liquidity CycleTypical liquidity cycle is 5-6 years long (65m). Buy bitcoin before an upswing (or end of QT) and sell when liquidity tightens. Macro is the best way to analyze markets?
Adjust your stakes based on position of the cycle.
Markets can have risk-on, risk-off episodes. Where Bitcoin is a risk-on asset.
Use 10Y-02Y for guidance.

BITCOIN URGENT UPDATE! Bounce Expected This level is important!IG:BITCOIN Update:
I’ve been saying this for a while: avoid trading altcoins with high leverage in these conditions. If you got caught again, maybe it’s time to pause and rethink the strategy.
Coming back to BTC, we’re close to a 50 EMA crossing below the 200 EMA, but interestingly, these crossovers have often played out opposite to what classical TA suggests.
Right now, BTC is still getting support from the lower trendline of the falling wedge, so while the price action is choppy, it’s not completely bearish yet.
BTC needs to bounce here; otherwise, the setup becomes invalid if we close below 95,785.
DYOR | NFA
#BTC #BTCUSDT
Please hit the like button if you like it, and share your views in the comments section.
Thank you

ANFIBO | Bitcoin BTCUSD - UP or DOWN? [11.13.2025]Hi traders, Anfibo’s here!
BTCUSD – Technical Outlook
Technical Structure:
On the higher intraday frame, BTC is running an H1 uptrend — higher highs / higher lows are still intact and the structure favors the bulls. However, on the lower intraday frame (M15) price is trapped inside a short-term descending trend, creating compression between the bullish H1 bias and the bearish M15 micro-structure. That interaction is producing chop around the ~102,000 area and increases the value of waiting for a clean directional resolve (breakout + retest) before committing.
Daily Trading Strategy:
Our approach today is simple and veteran-focused: wait for the breakout of the conflicted edge and trade in the direction of the break after a proper test.
If price breaks up out of the M15 downtrend: wait for the pullback / downtest, then buy near the test level (~102,000).
If price breaks down through H1 support / the current compression: wait for the retest of that broken edge, then sell near ~102,000.
This “break → retest → trade” workflow avoids getting caught in false moves and puts probability in our favor.
Daily Trading Plan:
>>> SELL ZONE:
ENTRY: 101,500 – 102,500 (on confirmed breakdown + failed retest)
SL: 104,500 (above the immediate M15 channel / invalidation level)
TP: 96,000 (TP1) — 92,000 (TP2)
>>> BUY ZONE:
ENTRY: around 102,000 (on confirmed breakout + clean downtest)
SL: 99,500 (below the downtest low / invalidation level)
TP1: 108,000
TP2: 112,000
(Notes on entries: the same ~102k area becomes the decision point — trade only after structure confirms: for buys, look for bullish confirmation on the retest (rejection wick, bullish engulf, rising volume); for sells, look for bearish rejection on retest or inability to reclaim the edge.)
Risk Management:
Keep position sizes small-to-medium while the pair remains in a compressed range; risk 1–2% of equity per full setup.
Use stop losses as listed and never widen SL to “hope” — adjust size instead if you need a wider stop.
Prefer scaling: take a starter size at first confirmation and add only after the trade behaves in your favor (e.g., after TP1 or strong momentum continuation).
Avoid trading into major macro prints or news; if a scheduled event is imminent, reduce size or stand aside until clarity returns.
Conclusion:
Today’s market is a classic “higher-frame bias vs. lower-frame conflict” scenario. The H1 uptrend gives the structural edge to buyers, while the M15 downtrend supplies immediate supply and failure points. The correct, experienced play is to wait — only engage after a clear breakout of the micro-trend and a confirming retest around the decision area (~102k). Whether the trade becomes a buy or a sell, follow the break → retest → confirm discipline, manage risk tightly, and let price prove the direction before enlarging exposure.
GOODLUCK GUYS!!!

BTC/USDT Analysis. The scenario didn’t materialize — waiting for
Hello everyone! CryptoRobotics trader-analyst here, and this is your daily market update.
Yesterday, the expected bounce from the $104,700–$104,100 zone did not materialize. Buyers failed to regain control, and Bitcoin fell sharply toward the more significant support at $102,000–$100,000 (volume anomalies), which triggered an immediate reaction.
However, the market structure still does not favor buyers: sellers continue to produce local results, while buyers show weak follow-through on every correction, despite a few confident candles.
Price has now tested the seller’s mirror zone at $102,900–$103,600 and is pulling back. A repeated test of $102,000–$100,000 remains likely — this is where buyers might show strength again.
Still, the most conservative long setup requires a break of the local downtrend: a breakout and consolidation above $105,400. Only after a retest of this level should we look for long opportunities with a proper risk–reward profile.
Buy zones:
• $102,000–$100,000 (volume anomalies)
• $97,000–$93,000 (volume area)
Sell zones:
• $105,800–$106,600 (local resistance)
• $109,500–$110,700 (accumulated volumes)
• $112,400–$113,300 (accumulated volumes)
• $114,700–$115,700 (accumulated volumes)
• $120,900–$124,000 (volume area)
This publication is not financial advice.
BITCOIN TO $130,000 - $140,000Hello! It's me again!
My friends, it seems that BTC's price action is clearly indicating its trend and direction. Of the last five candles on the weekly chart, four have shown a very clear indication: there are buyers on the downside, it has remained above the 55-week moving average, and we've seen very strong support around $103,000.
It's also true that the uptrend on the weekly chart is already quite worn out. It has been quite long and has remained solid until now; however, this could be the bullish move that ends the trend.
At the moment, the technical analysis is simple and very clear: we are within the lower range of an upward move (I bought at $109,900 six weeks ago and I plan to hold since the movement is clear).
In conclusion, Bitcoin will be looking for the $130,000 range and, at most, $140,000. The final upward move is about to begin.
See you later! And remember, this isn't advice, it's just an opinion.

Bitcoin Price Hits Historical Recovery BarrierBitcoin’s price is currently at $103,922, struggling to overcome the downtrend active for nearly two and a half weeks. The cryptocurrency has failed twice to breach this resistance, reinforcing the strength of bearish market sentiment.
At present, Bitcoin trades below $105,000 but remains above the $101,477 support zone. This area is likely to form a consolidation base amid persistent volatility and cautious investor behavior.
If bullish momentum strengthens, Bitcoin could break past $105,000 and challenge resistance near $108,000. Successfully flipping this level would mark the first significant recovery since October, signaling renewed optimism across the broader crypto market.

BTC Bitcoin Bullish Price Action Here's My Trade PlanBTC just broke to the upside! 💥 On the 🕓 4-hour timeframe, price action looks strong: higher highs and higher lows 📈⬆️. I’m waiting for a pullback 📉—once support is found 🛑 and structure breaks bullish again, I’m considering another buy opportunity 🚀💸.
Not financial advice.

Bitcoin 100k scenarioA scenario where it gets to 100k by end of year. Just saving this up there))
needs to be led by the important moving averages (50ma, 200ma...). lets go!

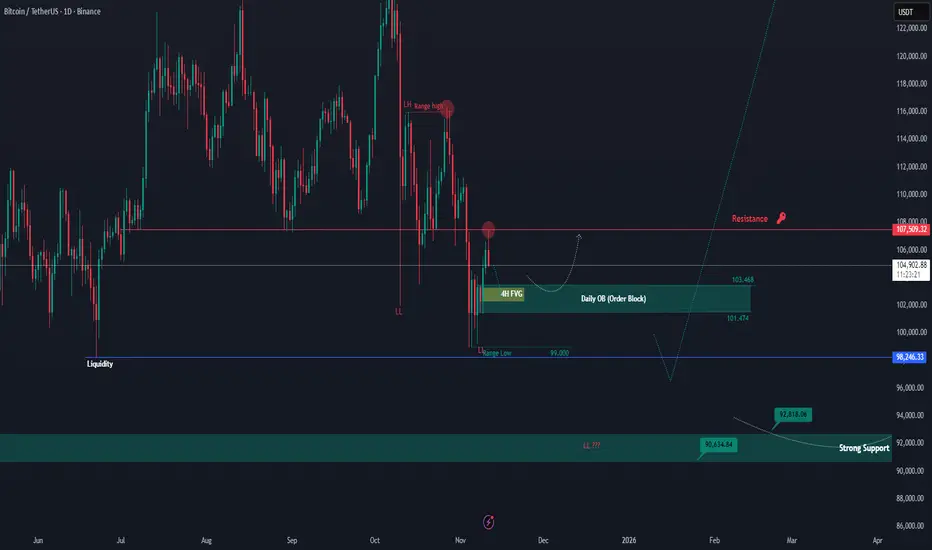
BTCUSDT – Retesting Key Levels After Resistance RejectionAs expected, BTC successfully closed above the $100K mark on the daily timeframe and moved up to retest the major resistance zone around $107,500. However, the price faced a clear rejection from this level, confirming that it remains a strong resistance area which Bitcoin must break to resume its upward momentum toward $110K–$112K.
Currently, BTC is showing signs of a potential pullback toward the Daily Order Block (OB) area near $103K–$101K. This zone will be crucial to watch — if the price reacts positively and rebounds, it could signal another push to retest the $107K resistance. On the other hand, a breakdown below this OB may open the door for a deeper retracement toward the $100K zone or even lower, possibly targeting the liquidity around $98K.
For now, BTC remains in a short-term corrective phase within a larger bullish structure. The reaction from the Daily OB zone will likely determine the next major move.
Long Bitcoin take profits just above ATHQuick video analysis with tutorial of the fake break of the head and shoulders top. Nice tight stop just below $100k on entry last Friday at $101k

Bitcoin Daily View — Triangle in Play, Bears May StayIn my view, Bitcoin is currently forming a corrective triangle (ABCDE), and the breakout seems more likely to occur to the downside.
🎯 Targets:
• 1️⃣ 98,000
• 2️⃣ 94,000
• 3️⃣ 92,000
❌ Invalidation Level: 104,500
In my previous posts, I mentioned that I expect Bitcoin to eventually reach 83,000, but for now, I’m setting my target at 92,000, as I don’t think it will drop that far immediately.
⚠️Disclaimer: This is just my personal market view, not financial advice. Always trade with stop-losses!
💬 Share your thoughts in the comments and follow for upcoming Bitcoin updates!
Bitcoin ETFs $2 Billion Outflow Could Push BTC Into CapitulationAt the time of writing, Bitcoin trades at $101,274, hovering just above the $100,000 psychological support. A breach below this level could trigger panic among retail traders.
If ETF outflows and bearish sentiment persist, Bitcoin could fall below $100,000 and test the $98,000 support. This decline could extend further, sending the crypto king towards $95,000 or lower.
However, should low prices attract fresh capital inflows, BTC may rebound toward $105,000 and aim for $110,000. Reclaiming this resistance would signal renewed market strength and invalidate the prevailing bearish outlook.

BTC/USDT Analysis. Local Weakness in Selling Pressure
Hello everyone! This is your CryptoRobotics trading analyst, bringing you the daily market review.
Yesterday, Bitcoin reached the $103,700–$106,700 (pushing volume) resistance zone and resumed its decline. The move both toward this area and away from it occurred mostly by inertia, with low volume and weak price action.
At the moment, BTC is testing the previously mentioned support around ~$101,000. We can now refine this level to $102,300–$100,500 . If a strong reaction appears here, we can expect a short-term long setup toward $106,000, where untested seller volumes remain.
If no reaction occurs, the decline is likely to deepen toward the next medium-term support at $97,000–$93,000 (high-volume zone).
Buy Zones:
$102,300–$100,500 (volume anomalies)
$97,000–$93,000 (high-volume zone)
Sell Zones:
$105,800–$107,400 (pushing volumes)
$109,500–$110,700 (accumulated volumes)
$112,400–$113,300 (accumulated volumes)
$114,700–$115,700 (accumulated volumes)
$120,900–$124,000 (high-volume zone)
This publication does not constitute financial advice.

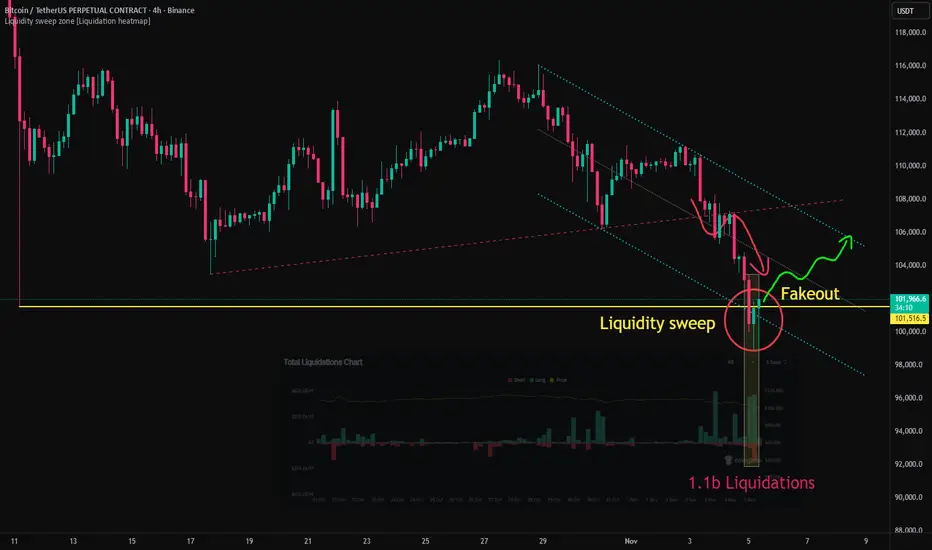
Bitcoin Drops Below 100K, Reversal Signal EmergingAfter breaking below the 107K support level, Bitcoin retested the area and then extended its decline.
As the downtrend intensified, the price broke through 102K, which was the low recorded during the large-scale liquidation event on October 11, and subsequently lost the psychological support level at 100K.
During the eight-hour period of this decline, approximately 1.1 billion USD worth of long positions were liquidated, accompanied by both a liquidity sweep and a fakeout pattern.
The simultaneous occurrence of large-scale liquidations, increased trading volume, a fakeout pattern, and the process of filling the CME gap indicates that multiple short-term reversal signals emerged in this zone.
From a technical standpoint, there is an increasing likelihood of two consecutive bullish candles with long lower wicks forming on the 4-hour chart, while the 12-hour chart also shows a high probability of developing a bullish candle with a long lower shadow.
This suggests a growing possibility of a short-term rebound, with the potential upside target near the upper boundary of the descending parallel channel.
Bitcoin SHORT AnalysisBitcoin SHORT Analysis
Our sell zone aligns with the Point of Control (POC) and an unfilled H1 Order Block (OB) & SIBI, which serves as our Point of Interests (POI).
This zone was established following a displacement and the formation of a CISD (Change in State of Delivery), indicating a potential shift in market structure.
Currently, there is a significant draw on liquidity on the sell side, with the previous day’s low (PDL) forming equal lows, suggesting a liquidity pool beneath this level.
I anticipate that price may sweep this liquidity before initiating a substantial move towards the buy-side liquidity.
Given that there have been no major liquidity sweeps thus far, I expect price to respect the H1 Order Block.
Should the appropriate confirmation signals appear, I plan to enter a short position targeting the PDL as the primary objective. 🎯

BTC/USDT Analysis. Testing the Lower Boundary of the Range
Hello everyone! This is the trader-analyst from CryptoRobotics, and here’s your daily analysis.
Since Monday, Bitcoin has moved exactly as expected — heading lower and testing the $105,600–$104,500 support zone (volume anomalies).
Volumes spiked sharply, and some selling pressure was absorbed, but on the second test, the price slid through the level almost effortlessly.
At the moment, Bitcoin is testing the lower boundary of the global range $102,000–$116,000, where we’re observing strong volume anomalies that have triggered a short-term correction.
However, this reaction alone is not enough for a full reversal.
We expect a retest of the push-volume zone $103,700–$106,700, from where seller pressure may resume, leading to a move toward ~$101,000.
Only if that zone shows strong buying defense can we consider long entries.
For now, the bias remains bearish — the market seller is weak, but the price continues to move downward by inertia.
If the $101,000 level fails to hold, the next downside target lies at $97,000–$93,000.
Buy Zones:
• ~$101,000 (volume anomalies)
• $97,000–$93,000 (volume zone)
Sell Zones:
• $103,700–$106,700 (push volumes)
• $109,500–$110,700 (accumulated volumes)
• $112,400–$113,300 (accumulated volumes)
• $114,700–$115,700 (accumulated volumes)
• $120,900–$124,000 (volume zone)
This publication is not financial advice.
Bitcoin Losses Hit 9-Month High Of $24 Billion Amid 8% Price DroBitcoin is trading at $101,729 at the time of writing, sitting just above the critical $100,000 support. Earlier, BTC slipped below this level, forming an intra-day low of $98,966 before rebounding slightly.
The recent 8% drop has validated a head-and-shoulders pattern, which projects a potential 13.6% decline targeting $89,948. However, if investors begin buying at lower levels, Bitcoin could bounce from $100,000 and retest $105,000 or higher.
Conversely, continued selling pressure and weak market conditions could send BTC below $100,000 again. A breach under $98,000 may lead to further losses toward $95,000 or lower, undermining any short-term recovery hopes.

Bitcoin - The devastating top formation!💎Bitcoin ( CRYPTO:BTCUSD ) is creating a top:
🔎Analysis summary:
In the end of 2022, we witnessed another perfect bullish break and retest on Bitcoin. This retest was followed by an incredible rally of +600%. But slowly, Bitcoin is retesting a massive curve resistance, which has been pushing price lower for the past 15 years.
📝Levels to watch:
$100,000 and $50,000
SwingTraderPhil
SwingTrading.Simplified. | Investing.Simplified. | #LONGTERMVISION

BTC Analysis 30/10/2025BTC / USDT
Bitcoin is forming a massive ascending wedge pattern, a bearish pattern currently undergoing a bearish retest.
The 200-day EMA is a significant support level and has been tested multiple times in the past few weeks. The more it is retested, the weaker the support becomes.
The sharp drop on October 10th impacted the market's direction.
Bearish targets for this scenario:
First support: 103,000 - 100,000
Major support: 94,000 - 89,000
Summary: The market is currently bearish, and we can revise our analysis if Bitcoin manages to stabilize above 117,000.
