Bitcoin BTC Bears Regain Control: Watching for a Short Setup 📊 Bitcoin Analysis (BTCUSD)
Currently, Bitcoin is showing clear bearish intent on the higher timeframes 🧭. After an extended period of range-bound price action, we’ve now seen a decisive displacement to the downside 💥 — a strong signal that sellers are taking control.
From here, I’ll be watching for a retracement back into equilibrium ⚖️ — the 50% level of the most recent swing — and will then look for signs of rotation and a break of structure 🧩 on the 30-minute chart to confirm a potential short setup 📉.
Patience is key here 🕰️ — I want to see price react efficiently to that retracement before considering entries.
⚠️ Disclaimer: This is not financial advice. Always conduct your own analysis before taking any trade.
Bitcoinidea

Analytics: Market Outlook and Forecasts
📈 WHAT HAPPENED?
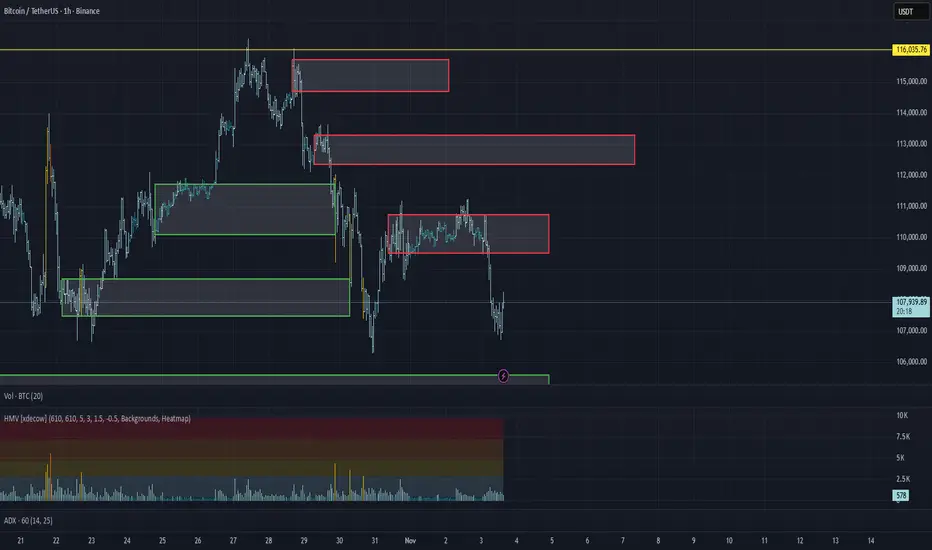
At the beginning of last week, Bitcoin tested the key level of $116,000, forming an abnormal cluster of buys below this mark. We expected a supporting force to emerge during the retest of this anomaly. However, the movement turned out to be a seller's trap, leading to a downward price reversal. On Tuesday, we highlighted this fact in our daily TradingView post and adjusted our analysis.
Bitcoin continued to decline, tested important volume zones below, and only slightly slowed down its fall. On the global timeframe, there is a clear sideways pattern in the range of $102,000-$116,000, within which we’re currently trading.
💼 WHAT WILL HAPPEN: OR NOT?
The priority for movement is towards the nearest selling zone. If there is no reaction from this zone, the priority is towards the lower boundary of the designated sideways pattern. We’re not considering global and positional buys yet. The initiative is still on the seller's side, and we should wait for a clearer picture.
When the lower limit of the flat is reached, the probability of returning to the range is minimal, as the volumes within the range are distributed closer to the upper limit. In this scenario, we’ll consider more global buy zones below the current level.
Buy Zones:
• $105,600–$104,500 (volume anomalies)
• $97,000–$93,000 (volume zone)
Sell Zones:
• $109,500–$110,700 (accumulated volumes)
• $112,400–$113,300 (accumulated volumes)
• $114,700–$115,700 (accumulated volumes)
• $120,900–$124,000 (volume zone)
📰 IMPORTANT DATES
This week, we are following these macroeconomic events:
• November 3, Monday, 14:45 (UTC) - publication of the US Manufacturing PMI for October;
• November 3, Monday, 15:00 (UTC) - publication of the US Manufacturing PMI for October by ISM;
• November 4, Tuesday, 15:00 (UTC) - publication of the US Job Openings and Labor Turnover (JOLTS) for September;
• November 5, Wednesday, 13:15 (UTC) — publication of the change in the number of employed in the non-agricultural sector of the United States for October;
• November 5, Wednesday, 14:00 (UTC) — publication of the supply management index for the non-manufacturing sector of the United States for October;
• November 5, Wednesday, 14:45 (UTC) — publication of the business activity index for the services sector of the United States for October;
• November 6, Thursday, 12:00 (UTC) — announcement of the UK interest rate decision for November;
• November 6, Thursday, 13:30 (UTC) — publication of the number of initial unemployment claims in the United States.
*This post is not a financial recommendation. Make decisions based on your own experience.
#analytics
BITCOINS - ANOTHER OPPORTUNITYTeam,
last week we went long BITCOINS at 108k, then add more at 107500, with target at 109-111k
TARGET HIT
We are now entered at 107.5k, will add more at 107k
WITH STOP LOSS AT 105K
Target 1 at 109-111.5k
Target 2 at 113-115k
Once it hits 1st target, take a partial 70% and bring the stop loss to BE for the next target.

Bitcoin Setup Ahead – Is the $115K Target Within Reach?🎯 BTC/USDT: The Gentleman Thief's Heist Plan | $115K Target 🔥
📊 Market Overview
Asset: BTC/USDT (Bitcoin vs Tether)
Market: Crypto
Strategy Type: Swing/Day Trade
Bias: 🐂 BULLISH
🎭 The Setup: Planning the Perfect Heist
Ladies & Gentlemen, gather 'round! We're orchestrating a sophisticated Bitcoin heist, and the vault is looking mighty accessible right now. 💼💰
🔍 TECHNICAL CONFIRMATION
✅ Weighted Moving Average (WMA) Double Pullback Detected
The chart structure shows a confirmed bullish setup with double pullback pattern on the WMA, signaling potential upward momentum continuation.
🚪 Entry Zone: Any Price Level
That's right, OG Thieves — flexibility is key! You can enter at current market price. We're not picky when the setup looks this clean.
🚨 Stop Loss: $103,000 (The Escape Route)
Now listen carefully, fellow bandits: This is my stop loss level at $103,000. But here's the deal — I'm NOT telling you to blindly follow my SL. You're the mastermind of your own operation! Manage your risk, protect your loot, and make decisions based on YOUR risk tolerance. Every thief needs their own exit strategy. 🏃♂️💨
🎯 Target: $115,000 (The Main Score)
Our primary target sits at $115,000. Why stop at $116K when there's a police barricade (strong resistance) + overbought conditions + potential trap zone lurking there? Smart thieves know when to grab the bag and disappear before the alarms go off! 🚔
Important Reminder: This is MY take-profit level. You run your own show! If you want to be greedy and push for $116K+, that's YOUR call. Take profits when YOU feel comfortable. This is your heist, not mine! 💼✨
🔍 Technical Analysis: Reading the Blueprint
Key Resistance Zones:
$115,000 - Primary target (Sweet spot to secure profits)
$116,000 - Strong resistance + overbought danger zone (Police barricade territory!)
Support Levels:
$103,000 - Critical support/stop loss area
Market Structure: Bullish momentum intact with room to run toward our target zone. Watch for signs of exhaustion near $115-116K.
👀 Related Pairs to Watch
Keep your eyes on these correlated moves:
🔹 ETH/USDT - Often follows Bitcoin's lead; look for confirmation
🔹 BTC Dominance (BTC.D) - Rising dominance = BTC outperformance
🔹 DXY (US Dollar Index) - Inverse correlation; weak dollar = crypto strength
🔹 TOTAL (Total Crypto Market Cap) - Confirms overall market sentiment
Key Correlation: When BTC pumps with strong volume, altcoins typically follow with a slight lag. Monitor Ethereum for confirmation of crypto-wide bullish sentiment.
🎪 Risk Management: Don't Get Caught!
⚠️ This is a high-risk, thief-style trading strategy — meant for entertainment and educational purposes!
✅ Golden Rules:
Never risk more than you can afford to lose
Position sizing is EVERYTHING
Have YOUR OWN exit plan
Markets can reverse faster than you can say "heist"
This is NOT financial advice — just one thief sharing his blueprint with other thieves! 🎩
💬 Final Word from Your Fellow Bandit
Stay sharp, stay disciplined, and remember: The best thieves are the ones who live to steal another day! 😎🔓
Whether you're swinging for the fences or day-trading the volatility, make sure you've got YOUR plan locked in. My levels are just a reference point — YOU are the mastermind of your own trading heist!
Good luck, OG Thieves! May your bags be heavy and your exits be timely! 🎯💰
✨ "If you find value in my analysis, a 👍 and 🚀 boost is much appreciated — it helps me share more setups with the community!"
#Bitcoin #BTCUSDT #CryptoTrading #SwingTrading #DayTrading #TradingView #CryptoAnalysis #BullishSetup #BTCPrediction #CryptoSignals #TechnicalAnalysis #BitcoinTrading #CryptoTA #PriceAction #TradingIdeas

Ready for BTC/USDT's Next Big Move?🎉 BTC/USDT: "Bitcoin vs. Tether" Crypto Wealth Heist Map (Swing/Day Trade) 🤑
🚨 Thieves of the Crypto Market, Assemble! 🚨
Ready to pull off a stylish swing/day trade heist on BTC/USDT? This is your Crypto Wealth Strategy Map with a bullish setup that’s screaming opportunity!
📈 Let’s dive into this cheeky yet professional plan with a sprinkle of thief swagger to snatch those profits! 💰
📊 The Setup: Why This Trade is a Steal! 🕵️♂️
Bullish Confirmation: We’ve got a double bottom pattern signaling a potential reversal. ✅
Accumulation Zone: Price action shows buyers stacking up, ready to push BTC higher. 🛒
Heikin Ashi Reversal: Smooth, green Heikin Ashi candles confirm the bullish vibes. 🟢
Market Sentiment: The crypto streets are buzzing with optimism — time to capitalize! 😎
The Thief’s Entry Plan: Layered Limit Orders 💸
This is where our thief strategy shines! We’re using a layering strategy with multiple buy limit orders to sneak into the market like the slick bandits we are. 🕴️
Entry Levels:
🎯 $112,000
🎯 $113,000
🎯 $114,000
🎯 $115,000
🎯 $116,000
Pro Tip: Feel free to add more layers based on your risk appetite! Stack those orders like a master thief planning the perfect heist. 😏
Why Layering?: This approach lets you average into the position, reducing risk if the market pulls a fast one. 🃏
🛑 Stop Loss: Protect Your Loot! 🔒
Thief’s Stop Loss: Set at $110,000. This is our escape hatch if the market turns into a trap. 🕳️
Note: Dear Thief OGs (Ladies & Gentlemen), this SL is just a suggestion. You’re the boss of your own vault — adjust it to your risk tolerance! 💪
🎯 Target: Cash Out Like a Pro! 🏦
Profit Target: Aim for $127,000, where we expect strong resistance and potential overbought conditions. Watch out for a possible trap — don’t get greedy! 😈
Note: Dear Thief OGs, this TP is my take. You decide when to grab your profits and vanish into the crypto night. 🌙 Take the money and run at your own discretion!
🔗 Related Pairs to Watch 👀
Keep an eye on these correlated pairs (all in USD) to confirm the broader market trend:
BITSTAMP:ETHUSD : Ethereum often moves in tandem with Bitcoin. A bullish ETH could reinforce BTC’s upward momentum. 📈
BITSTAMP:XRPUSD : Ripple’s price action can signal broader crypto market strength. Watch for similar bullish patterns. 🌊
COINBASE:LTCUSD : Litecoin tends to follow BTC’s lead. A breakout in LTC could confirm our bullish bias. ⚡
Key Correlation Insight: These pairs often move together due to shared market sentiment in the crypto space. If BTC/USDT pumps, expect ETH, XRP, and LTC to potentially follow suit. Cross-check their charts for confluence! 🧠
🛠️ Technicals Recap: The Thief’s Toolkit 🧰
Double Bottom: A classic reversal pattern signaling bulls are ready to charge. 🐂
Accumulation Zone: Buyers are quietly stacking positions — a sign of strength. 📦
Heikin Ashi: Smooth candles filter out noise, confirming bullish momentum. 🕯️
Resistance Watch: $127,000 is a key level where sellers might step in. Stay sharp! ⚠️
⚠️ Disclaimer: Thief Style, Just for Fun! 😜
This Thief Strategy is for entertainment and educational purposes only. Trading is risky, and the crypto market can be a wild ride. Always do your own research (DYOR) and manage your risk like a seasoned bandit. I’m not a financial advisor, just a cheeky chart enthusiast sharing the vibe! 😎
✨ If you find value in my analysis, a 👍 and 🚀 boost is much appreciated — it helps me share more setups with the community!
#BTCUSDT #CryptoTrading #SwingTrading #DayTrading #ThiefStrategy #Bullish #TechnicalAnalysis #HeikinAshi #DoubleBottom #MakeMoney

Bitcoin Beyond 2025, Path to 2029 Peak & 4 year cycleLikely bitcoin price movement for the rest of 2025 to the bear market bottom of 2026/27 and finally to the next bull peak of 2029
Check in early 2027 for accuracy

BTC Retracement Setup After Liquidity Sweep at Key Resistance📊 Bitcoin 4H Analysis – Bullish Momentum Meets Key Liquidity Zone
Bitcoin continues to trade within a strong bullish trend on the 4-hour timeframe. Price has now tapped into a major resistance zone — the liquidity sitting above a previous external range high. This reaction suggests we may see a corrective move before the next leg higher. 🔁💡
I’ll be waiting for price to retrace back into equilibrium of the current bullish price swing, where premium turns to discount, to look for a high-probability long setup. ✅🎯
⚠️ Not financial advice — for educational purposes only.

BTC/USDT Analysis. The seller’s trap worked — what’s next?
Hello everyone! This is the trader-analyst from CryptoRobotics, and here’s your daily analysis.
Yesterday, Bitcoin failed to update its local high. The zone we highlighted earlier — $115,000–$115,400 (buy absorption) — worked as expected, but buyers were unable to close above it on the hourly timeframe.
After testing this zone, the market saw a sharp decline.
At the moment, a significant amount of volume has accumulated around ~$113,000, and the delta shows selling pressure. We can expect a retest of the lower support zone and will monitor the reaction. If the price bounces from $111,700–$110,000, the first resistance to watch will be around ~$113,000.
An alternative scenario suggests renewed buying from current levels. In that case, we’ll look for short entries near the updated seller zone — $114,700–$115,700 (accumulated volumes).
Buy Zones:
$111,700–$110,000 (accumulated volumes),
$108,700–$107,500 (volume zone),
$105,600–$104,500 (volume anomalies),
$97,000–$93,000 (volume zone).
Sell Zones:
$114,700–$115,700 (accumulated volumes),
$120,900–$124,000 (volume zone).
This publication is not financial advice.

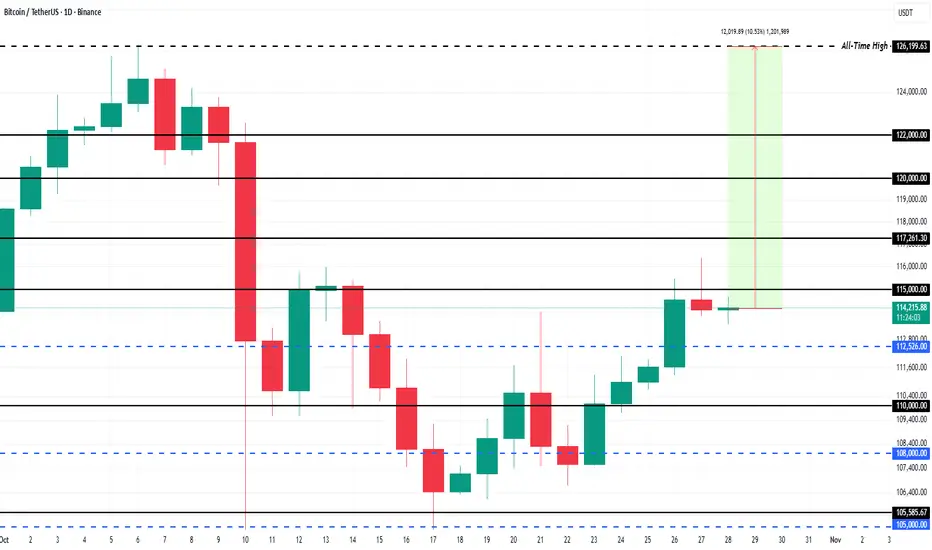
What To Expect From Bitcoin Price In November 2025At the time of writing, Bitcoin trades at $114,518, sitting just below the key $115,000 resistance level. With investor sentiment turning increasingly positive, BTC could soon push through this barrier. A confirmed breakout would likely trigger renewed momentum, driving prices toward higher resistance levels in November.
Bitcoin’s near-term target remains its all-time high (ATH) of $126,199, which requires a 10.2% rise from current levels. To achieve this, BTC must first clear strong resistance zones at $117,261 and $120,000, where heavy supply from profit-takers could temporarily slow progress.
However, if Bitcoin fails to sustain momentum above $115,000, short-term weakness could reemerge. A dip toward $110,000 remains possible if buyers lose conviction. Any move below this support would invalidate the bullish outlook.
Bitcoin AMD for London Session - LONG We are currently observing a typical Accumulation-Manipulation-Distribution (AMD) entry model to support a bullish bias for Bitcoin in the upcoming hours (London Session).
At present, price action appears to be in an accumulation phase. We anticipate a potential liquidity sweep of a key swing low , specifically, the previous day’s low (PDL), which aligns with a Point of Interest (POI): an unmitigated H1 order block.
Sell-side liquidity from the previously established dealing range has already been swept, indicating that a manipulation phase may be underway.
Based on this structure, we can reasonably expect a price movement toward the 0.618 Fibonacci retracement level of the prior range.

BTC/USDT 4H AnalysisAfter taking out the sell-side liquidity, Bitcoin has shown signs of reversal and filled previous imbalance zones.
Currently, price is reacting from a Fair Value Gap (FVG) around the 110K area after a market structure shift (MSS).
🟢 The bullish scenario suggests that if this FVG holds, BTC could aim for the next buy-side liquidity around 126K as the main target.
🎯 First target: 115K – liquidity area above the short-term high.
🚀 Final target: 126K – buy-side liquidity sweep.
📌 Key zones:
Sell-side liquidity taken ✅
FVG (Potential bullish continuation area)
Buy-side liquidity at 126K
📅 Analysis based on Smart Money Concepts (SMC) and liquidity flow.
📖 For educational purposes only — not financial advice.

BUY BITCOIN BTCUSD - Low risk high rewardBitcoin experienced a big drop to the downside but it nows has clear signs of bullish movement ahead. There is currently a head and shoulders pattern forming which has given us high confidence that it will head to the upside. BUY NOW!

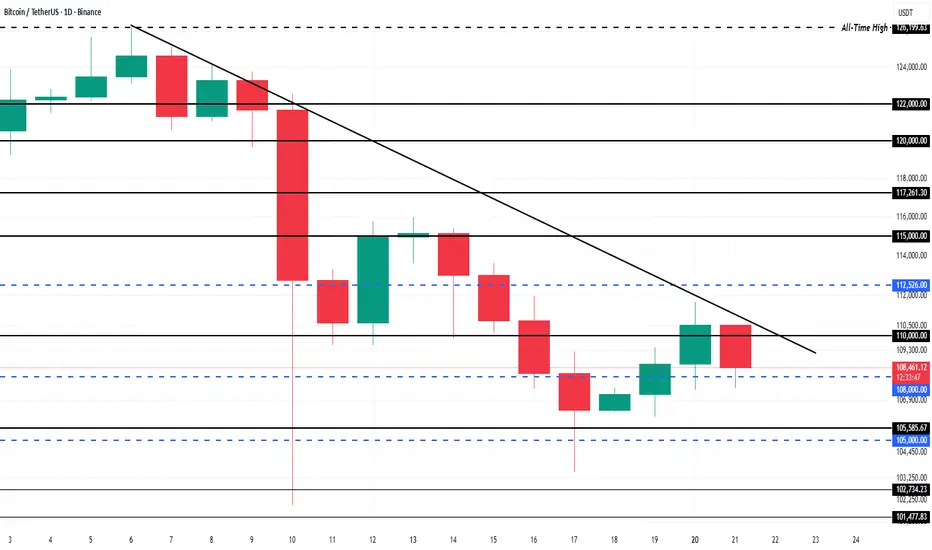
Bitcoin Nears Capitulation As Price Fails To Breach DowntrendAt the time of writing, Bitcoin trades at $107,734, holding below the $108,000 resistance. The crypto giant has repeatedly failed to break the two-week downtrend line, signaling weakening momentum and growing skepticism among investors.
The formation of lower lows this week is concerning. If Bitcoin cannot reclaim the $110,000 psychological level, the price could slip further toward $105,000 or even lower, amplifying selling pressure. Sustained bearishness could accelerate this move, pushing BTC into deeper correction territory.
However, if Bitcoin manages to regain $110,000 as support, the technical outlook could improve sharply. This would invalidate the downtrend and open the door to a move toward $112,500 and possibly higher. In that case, short-term recovery would be back on the table, but for now, caution remains the dominant theme across the Bitcoin market.
BUY BITCOIN - BTC/USD- Amazing low risk high reward trade!Based on our deep analysis we can see that BITCOIN (BTC/USD) will head to the upside. Great time to BUY - it has broken POWERFUL resistance levels and is also being held by powerful support levels which it can't break through. Target is next resistance level - buy now!

SELL BITCOIN Btc/Usd - Amazing low risk high reward trade!Based on our deep analysis we can see that BTC/USD Bitcoin will head to the downside. Great time to buy - it has broken major support levels + trends.

Bitcoin has 2 scenario, better watch these levelsUnless CRYPTOCAP:BTC regains 114k from here, It is aiming for 100k and a little below maybe.
100k is a big figure as well so very likely to see some manipulation around that levels.

(BTC/USD) –1H Bearish SetupBitcoin remains in a bearish continuation phase as long as it stays under the red EMA band and below $108.5K.
Downside Fibonacci targets:
T1: $104,200 First bearish target — potential short-term take-profit zone.
T2: $102,600 Mid-term target — continuation move with momentum confirmation.
A clean 4H close above $109,800 would invalidate the short setup and shift bias back toward neutral-to-bullish.
💡 Bearish Confluences
Below Red EMA Ribbon: Price action continues to reject the 4H red EMA zone — clear sign of sustained seller strength.
Lower High Formation: Each rebound remains capped below prior highs; structure shows descending channel continuation.
Volume Weakness on Rallies: Reduced buying volume on retracements supports distribution pattern.
Bearish Fib Confluence: 0.618 retracement aligns with upper EMA resistance (~$108.5K).
RSI Neutral → Downturn: RSI hovering near 45–50, turning lower — loss of momentum confirmation.

$PUP IN STRONG SUPPORT - ACCUMULATION ZONEGETTEX:PUP looks like it is forming its bottom nicely at these levels
Accumulate

Bitcoin Price Slips Below $108,000: Time To Buy The Dip?At press time, Bitcoin trades at $106,947, sitting below the critical $108,000 level that previously acted as strong support. This loss has heightened volatility across the market, but a rebound remains possible if buying momentum holds.
Should accumulation persist and investor sentiment strengthen, Bitcoin could reclaim $108,000. This would push it toward $110,000, with a potential extension to $112,500 if momentum builds further. Such a move would indicate renewed market confidence.
Conversely, failure to maintain current levels could lead to further downside. A drop below $105,000 would expose Bitcoin to additional selling pressure. This would potentially dragging it toward $101,477 and invalidating the short-term bullish outlook.

Winter is coming part 2This is a follow up idea to my last post just to make things more interesting.

Bitcoin BTC - Market AnalysisWhile my broader bias on Bitcoin (BTC) remains bearish, I hold a short-term bullish outlook leading into the New York (NY) session open. This perspective is based on several key technical observations:
I anticipate potential price manipulation during the NY session that may drive BTC toward the 0.618–0.786 Fibonacci retracement levels. This zone also coincides with a significant market structure shift (MSS) key level, making it a potential area of interest for short positions.
Notably, we have already seen strong rejection from the 0.5 equilibrium level within the current Fibonacci range, suggesting sustained selling pressure from market participants.
Furthermore, there appears to be limited liquidity buildup on the buy side, indicating a lack of engineered liquidity or compelling draw for a continued move higher compared to the liquidity we have on the sellside.
Given these factors, I plan to position myself for a potential short trade, capitalizing on any bullish manipulation that drives price into the aforementioned sell zone.

BITCOIN Bearish Breakout!
HI,Traders !
#BITCOIN made a bearish
Breakout of the key horizontal
Level of 109022.4 and the
Breakout is confirmed
So we are bearish biased
And we will be expecting
A further bearish move down !
Comment and subscribe to help us grow !

Bitcoin at Heavy Supports – Time to Go Long?As I expected in my previous idea , Bitcoin ( BINANCE:BTCUSDT ) completed both its bullish and bearish moves and hit its Long and Short targets .
Bitcoin can still see some upside as long as it holds this Heavy Support zone($111,980-$105,820) . However, given the recent momentum and the wick down to around $102K a few days ago, any further rally depends on breaking the Resistance zone($118,750-$115,730) and touching around $117,220 , which is the high of that significant bearish candle .
Currently, Bitcoin is sitting in a Heavy Support zone($111,980-$105,820) near the 200_SMA(Daily) and a Cumulative Long Liquidation($108,415-$107,156) . It's basically hovering between key weekly support lines, so this is a pretty strong supports .
In terms of Elliott Wave theory , it looks like Bitcoin is still completing its wave 4 . This wave 4 might have formed a Double Three Correction(WXY) , and now we can expect a potential upward move .
I expect that in the next few hours, Bitcoin may start a short-term bullish move up to around $115,000 or to the Cumulative Short Liquidation Leverage($114,973-$113,435) .
Note: Overall, it's better to look for Long positions right now, considering Bitcoin's position. But if it breaks the 200_SMA(Daily) and the Heavy Support zone($111,980-$105,820), we could see a broader crypto market drop.
Note: Around the $108,000 level, we have huge buy orders stacked up, which might act as a significant support zone.
Please respect each other's ideas and express them politely if you agree or disagree.
Bitcoin Analysis (BTCUSDT), 4-hour time frame.
Be sure to follow the updated ideas.
Do not forget to put a Stop loss for your positions (For every position you want to open).
Please follow your strategy and updates; this is just my Idea, and I will gladly see your ideas in this post.
Please do not forget the ✅' like '✅ button 🙏😊 & Share it with your friends; thanks, and Trade safe.
