Bitcoin Price’s Grip on $115,000 Weakens—Here's the RiskBitcoin is trading at $114,770, slipping below the $115,000 support level in the process. Should bearish sentiment persist, BTC may fall further, potentially testing the uptrend line that has supported its rise since the start of the month. This would mark a crucial point for investors.
If selling pressure intensifies, Bitcoin could struggle to hold $115,000 as support and slide toward $112,500. This would represent a critical setback, reinforcing the ongoing distribution phase observed among holders and limiting near-term upside potential for BTC.
On the other hand, if Bitcoin absorbs the selling pressure and regains momentum, reclaiming $115,000 as support could trigger another rally. In this case, BTC would target $117,261 in the coming days, reaffirming its bullish outlook and reinforcing investor confidence.
Bitcoinidea

Bitcoin Price To Climb Higher Amid Rising Institutional AdoptionBitcoin Price To Climb Higher Amid Rising Institutional Adoption, Yet Ethereum's Relative Value Puzzles Investors
The digital asset landscape presents a fascinating dichotomy. Bitcoin, the undisputed leader, appears poised for a significant ascent, with analysts increasingly confident in a rally toward the coveted $120,000 mark. This optimism is overwhelmingly fueled by a powerful and sustained wave of institutional adoption, underscored by staggering inflows into U.S. spot Bitcoin Exchange-Traded Funds (ETFs). However, a perplexing counter-narrative is unfolding with Ethereum. Despite its own significant institutional embrace and the successful launch of its own ETFs, the ETH/BTC price ratio remains stubbornly low, signaling a relative weakness against Bitcoin that has left many investors searching for answers.
Bitcoin's Bullish Momentum: The Unstoppable Force of Institutional Capital
The sentiment surrounding Bitcoin is palpably bullish. After a period of consolidation, the cryptocurrency has shown remarkable resilience, holding key support levels and demonstrating renewed strength. Bitcoin is trading at elevated levels, with technical analysts and market experts setting their sights on the next major psychological barrier of $120,000. A sustained break above this level is widely expected to trigger a fresh wave of buying pressure, potentially propelling the price toward new all-time highs.
A flurry of price predictions from various financial institutions and seasoned analysts paints a picture of widespread optimism. Forecasts range from conservative six-figure targets to highly bullish projections well above $200,000. These predictions are united by a common thread: the transformative impact of institutional adoption.
The primary engine driving this bullish outlook is the unprecedented success of U.S. spot Bitcoin ETFs. These investment vehicles have served as a regulated and accessible bridge for institutional capital to flow into the digital asset space. Recent weekly net inflows have been measured in the billions of dollars, reversing previous outflows and signaling a renewed and voracious investor appetite. Leading funds from major asset managers have been the primary beneficiaries, consistently attracting hundreds of millions in fresh capital.
This influx of institutional money represents a fundamental shift in how Bitcoin is perceived. Major institutions are actively adding exposure and incorporating Bitcoin into their long-term investment strategies. This is evidenced by the behavior of "whales"—large Bitcoin holders—who have been accumulating significant amounts, viewing price dips as buying opportunities. The growing institutional presence is also contributing to a reduction in Bitcoin's notorious volatility, making it a more attractive asset for diversified portfolios.
Further bolstering the bullish case are favorable macroeconomic conditions. With expectations for lower interest rates, the appeal of risk assets like Bitcoin is on the rise. A weaker U.S. dollar and lower borrowing costs historically create a fertile environment for assets with a fixed supply to thrive. The confluence of massive ETF inflows, strategic institutional accumulation, and a supportive macroeconomic backdrop has created a powerful tailwind for Bitcoin.
The Ethereum Conundrum: High Adoption, Low Ratio
While Bitcoin basks in the glow of institutional validation, the story for Ethereum is more nuanced. On the surface, Ethereum is experiencing its own institutional renaissance. The approval of spot Ethereum ETFs has been met with considerable enthusiasm, attracting billions in capital and providing a regulated pathway for traditional investors to gain exposure to the world's leading smart contract platform.
The inflow data for Ethereum ETFs has been impressive, at times even surpassing Bitcoin's on a monthly basis. Cumulative inflows have reached a significant figure, a clear testament to the growing recognition of Ethereum's value proposition, which extends beyond a simple store of value to encompass the vast ecosystems of decentralized finance (DeFi), non-fungible tokens (NFTs), and real-world asset (RWA) tokenization.
Institutions are not just buying ETH through ETFs; they are also actively participating in the network's staking mechanism. An unprecedented surge in staking activity has seen a significant portion of ETH's circulating supply locked away to secure the network and earn yield. This "supply squeeze" is fueled by both institutional players and large individual holders, underscoring the long-term conviction in Ethereum's future. With a large percentage of the total supply staked, the available liquidity on exchanges has dwindled, a factor that would typically be expected to exert strong upward pressure on the price.
Given this backdrop of robust adoption, significant ETF inflows, and a tightening supply, one would expect Ethereum to be gaining ground on Bitcoin. However, the ETH/BTC price ratio, a key metric that reflects the relative value of Ethereum to Bitcoin, tells a different story. This ratio has remained stubbornly below the 0.05 mark, a level that signals relative weakness for ETH. It currently hovers at a low level, far from its historical peak.
This persistent underperformance is a source of considerable debate. A higher ratio indicates that ETH is appreciating faster than BTC. The current suppression suggests that while absolute demand for Ethereum is strong, the demand for Bitcoin is even stronger.
Several factors may be contributing to this conundrum. Bitcoin's established brand and its narrative as "digital gold" give it a powerful first-mover advantage, particularly among institutional investors taking a conservative, phased approach. For many, Bitcoin is the initial and primary allocation.
Secondly, Ethereum's utility introduces complexities and risks compared to Bitcoin's simpler value proposition. The ongoing evolution of the network, while bullish long-term, may present a steeper learning curve for some investors.
Furthermore, a historical trend of Bitcoin outperforming Ethereum may have created market inertia, with capital continuing to flow into the asset with stronger recent relative performance. In essence, both assets are appreciating, but Bitcoin is doing so at a faster rate, keeping the ratio suppressed.
Beyond the Big Two: Other Trending Cryptos to Watch
While Bitcoin and Ethereum dominate, the broader cryptocurrency market is a hotbed of innovation. Investors are exploring a diverse range of projects with potential for significant growth, driven by several key trends.
Layer-2 Scaling Solutions: As Ethereum faces demand-driven congestion, Layer-2 solutions have become indispensable. Projects offering faster, cheaper, and more scalable environments for decentralized applications are capturing a growing share of activity and represent a crucial investment theme for ecosystem growth.
Integration of Artificial Intelligence and Blockchain: The convergence of AI and blockchain is gaining considerable traction, creating new possibilities in automated trading, decentralized organizations, and sophisticated dApps. Projects leveraging AI to enhance blockchain capabilities are attracting significant attention.
Tokenization of Real-World Assets (RWA): This is poised to be one of the most transformative trends. Representing physical assets like real estate and commodities as digital tokens on a blockchain has the potential to unlock trillions in illiquid assets, making them more accessible and tradable globally. This is expected to drive a new wave of adoption.
Meme Coins and Community-Driven Projects: While often speculative, meme coins continue to exert significant influence, demonstrating the power of community and viral marketing. Their enduring popularity highlights the importance of cultural relevance in the crypto space.
The altcoin market is characterized by higher volatility and risk. However, for investors with a high-risk tolerance, it offers the potential for outsized returns based on technological adoption and market trends.
The Road Ahead: A Market at a Crossroads
The cryptocurrency market is a study in contrasts. The overwhelming force of institutional adoption is propelling Bitcoin toward potentially historic highs. The success of Bitcoin ETFs has fundamentally altered the market structure, creating a sustained demand that shows no signs of abating.
Conversely, the curious case of the ETH/BTC ratio serves as a reminder of the market's complexity. While Ethereum's own institutional story is compelling, it has yet to translate into sustained outperformance against Bitcoin.
Looking ahead, the market's trajectory will be shaped by key factors. Central bank monetary policy will continue to play a crucial role. The continued growth of the ETF market will be a primary indicator of institutional sentiment. And ongoing innovation in scaling, AI, and tokenization will determine the next generation of leading projects.
For investors, the current environment offers both immense opportunity and significant risk. The bullish case for Bitcoin appears robust, but volatility remains. Ethereum's long-term value is undeniable, but its short-to-medium-term performance relative to Bitcoin is less certain. The altcoin market holds promise but requires careful navigation.
In conclusion, the narrative of rising institutional adoption is powerfully reshaping the digital asset landscape. As Bitcoin bulls eye their next target, the broader market watches closely, navigating the crosscurrents of innovation, regulation, and macroeconomic forces that will define the future of this transformative technology.

BITCOIN HIGH PROBABILITY SETUP!!!🚨 BTCUSD HIGH PROBABILITY BUY SETUP 🚨
* Here We Can See The Next Potential Move For BTCUSD Coming Hours/Days.
* Keep Your Eyes Close On Your Trading Positions.
* Happy PIP Hunting Traders.
FXKILLA.

The ray of hope doesn't last longI think in about 2 hours we will see a new downward movement.
Only the market maker knows of course.
But these are calculations using probability theory.
Always look at all the details when analyzing, don't look at the fact that the candle is green.
It lures you psychologically to buy. But it's still early.
There are few liquidations on the market. They are not being written about yet.
There are still strong token inflows to the exchanges

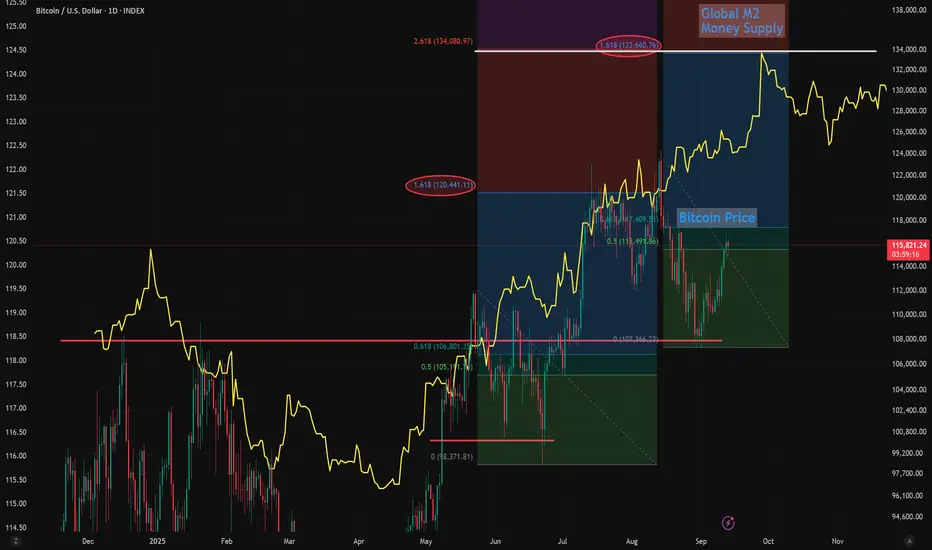
Global M2 and Bitcoin Fib Bounce Targets Point to $134K Next Global M2 has been leading Bitcoin which has been diverging, mostly due to an economic slowdown and waiting for interest rates to start dropping as a catalyst.
Since we're pricing in and high probability of 3 rate cuts starting in September, I expect Bitcoin to start pushing higher and several studies point toward $134k - $135k from here.
These Fibs studies aren't exactly correct, b/c I drew the high / low using the wiicks vs the real bocy, but still interesting.
The first Fib swing high/low correction forecast the pump to the 1.618 target.
So using the most recent high/low swing, points toward around $134k on the 1.618 which is coincidentally the 2.618 extension from the first Fibonacci.
My bull-flag targets on Bitcoin also point to a measured move of $134k-$135k as the next likely profit target, before another pullback and ultimately on the way to $150k this year I think.
Let me know your thoughts below.
- Brett
Bitcoin Road to September 17Good morning, this is my first time here.
Today we’ll take a detailed look at Bitcoin’s path leading up to the main Fed meeting later this month.
A small “impulsive” move up to 117K is still possible while the market remains weak. Weekends are always weak, and market makers take advantage of this for their manipulations.
Right now, their goal is to gather as much liquidity as possible before the next upward move. Market sentiment is not in their favor, but the weekend is helping them.
Next, there are two major liquidity clusters at 112K and 110K. By luring traders into a trap with a fake rally, the price can safely head lower. It’s hard to move down against strong bullish sentiment, but there’s no other option—otherwise, during a rally without corrections, long positions will lock in profits as the price rises, each “pulling” liquidity to themselves.
This doesn’t necessarily mean the drop will reach those exact levels. You always need to watch the market in real time, not just “guess with daisies.”
Please subscribe and support, and I’ll continue to analyze the market live as the moves unfold.
Wishing you a great weekend and all the best!

BTC Breaks out ! Classic breakout .
Let's see if we this breakout holds up or not.
We will watch this one closely....

Bitcoin Price Eyes Breakout as ETF Inflows Mirror ATH TrendBitcoin’s price is trading at $114,192 at the time of writing, facing resistance at $115,000. Sustained buying interest at this level will be crucial to trigger the next stage of upward movement.
If ETF inflows remain strong, BTC could flip $115,000 into support and rally toward $117,261 before targeting $120,000. This level would represent a critical milestone in Bitcoin’s ongoing bull cycle.
However, if the breakout attempt fails, Bitcoin may consolidate between $112,500 and $110,000. Such a pullback would invalidate the immediate bullish thesis but still keep BTC within its broader uptrend channel.

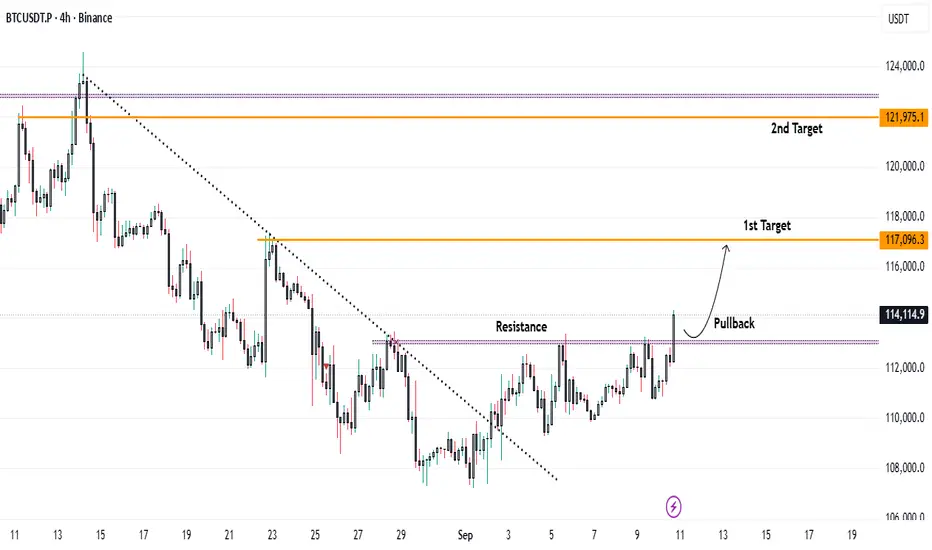
Bitcoin Breaks Key Resistance – Upside Targets in Focus...Bitcoin has been consolidating below the $113,000 resistance level over the past few sessions. On the hourly timeframe, price has now successfully broken above this barrier and is sustaining the breakout.
📈 Trading Outlook:
* A pullback towards $113,000 could offer a favorable long entry opportunity.
* Upside Targets:
* First target: $117,000
* Second target: $122,000
The breakout and successful close above resistance suggest strong bullish momentum, provided price holds above the $113,000 zone.
Bitcoin BTC is at a Critical Level: Equal Highs Trade Plan💰 Bitcoin (BTC) Update 💰
BTC is currently trending upward 🟢📈 on the 30M timeframe ⏰ and has reached a critical level ⚖️. We’re seeing a shift in structure 🔄, but there are equal highs forming 📍, leaving the question: will price break higher and continue bullish 🚀, or reject and move lower 🔽?
📊 My trade plan is simple:
✅ Wait for a break above the current range/equal highs 📈
✅ Look for a retrace + retest 🔄
✅ Enter long on confirmation 🎯
If this setup fails to play out, then the idea is invalidated ❌ and we stand aside.
⚠️ This analysis is for educational purposes only and not financial advice. 📚

Bitcoin EMA update - Big day today ?This chart uses the EMA, Simple Moving Average
Red = 50, Blue = 100, Green = 128, Yellow = 200
Today, PA is once again up against the 50 EMA that has become resistance.
This is just below the important level that would allow us to make a higher high if PA breaks through.
A Higher High is made if we rise above 113452
We can see that the 100 SMA is also now on a local line of support.
So it is decision time for PA today.
To remain in an ever decreasing area, a squeeze, or Break out above the 50 ( 112967 ) or fall below the 100 ( 110831 ) and the local support.
As you can see, this is a very tight range
This is continued with the 128 SMA at
109134
A Lower low is made if we drop below 107165
Daily MACD still rising Bullish
This is only just and not really showing to many sighs of a "Surge". The Histogram is green but is we look bak, we can see a similar rise in Mid August that failed to continue.
However, It has room to move higher when ready, by a substantial margin.
The 4 Hour PA charts shows ua how the Bulls have been at work
PA continues to besandwiched between the 200 EMA and the 50.
If this pattern continues, we can expect to see PA rejected today by the 200 EMA and return to the 111200 area.
The 4 hour MACD
The Histogram shows us the hesitancy of PA. This is nit such a bad thing PA seems to be waiting, maybe for the FED on 17th.
I am not sure that PA can continue this long and I feel a reaction will be made prior to this date.
This may be a Dip lower, A LONG destroyer just before we see a move higher,, should the FED lower rates.
But trying to predict BTC Moves is foolhardy...............
Today will certainly give us an idea of future direction........

Bitcoin : Stay heavy on positionsBitcoin : Stay heavy on positions (2x~3x)
Maintaining the same outlook as before.
** This analysis is based solely on the quantification of crowd psychology.
It does not incorporate price action, trading volume, or macroeconomic indicators.

BTC/USDT 4H AnalysisBitcoin currently consolidating around the $110k region, sitting just above a major demand zone. Market structure is showing two possible scenarios:
🔹 Bullish Case: Price holds above the grey demand zone (RL) and pushes toward the mid-level ($118k). A clean break here could open the path toward $124k–$126k (RH).
🔹 Bearish Case: If the $110k–$109k support fails, BTC may revisit the blue demand zone around $102k–$100k before any recovery.
Key Levels to Watch:
Resistance: $118k / $124k
Support: $110k / $100k
⚠️ This is not financial advice. Always use proper risk management.
💬 What’s your outlook on BTC this week – bullish continuation or deeper correction?

Bitcoin: Edges HigherToday, Bitcoin is once again trading slightly higher than it was at the time of our update yesterday. As a result, it remains possible that price could soon make another move into the upper blue Target Zone ($117,553 – $130,891), so green wave B can form its final high. The subsequent wave C is then expected to drive BTC down significantly—ultimately completing the larger wave a and thus the first phase of the three-part wave (ii) correction in the lower blue zone ($62,395 – $51,323). Additionally, our alternative bullish scenario remains relevant. We currently estimate a 32% chance that Bitcoin is still advancing within blue wave alt.(i) and will climb into the orange alternative Target Zone ($148,363 – $168,443) to complete this move.

BTC Triangle Squeeze: Next Stop $116K?Bitcoin is currently consolidating inside a symmetrical triangle, a classic squeeze that often precedes a strong breakout 💥. Price is building pressure with higher lows and lower highs, waiting for confirmation.
✅ Bullish Confluences:
Price is respecting triangle support and holding the structure.
Fibonacci retracement shows potential upside continuation.
Momentum is shifting after a prolonged corrective move.
🎯 Fibonacci Upside Targets:
🌟38.2% – $112,876
🌟61.8% – $114,195
🌟100% – $116,329
⚠️ Invalidation / Stop-Loss Zone:
If price breaks below $107,000 – $105,000, the bullish setup is invalidated ❌.
As long as BTC stays inside the triangle and above key support, the squeeze favors a bullish breakout

Bitcoin All Time Highs Forecasted DateWas just working on a new study showing the number of months and days between prior ATH's for Bitcoin has typically been between 46-49 months or 1400 to 1492 days as shown in the Green boxes.
Based on the 2017 cycle, that puts this cycle ATH around November 1st 2025.
So we don't have much time if this cycle is going to play out like prior ones.
Also global liquidity is slowing down, and BTC is deviating from following M2 Money Supply.
However, the daily cycle low is signaling a local bottom is in here.
What do you think?

BTC - WEEKLY PRICE UPDATE🟩 #BITCOIN - Weekly Price Update
🔸 Monthly: Bullish, macro uptrend is intact! 📈
🔸 Weekly: Neutral zone between $116,000 - $110,700
Following my previous outlook and livestream, price tapped the $107,000 area as expected. ✅
Here’s what I’m watching: If CRYPTOCAP:BTC pushes and holds above $110,000 daily, we could see another wave up and potentially new ATHs, trend would stay strong!
Currently, the technical setup is bullish📈
→Daily lagging span still above the cloud and SSB
→D1 candle just closed inside the KUMO = classic bullish continuation signal!
💡 My expectations:
Short-term:
→If bulls defend $110,000+ = bullish zone, see a leg to $115,600 - $116,000 next!
→If we get a D1 close & breakout above $116,000, expect further upside toward $120K+ 🚀
→Breakdown under $107,000 = negative, could trigger deeper selloff.
📊Big picture:
Momentum remains solid above $100,000 and especially $94,000 support.
Expect some green days for #alts if we hold above level mentionned as well in the coming sessions!

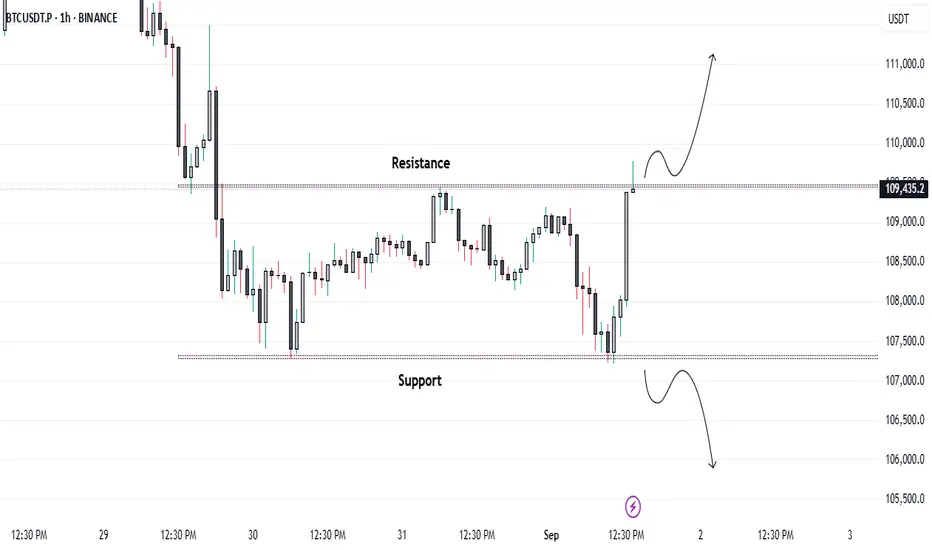
Bitcoin Breakout Watch: Key Levels Ahead...Bitcoin is consolidating in a tight range on the 1-hour timeframe and is showing strong momentum as it tests the $109,500 resistance zone. A decisive breakout and sustained close above this level could trigger a move toward the $112,000 mark, signaling bullish momentum building in the market.
Keep a close watch on volume confirmation for a stronger breakout signal. 📈
Why Bitcoin (BTC) Will Likely Fill the Downside Imbalance After Bitcoin just made a sharp move up, liquidating short positions across the board — but if you think the pump is here to stay, think again. Let’s break down why BTC may be headed right back down to fill the imbalance it just created.What we just witnessed was a classic liquidity grab. Retail traders piling in with shorts at the local highs created a liquidity pool — and smart money took advantage. The sudden push up wasn’t organic; it was engineered to stop out shorts, triggering a cascade of liquidations and buy stops.But here's the key: in doing so, BTC left behind a significant imbalance — or Fair Value Gap — to the downside. If you're not familiar, imbalances are areas on the chart where price moved too quickly in one direction, leaving low-volume zones with inefficient pricing. These gaps tend to get filled more often than not, because the market seeks equilibrium. After a liquidity grab, smart money usually has no reason to sustain the move immediately — instead, they want to mitigate risk. That often means bringing price back to re-test the origin of the move and fill in the inefficient price action — especially if there’s confluence with a previous demand zone or breaker block.Don’t get caught chasing the pump. Remember, smart money moves in layers — liquidity grabs, imbalance fills, and then continuation. Until that downside inefficiency is addressed, the move isn’t complete.

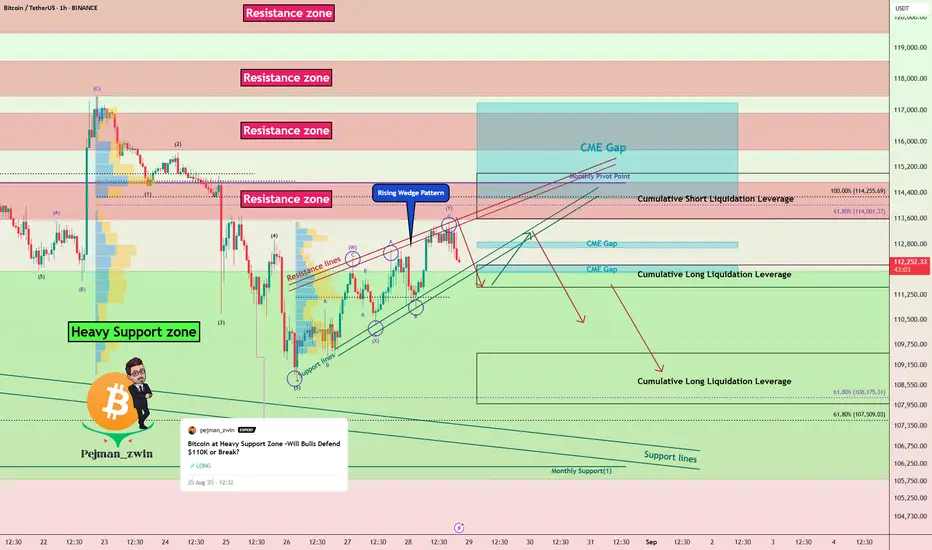
Bitcoin at Make-or-Break: Will BTC Fill the CME Gap?Bitcoin ( BINANCE:BTCUSDT ) increased to $113,500 as I expected in my previous idea .
Do you think Bitcoin can fill the upper CME Gap($117,235-$113,800) !?
Bitcoin is currently moving near the Resistance zone($114,720-$113,580) , Cumulative Short Liquidation Leverage($115,000-$113,588) , Resistance lines , and Monthly Pivot Point .
In terms of Elliott Wave theory , Bitcoin’s movement over the past 2 days has been in the form of corrective waves and has had low momentum . The corrective wave structure is a Double Three Correction(WXY) .
From a Classic Technical Analysis perspective, Bitcoin appears to be completing a Rising Wedge pattern .
I expect Bitcoin to move towards Cumulative Long Liquidation Leverage($109,500-$108,000) after volatile movements over the next two days .
CME Gap: $112,870-$112,700
CME Gap: $112,155-$111,940
Stop Loss(SL): $115,510(Worst)
Please respect each other's ideas and express them politely if you agree or disagree.
Bitcoin Analyze (BTCUSDT), 1-hour time frame.
Be sure to follow the updated ideas.
Do not forget to put a Stop loss for your positions (For every position you want to open).
Please follow your strategy and updates; this is just my Idea, and I will gladly see your ideas in this post.
Please do not forget the ✅' like '✅ button 🙏😊 & Share it with your friends; thanks, and Trade safe.
BITCOIN Bearish Breakout!
HI,Traders !
#BITCOIN made an epic
Bearish breakout of a very
Strong key horizontal level
Of 112340.5which is now a
Resistance and the breakout
Is confirmed so we are
Bearish biased and we will
Be expecting a further
Bearish move down !
Comment and subscribe to help us grow !

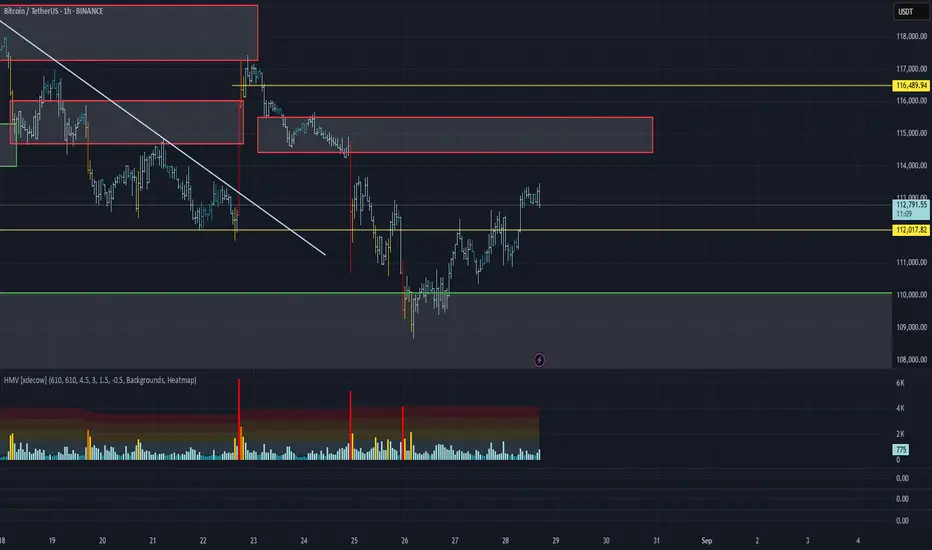
BTC/USDT Analysis. Continuation of the local uptrend
Hello everyone! This is CryptoRobotics trader-analyst with the daily market analysis.
Yesterday, the market followed our scenario, continuing the local uptrend and breaking the previous high. At the moment, there are no strong signs of profit-taking that could trigger a reversal, nor major resistance zones nearby. The main expectation remains further growth towards the $114,400–$115,500 (volume zone), where a reversal pattern may start to form.
For intraday traders, the key level to watch is around $112,000. An abnormally high volume cluster was recorded there, which positioned buyers earlier. If the price dips into this zone and shows a reaction, a local long setup may be considered.
Buy zones:
~$112,000 (local zone, abnormal cluster),
$110,000–$105,000 (accumulated volumes).
Sell zones:
$114,400–$115,500 (volume zone),
~$116,500 (volume anomaly),
$117,200–$119,000 (accumulated volumes),
$121,200–$122,200 (buying absorption).
This publication does not constitute financial advice.
Bitcoin buy Soon as soon possibleBitcoin buy Soon as soon possible
The live Bitcoin price today is $111497.14 USD with a 24-hour trading volume of $64109128491.21 USD. We update our BTC to USD price in real-time.
