BTC/USDT Analysis. Deeper Pullback Likely Before Further Growth
Hello everyone! CryptoRobotics trader-analyst here, and this is the daily market analysis.
Yesterday, as expected, Bitcoin performed a deeper test of the $87,800–$86,400 zone. At one point, the level was breached, volumes increased significantly, and positioning was mainly skewed toward selling pressure.
Today, price has returned back into this zone and we are seeing a reaction from a strong volume bar, highlighted in orange on the chart by the indicator. This indicates local absorption and consolidation, but without a clear dominance from buyers yet.
The primary expectation remains a continuation of the decline toward the key support zone at
$84,000–$82,000 (volume anomalies). This area may become a critical turning point capable of reversing the current bearish move.
An alternative scenario involves buyers re-entering the market from current levels within the now mirror zone at $87,800–$86,400. In this case, the upside potential would target the nearest local resistance.
Buy Zones
• $84,000–$82,000 (volume anomalies)
Sell Zones
• ~$90,300 (local sell zone)
• ~$92,400 (local sell zone)
• $92,000–$93,000 (local volume zone)
• $94,000–$97,500 (volume zone)
• $101,000–$104,000 (accumulated volume)
This publication is not financial advice.
Bitcoinlong

Bitcoin - Long idea1 target is $90,500.
2 target: $92,600
3 target: $94,000
4 target: $95,200
5 target: $96,000
Final target: $98,000.
After reaching the first target, I move the stop to break even.
BINANCE:BTCUSDT.P

BITCOIN FIB SUPPORT HIT .618 CROSSROAD the chart is my work in Bitcoin . We are now at a another crossroad it peaked in a triangle and now we have three wave down . This is Major support .I am now flat .Best trades WAVETIMER

BITCOIN - Time To Buy BTCUSD nowBITCOIN (BTC/USD) has recently been stuck inside a triangle channel pattern and has struggled to break out for a few weeks. However, the price has recently broken a strong resistance level (the white trend line shown on the chart) - The price is currently above the trend line which acted as a strong resistance level and is now very likely to hit the next resistance zone which is labeled as the take profit level. time to buy BTCUSD now!

Selena | BTCUSD – 2H | HTF Liquidity & Accumulation StructureBITSTAMP:BTCUSD
After a strong rejection from the top distribution zone, BTC entered a corrective phase. Sell-side liquidity has already been taken near the HTF demand, followed by gradual accumulation and higher lows. Price is currently reacting from a mid-range demand zone while targeting remaining buy-side liquidity above.
Key Scenarios
✅ Bullish Case 🚀
If price holds above the demand zone and maintains structure, continuation toward buy-side liquidity is expected.
🎯 Target 1: 92,000
🎯 Target 2: 95,000
🎯 Target 3: 98,000 – 99,000
❌ Bearish Case 📉
A clean breakdown and acceptance below the demand zone would invalidate the bullish structure and open downside continuation.
🎯 Downside Target 1: 84,000
🎯 Downside Target 2: 80,500 (HTF demand)
Current Levels to Watch
Resistance 🔴: 94,500 – 99,000
Support 🟢: 87,000 – 88,000
⚠️ Disclaimer: For educational purposes only. Not financial advice.

BTCUSDTHello Traders! 👋
What are your thoughts on BITCOIN?
Bitcoin is currently consolidating within a well-defined range between $88,000 and $95,000, while continuing to trade inside an ascending channel.
The lower boundary of this ascending channel aligns closely with the $88,000 support zone, adding confluence and strengthening this area as a key demand region. At the moment, price action is hovering near the channel support, suggesting that selling pressure is weakening.
As long as the price holds above the $88,000 support, we expect some short-term consolidation followed by a bullish push toward the upper range at $95,000.
A clean breakout above $95,000 could open the door for a continuation move toward the upper boundary of the ascending channel, which would act as the next upside target.
A sustained break below the channel support would invalidate this scenario.
Don’t forget to like and share your thoughts in the comments! ❤️

BTC/USD Liquidity Blueprint – Are You Reading the Flow Right?🎯 BTC/USD: The Great Heist Setup | Swing Trade Blueprint 💰
📊 Market Overview
Asset: BTC/USD (BITCOIN/US DOLLAR)
Market: Cryptocurrency
Trade Type: Swing Trade
Strategy Style: The Thief Method™ (Layered Entry System)
🎨 Technical Setup
📈 Market Structure: BULLISH CONFIRMED
The Simple Moving Average is showing strong accumulation patterns with a healthy pullback structure. Bulls are loading up their bags like thieves preparing for the ultimate vault heist! 🏃♂️💨
Key Technical Indicators:
✅ SMA showing strong bullish accumulation
✅ Pullback phase completed
✅ Higher lows formation intact
✅ Volume supporting upside momentum
🎯 The Heist Plan: Entry Strategy
💎 The Thief Layered Entry System
Instead of going all-in at one price (that's how amateurs get caught! 👮), we're using a professional layered approach with multiple buy limit orders:
Entry Layers:
🔹 Layer 1: $108,000
🔹 Layer 2: $109,000
🔹 Layer 3: $110,000
🔹 Layer 4: $111,000
🔹 Layer 5: $112,000
💡 Pro Tip: You can add more layers or adjust based on your bag size and risk appetite. The beauty of this strategy? You average into position like a pro! 🎭
🛡️ Risk Management
⛔ Stop Loss: $106,000
⚠️ Important Note: Dear Thief OG's (Ladies & Gentlemen),
This is MY stop loss based on MY risk tolerance. You're the captain of your own ship! 🚢 Set your SL according to YOUR risk management rules. Remember: Take profits at your own risk, protect capital like it's your treasure!
🎯 Target Zone: The Great Escape
🚨 Target: $124,000
Why this target?
The "Police Barricade" (strong resistance zone) sits right here with multiple confluence factors:
🔴 Major resistance level
🔴 Overbought conditions expected
🔴 Bull trap zone activated
🔴 Historical rejection area
🏃♂️ Exit Strategy: When we hit this zone, it's time to take your loot and run! Don't get greedy and caught in the trap!
⚠️ Important Note: Dear Thief OG's (Ladies & Gentlemen),
This is MY take profit target. You're free to take profits whenever YOU feel comfortable. Your money, your rules, your timeline! 💰
🔗 Correlated Pairs to Watch
Keep your eyes on these related assets for confirmation:
💱 Major Correlations:
BITSTAMP:ETHUSD - Typically follows BTC momentum; watch for similar accumulation
BINANCE:BTCUSDT - Alternative pairing for liquidity confirmation
TVC:DXY (US Dollar Index) - Inverse correlation; weakness in DXY = strength in BTC
$SPX/SPY (S&P 500) - Risk-on sentiment indicator
GOLD ( OANDA:XAUUSD ) - Alternative store of value; competitive correlation
📍 Key Correlation Points:
When DXY weakens, crypto typically strengthens
Traditional market risk-on flows support Bitcoin upside
ETH/BTC ratio helps confirm alt-season vs BTC dominance
Gold movements indicate macro hedging flows
⚙️ Why The Thief Strategy Works
✨ Dollar-Cost Averaging (DCA) on steroids
✨ Reduces emotional decision-making
✨ Better average entry price
✨ Lower risk per order
✨ Professional money management
Think like a thief planning the perfect heist: multiple entry points, calculated risks, clear escape route! 🎭
🎬 Final Thoughts
This isn't financial advice—it's a strategic blueprint for those who trade with discipline and style! The market is our playground, but only the smart thieves get to keep their loot. 🏆
Remember:
📊 Stick to your plan
🎯 Manage your risk
💰 Take profits systematically
🧠 Trade with logic, not emotion
🎭 Execute like a professional
📣 Support This Analysis
✨ If you find value in my analysis, a 👍 and 🚀 boost is much appreciated — it helps me share more setups with the community!
#Bitcoin #BTCUSD #CryptoTrading #SwingTrade #TradingStrategy #TechnicalAnalysis #CryptoAnalysis #BTC #LayeredEntry #RiskManagement #ThiefStrategy #CryptoSignals #BitcoinAnalysis #PriceAction #TradingSetup #CryptoTA #BTCSetup #SwingTrading
🎯 Stay sharp, trade smart, and may the profits be with you! 🚀

Breaking: Bitcoin Might Dip to $70k Support Point The price of Bitcoin is poised to dip to the $70k support to shake off weak hands before picking liquidity up albeit the market is generally bearish.
The $70k support is feasible or nearest support zone for bitcoin to consolidate before going back up. In similar context, as per data from crypto quant the open interest of Bitcoin on all exchanges is down 0.45% losing roughly $29 billion.
This data further solidifies our bearish thesis on $BTC.

BITCOIN - Buy BTCUSD nowBITCOIN (BTC/USD) has recently been stuck inside a triangle channel pattern and has struggled to break out for a few weeks. However, the price has recently broken a strong resistance level (the white trend line shown on the chart) - The price is currently above the trend line which acted as a strong resistance level and is now very likely to hit the next resistance zone which is labeled as the take profit level. buy BTCUSD now!

GET READY FOR BITCOIN HIGH PROBABILITY LONG SETUP SOON!!!🚨BTC HIGH PROBABILITY BUY SETUP 🚨
* Here We Can See Clearly The Next Potential Moves For BTCUSD Coming Hours/Days.
* Keep Your Eyes Close On Your Trading Positions.
* Happy PIP Hunting Traders.
FXKILLA.

BTC After the Flush: Building a Base Into 2026Bitcoin printed a clear correction from the 126,333 spot top into 80,625, a 36% retrace that finally reset an overheated trend. After that impulse down, price stopped bleeding and started building a base. That is the context for my long, not a breakout chase.
My first entry triggered at 85,000. If price sweeps lower, I will add, with my final planned entry sitting in the 72,000 to 70,000 region. The whole idea is simple: scale into higher time frame demand after a deep reset, then let the market do the work if it wants to rotate back into risk.
Technicals: on the daily, the selloff created an obvious “damage candle” sequence, followed by compression and range behavior. I am treating the 80K to 85K band as the core demand zone. The level that matters for confirmation is the recovery of the mid range resistance around 94,652, because a clean reclaim would shift the structure from “bounce” to “reversal attempt” and opens the door for a move back into the 100K area and, eventually, a retest of the prior ATH zone near 126K if momentum returns.
Fundamentals : the macro backdrop is supportive for risk if financial conditions keep easing. The Fed has already moved policy lower and continues to guide the market with forward projections, which is the type of environment that can reprice duration and high beta assets.  At the same time, institutional crypto flows have been rebuilding. CoinShares reported a rebound in digital asset ETP inflows with Bitcoin leading, and daily US spot Bitcoin ETF flow data has also shown positive net flows on recent sessions.  On derivatives, CME positioning and open interest remain a key dashboard for whether this base is being built with size behind it. 
Execution note: I am not trying to “be right” on the exact bottom. I am trying to be positioned where the risk is definable and the upside is asymmetric. If the narrative changes, I will adjust. If the market gives the move, I will pay myself and protect capital.
Note: Please remember to adjust this trade idea according to your individual trading conditions, including position size, broker-specific price variations, and any relevant external factors. Every trader’s situation is unique, so it’s crucial to tailor your approach to your own risk tolerance and market environment.

BITCOIN - Buy nowBITCOIN (BTC/USD) has recently been stuck inside a triangle channel pattern and has struggled to break out for a few weeks. However, the price has recently broken a strong resistance level (the white trend line shown on the chart) - The price is currently above the trend line which acted as a strong resistance level and is now very likely to hit the next resistance zone which is labeled as the take profit level. buy bitcoin!

BTC — My Plan: I am in the same position as in the previous reviBased on my previous idea, I am in a position with lower entry points. You can check my profile. I have already addressed part of it.
I expect something similar from BTC going forward. However, I do not rule out swings in different directions before the Fed. This is not financial advice, just my vision. Especially since I am in a position with lower entry points!

Selena | BTCUSD – Bullish Structure Holding Above TrendlineBITSTAMP:BTCUSD
Price continues to respect the ascending trend structure formed after the breakout from the descending channel.
The current pullback into 91,400–91,850 support aligns with rising trendline confluence, making this the critical continuation zone for the next bullish leg.
🔹 Bullish Setup
A confirmed rejection from support + breakout above 93,600–94,000 will open the next expansion leg.
🎯 TP1 → 94,800
🎯 TP2 → 95,600
🎯 Final Target → 96,300–96,800 liquidity zone
🔸 Invalidation
❌ Break & close below 91,300 weakens continuation potential.
Next demand is far lower — deeper retracement may unfold.
⚠️ Educational-analysis only — not financial advice.

Selena | BTC/USD – Trend Channel + Strong Demand ReactionBITSTAMP:BTCUSD
Bitcoin is trading inside a rising parallel channel, with price recently reacting cleanly from the strong demand zone at 90,200–90,700, aligning with channel support. Liquidity was taken below the lows, signalling possible continuation to the upside.
🔼 Bullish Scenario
If BTC holds above 90,200, we may see upside continuation:
🎯 Target 1 → 94,200 – BSL zone
🎯 Target 2 → 96,800 – 97,900 top resistance zone
🎯 Target 3 (Breakout case) → 98,500+
A sweep of intra-day liquidity followed by bullish BOS can provide confirmation.
🔽 Bearish Risk / Invalidation
Break & close below 89,900 could open deeper flow into liquidity below:
⚠️ Downside levels → 88,000 → 86,500 → 81,000 support base
⚠️ This chart is for educational purposes only — not financial advice.

Bitcoin Price Prediction: Recovery To $100,000 Could Be Tainted Bitcoin’s price is at $90,399 at the time of writing, sitting just below a downtrend that has persisted for one and a half months. BTC is attempting to flip $90,400 into a support level, which would mark the first step toward reversing the trend.
If macro conditions align and rate cuts revive broader market optimism, BTC could rebound sharply. A clean bounce from $90,400 may drive a retest of $95,000, and breaking that resistance would open a clear path toward the long-anticipated $100,000 level.
However, if short-term holders sell into strength, Bitcoin may struggle to maintain upward pressure. A rejection from $95,000 or failure to break the downtrend could send BTC back toward $86,822, invalidating the bullish scenario.

BITCOIN - Time to buyBITCOIN (BTC/USD) has recently been stuck inside a triangle channel pattern and has struggled to break out for a few weeks. However, the price has recently broken a strong resistance level (the white trend line shown on the chart) - The price is currently above the trend line which acted as a strong resistance level and is now very likely to hit the next resistance zone which is labeled as the take profit level. Time to buy bitcoin!

Analytics: market overview and forecasts
WHAT HAPPENED?
Last week, for bitcoin, we reached the upper limit of a significant support zone and almost immediately received a powerful boost. This led to a change in the local trend to an upward one.
As part of the growth, the resistance of $94,000-$97,500 (volume zone) was reached, from which the correction began. Now we've pushed off from the support of $87,800-$86,400 (volume zone) and maintain the upward context.
WHAT WILL HAPPEN: OR NOT?
The movement potential is aimed at updating the local maximum. To fully reverse the trend, the buyer needs to demonstrate more strength.
The $94,000-$97,500 zone remains relevant, as a significant part of it hasn't been tested. The implementation of a positive scenario is possible both through a confident breakdown of this range, and through the formation of a weak correction in terms of volume and price action.
A negative factor for the development of the long rally this week is the selling pressure on the spot market, as seen by the cumulative delta. The situation is better in futures, but the market needs more "fuel" for a final turnaround.
Alternative scenario: with a strong defense of the nearest resistance, a sideways trend may form in the range of $84,000-$94,000.
Buy Zones
$87,800–$86,400 (volume zone)
$84,000–$82,000 (volume anomalies)
Sell Zones
$94,000–$97,500 (volume zone)
$101,000–$104,000 (accumulated volumes)
$105,800–$106,600 (local resistance)
IMPORTANT DATES
We're following these macroeconomic developments this week:
• Tuesday, December 9, 15:00 (UTC) — publication of the number of open vacancies in the labor market (JOLTS) USA for October;
• Wednesday, December 10, 2:45 (UTC) — announcement of Canada's interest rate decision;
• Wednesday, December 10, 19:00 (UTC) — US FOMC statement and economic forecasts, as well as the announcement of the US Federal Reserve interest rate decision;
• Wednesday, December 10, 19:30 (UTC) — US FOMC press Conference;
• Thursday, December 11, 9:00 (UTC) — press conference of the National Bank of Switzerland;
• Thursday, December 11, 13:30 (UTC) — publication of the number of initial applications for unemployment benefits in the United States for the week;
Friday, December 12, 7:00 (UTC) — publication of the UK GDP for October, as well as the German consumer price index for November.
*This post is not a financial recommendation. Make decisions based on your own experience.
#analytics

Bitcoin Roadmap | Short-termBitcoin( BINANCE:BTCUSDT ) began to decline from the resistance zone($95,020-$94,840) exactly as expected in my previous idea , successfully reaching all targets.
At the moment, Bitcoin was able to break the support zone($90,650-$90,000). It seems that the pullback to the broken support zone($90,650-$90,000) could be completed with a symmetrical triangle pattern, although given the low trading volume on Saturday and Sunday, this triangle may not function properly.
In terms of Elliott Wave theory, Bitcoin appears to be completing the microwave C of the main wave B, and I expect at least one more impulsive 5-wave move to the upside.
I expect Bitcoin to start rising from the support zone($89,230-$88,000) or the Potential Reversal Zone(PRZ) maximum. A break of the resistance lines could be a good sign for Bitcoin to rise again.
What do you think? Do you believe Bitcoin will dip below $75,000, or will it bounce back?
Cumulative Short Liquidation Leverage: $98,260-$96,690
Cumulative Short Liquidation Leverage: $90,560-$89,990
Cumulative Long Liquidation Leverage: $87,820-$87,290
Cumulative Long Liquidation Leverage: $83,900-$82,400
First Target: $89,911
Second Target: $92,119
Stop Loss(SL): $86,120(Worst)
Points may shift as the market evolves
💡 Please respect each other's opinions and express agreement or disagreement politely.
📌Bitcoin Analysis (BTCUSDT), 1-hour time frame.
🛑 Always set a Stop Loss(SL) for every position you open.
✅ This is just my idea; I’d love to see your thoughts too!
🔥 If you find it helpful, please BOOST this post and share it with your friends.

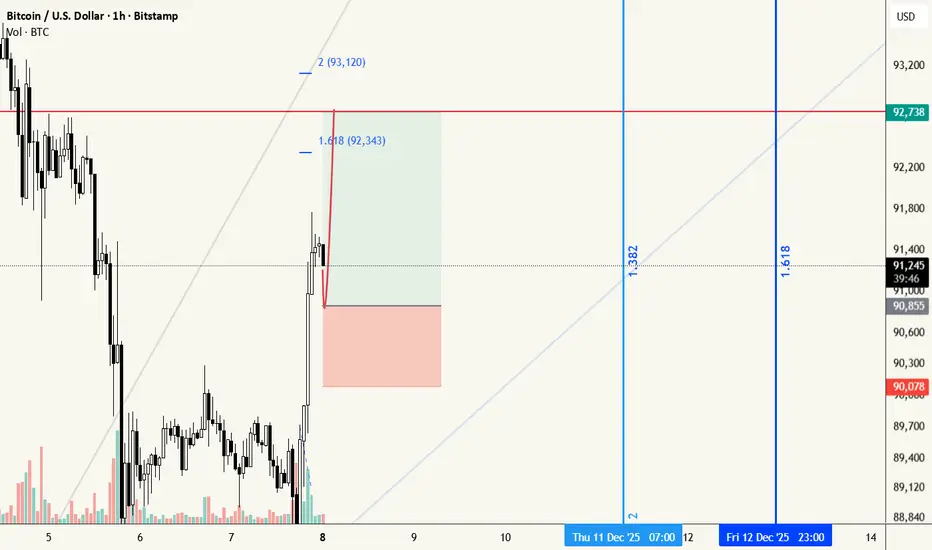
scalp long for bitcoina scalp setup for long in BTCUSDT.
entery : 90850
SL: 90000
TP : 92400 92700 93000
Always DYOR.
GET READY FOR BITCOIN COMING BULL HIGH PROBABILITY SETUP SOON!!!🚨 BITCOIN HIGH PROBABILITY BUY SETUP 🚨
* Here We Can See Clearly The Next Potential Moves For BTCUSD Coming Hours/Days.
* Keep Your Eyes Close On Your Trading Positions.
* Happy PIP Hunting Traders.
FXKILLA.

Bitcoin Momentum Building — Bullish Plan Activated!BTC/USDT — “BITCOIN VS TETHER”
Crypto Market Opportunity Blueprint (DAY / SWING Trade) 💹✨
🔥 Plan: Bullish plan confirmed
The structure is supported by a Hull Moving Average (HMA) pullback, behaving like a clean re-accumulation phase — showing buyers quietly loading before the next expansion wave.
This pattern typically appears before trend continuation legs, especially when volatility compresses after a strong impulse.
🎯 Entry
📌 YOU CAN ENTRY AT ANY PRICE LEVEL
(Structure shows strength across multiple levels with buyers defending dips.)
🛡️ Stop Loss
⚠️ This is thief SL @ 86000
Dear Ladies & Gentleman (Thief OG's), adjust your SL based on your own strategy & personal risk tolerance.
🔍 Important:
I am not recommending to use only my SL.
It's your own choice — you can make money then take money based on your own risk.
🎯 Target
Price is moving into a zone where the moving averages act as a strong resistance, combined with overbought conditions and potential trap formation, so escaping with profits is wise.
📌 Our target @ 98000
Again — Dear Ladies & Gentleman (Thief OG's):
I am not recommending to set only my TP.
You can make money then take money at your own risk.
📡 Related Pairs to Watch (Correlations & Key Behaviors)
Below are correlated assets that help confirm BTC/USDT’s flow, momentum, and broader crypto market direction. These are presented in $ format for TradingView tagging.
1️⃣ BINANCE:ETHUSDT (Ethereum)
Strongest beta-pair to Bitcoin.
When BTC shows re-accumulation, ETH often leads the breakout earlier.
If ETH breaks major resistance first → increases confidence in BTC continuation.
2️⃣ BINANCE:SOLUSDT (Solana)
High-momentum asset; reacts faster than BTC.
If SOL pumps aggressively while BTC consolidates → indicates risk-on sentiment across crypto.
Good for measuring market confidence.
3️⃣ BINANCE:BNBUSDT (BNB)
Acts as a market stability indicator.
If BNB stays firm above key moving averages, liquidity remains strong across the crypto market.
Helps confirm medium-term bullish structure.
4️⃣ BINANCE:ETHBTC (Ethereum / Bitcoin Ratio)
A critical relative-strength indicator.
If ETHBTC drops → capital rotates into BTC dominance, supporting your Bitcoin bullish plan.
If ETHBTC rises → broad alts strength, but BTC may not accelerate instantly.
5️⃣ CRYPTOCAP:TOTAL2 (Altcoin Market Cap)
When TOTAL2 rises with BTC → marketwide confidence.
When TOTAL2 stagnates but BTC rises → BTC-only rally (typical before big breakouts).
Useful to detect inflow distribution.
6️⃣ TVC:DXY (US Dollar Index)
Inverse correlation with Bitcoin.
If DXY weakens → supports BTC bullish continuation.
Important for swing traders taking multi-day positions.
7️⃣ CRYPTOCAP:USDT.D (Tether Dominance)
When USDT.D drops → money flowing from stablecoins into crypto.
When USDT.D rises → risk aversion.
Perfect tool for confirming if BTC demand is real.
📈 Summary Insight
Together, BTC’s HMA pullback + re-accumulation structure, rising momentum across correlated pairs, and declining defensive indicators build a high-probability bullish continuation environment for the next expansion wave.

BTCUSD Technical Analysis (30m)This post provides an analytical breakdown of BTCUSD using the 30-minute timeframe (30m), leveraging our proprietary technical indicator: the Trend Break Target (TBT) Indicator.
Market Structure Shift and Indicator Activation
The current analysis focuses on a significant change in the market structure observed on the 30m chart. The TBT indicator was programmed to detect and react to specific conditions that signify a high-probability continuation or reversal.
Activation Signal: The indicator was activated and the price targets were subsequently generated following the closing of the specific candle indicated by the arrow on the chart. This close confirmed the necessary structural change (e.g., a break of resistance/support, or a specific pattern completion) required by the TBT's underlying logic. This market structure shift (MSS) provides the foundation for the calculated price objectives.
Calculated Price Targets (TBT Forecast)
Based on the activation of the Trend Break Target Indicator, the following potential price objectives have been calculated. These targets represent areas where price action is statistically likely to find resistance, profit-taking activity, or a high-probability exhaustion point for the current move.
🎯 Target 1 (T1): $90,400
Significance: This is the immediate and most probable objective, often representing a minimum measured move following the structure break.
🎯 Target 2 (T2): $91,450
Significance: A secondary, extended target that comes into play if bullish momentum persists and T1 is cleanly surpassed and held.
🎯 Target 3 (T3): $92,709
Significance: The final, ambitious target representing the full potential move calculated by the TBT model based on the initial structure shift. It acts as the high-end projection for the current impulsive wave.
Disclaimer
Note: This analysis is based on a proprietary indicator and should be used for informational and educational purposes only. Always manage your risk effectively, use appropriate stop-loss orders, and conduct your own due diligence before making any trading decisions. The crypto market is highly volatile, and actual price action may deviate from projected targets.
