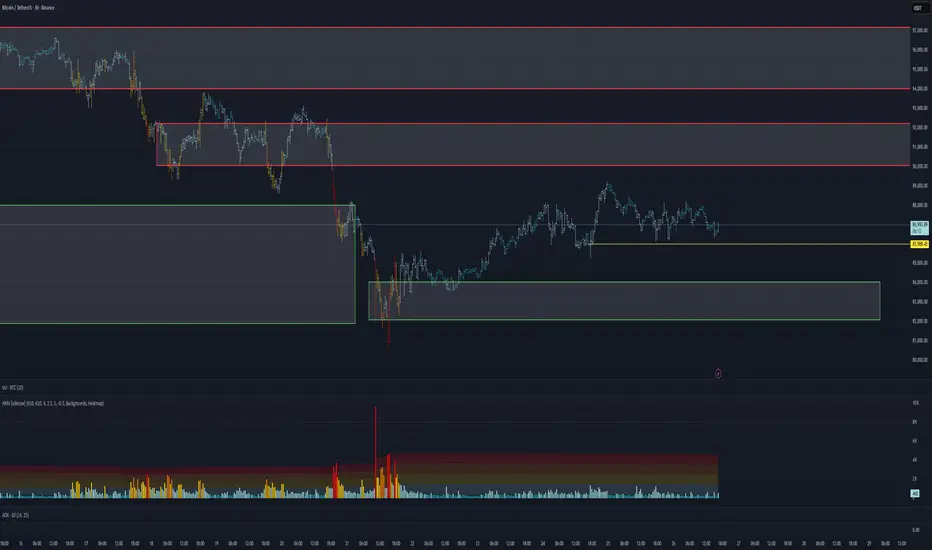
Bitcoin (BTCUSDT) Technical Analysis – December 5, 2025Strong downside momentum is currently dominating on the lower timeframes. Bitcoin has once again dropped below the $90k mark.
This entire drop from the ATH (~125,769) fits beautifully into the classic Fibonacci retracement structure — price got rejected right at the 0.618 level (94,657), and despite a temporary bounce off the 0.5 retracement (99,980), bulls lacked the strength to push further. Currently, we’re trading below the 0.382 level (88,799), which is now acting as resistance — and it’s no coincidence that price today has been struggling exactly at that zone.
In addition, today’s move has perfectly filled the Fair Value Gap (FVG) from April 22, which is now completely closed. That gap also lines up with the 0.382 level of the local (smaller) Fibonacci retracement.
At the local bottom (around 83,500), we saw a classic swing low with a long lower wick, followed by a bullish candle — this is forming the early signs of a bullish engulfing pattern. Volume-wise, that candle printed a significant spike, showing strong buyer interest. Looking at cumulative volume, it’s clear that there was a notable absorption of sell pressure by larger players in that zone.
If bulls fail to reclaim the 88,800 level, a retest of the 0.886 Fibo (82,929) is likely, or even a deeper drop toward the 1.272 and 1.414 Fibonacci extensions (77,012 and 74,058). Just below that, we have a strong demand zone around 72,000–74,000, which overlaps with previous consolidations and historical FVGs.
What’s Next? 🙄😎
The current move looks like a potential end to the corrective wave, with a local bottom near 83,500, key support at 82,900, and resistance at 88,800. If price can break above that and close a daily candle higher, then 94–96k is back on the table. On the flip side, if the red descending channel holds, we could see further liquidation sweeps down toward 74–77k.
Volume signals and oscillator momentum are starting to flash a bullish bias, but bears still have the upper hand until the 0.5 Fibonacci level (99,980) is broken and the descending channel is invalidated with a proper close above it.
For now, all eyes on how price reacts around 88,800 and 92,000 — those are the key breakout levels that could confirm a larger trend reversal.
Bitcoinlong

BITCOIN — THE MARKET IS APPROACHING ITS REAL DECISION POINTTraders,
We dumped. Now Bitcoin is grinding through a controlled recovery. The important question is not simply if we move higher. The real question is where the market will reveal its true intention. The chart is giving us a very clean map and the next major decision point is already forming.
1. The structure so far
Bitcoin sold off aggressively, found real buyers, and reclaimed the breakdown wick. That reclaim shows that the low was bought by spot demand rather than mechanical short covering.
Price is now pushing into a zone where the next expansion will be decided. The recovery itself is not the interesting part. The levels above and below are.
2. The major checkpoint above: 104k to 105k
This zone is extremely important. Two strong pieces of confluence meet here:
The 0.886 of the A to B retracement
The 1.618 extension of the impulse move you marked with the arrows
This creates a clean Potential Reversal Zone.
What this means:
If the market rejects 104k to 105k structurally, the next major destination becomes the lower imbalance cluster around 64k. That would be a true higher timeframe unwind because the entire path down is filled with thin volume and inefficient price action.
If Bitcoin breaks above 105k with flow support, then the next magnets open up immediately.
3. Targets above
If price accepts above the 104k to 105k PRZ:
First target area
Around 116k to 118k where we have a liquidity pocket and HTF inefficiencies.
Second target area
123k to 125k where a swing failure pattern is very likely. This is a weak high with resting liquidity and a natural magnet for price during bullish expansions.
At target two I expect the first serious reaction because of the liquidity sitting above the weak high.
4. Order flow confirms accumulation not distribution
Looking at the CVD grids:
Spot CVD is trending lower while price holds steady. This is a sign of absorption because someone is taking the other side of the selling.
Stablecoin margined CVD continues lower but without price following.
Coin margined CVD is sweeping lows with no breakdown in price.
This creates a hidden bullish divergence across the board.
Open interest also supports this view:
Stablecoin margined OI remains high which means traders did not exit during the dump.
Coin margined OI is slowly building which often appears before directional expansion.
This is not the profile of a market preparing for distribution. It is the profile of a market preparing for a move.
5. CME chart: AVWAP support from the last major swing
On CME, the AVWAP anchored from the previous major swing low to swing high is still holding as support. CME often leads during inflection zones. As long as this AVWAP holds, the market is positioned in a continuation PRZ rather than a breakdown PRZ.
If CME loses this AVWAP, the cascade scenario strengthens. As long as it holds, the bullish structure remains intact.
6. What happens if we break down instead
if Bitcoin fails to reclaim structure and breaks back down, the following levels become active:
83k to 84k
This is the shallow retrace zone and the first structural catch.
81k to 82k
This area contains the 1.113 extension and a previously unfilled FVG.
79k to 80k
This is the 1.272 level and a strong imbalance pocket.
72k to 73k
This contains the 1.414 extension and the next clean liquidity cluster.
64k
This is the 1.618 extension and the final major downside target. It aligns with the strong HTF imbalance that has never been fully tested.
A rejection from 104k to 105k can eventually lead price through these levels in sequence because the entire zone from 90k down to 70k contains thin volume. There is not much structural support built on the way up.
7. Real time confirmation tools
Watch these signals when we approach the 104k to 105k decision zone:
Spot CVD rising means continuation likelihood increases
Funding staying negative means shorts are still stuck
OI rising with price means momentum is building
CVD stalling or rolling over at 104k to 105k means rejection risk is high
CME AVWAP reclaim or failure will guide direction
If buyers hold flow above 105k, the path to 117k and then 124k is clean.
If buyers fail and we reject 105k with aggressive selling, the path down becomes active.
Final view
Bitcoin is approaching one of the most important technical levels on the chart.
We dumped on real flow.
We recovered on spot demand.
Now the market is converging toward the 104k to 105k PRZ where a true decision will be made.
Break above and the next magnets are 117k and 124k with a likely swing failure at the second target.
Reject and the lower zones activate with 64k as the eventual HTF destination.
This is the map. The levels are clear.
TLDR
BTC is recovering with spot support
104k to 105k is the major PRZ
Break above: targets at 116k to 118k and 123k to 125k
Reject here: downside levels at 83k, 82k, 80k, 73k and 64k
Order flow is showing hidden bullish divergence
CME AVWAP is holding which keeps the bullish narrative alive
The market leaves its footprints long before it shows its direction. Read the sands, follow the flow and stay prepared.
- ThetaNomad
----------------------------------------------
If you enjoy this style of analysis feel free to leave a like or comment. It lets me know you find value in these deeper structural and flow based breakdowns.
----------------------------------------------

BTC/USDT Analysis. Moving Within the Expected Scenario
Hello everyone! CryptoRobotics trader-analyst here, and this is your daily analysis.
Yesterday, Bitcoin continued its correction after reaching the key resistance zone.
The price has now approached $91,000–$89,800 (mirror volume zone). Volume has slightly increased at this level, but we still do not see a confident reaction from buyers.
We expect a local bounce and a potential break of the recent high once a reversal structure forms on lower timeframes — volume anomalies, buyer clusters, and a local trend shift.
If no reaction appears in this area, the decline may extend toward the next support at $87,800–$86,400 (volume zone).
At the moment, the priority remains on long setups — the upside potential is stronger, and the probability of bullish continuation remains elevated.
Buy Zones
$91,000–$89,800 (mirror volume zone)
$87,800–$86,400 (volume zone)
$84,000–$82,000 (volume anomalies)
Sell Zones
$94,000–$97,500 (volume zone)
$101,000–$104,000 (accumulated volumes)
$105,800–$106,600 (local resistance)
This publication is not financial advice.

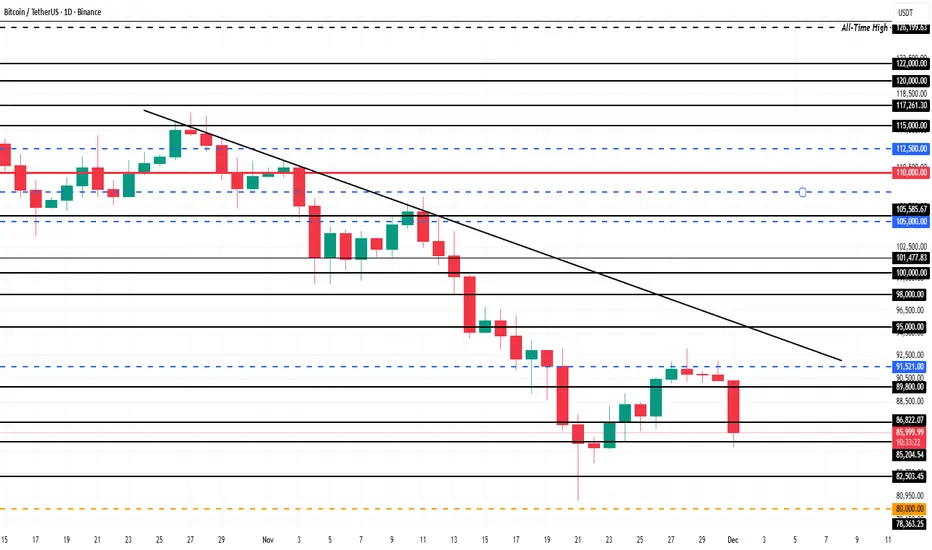
Will Bitcoin Price Under $95,000 Benefit From $2 Billion BuyingBitcoin is trading at $92,047, holding above the critical $91,521 support level while remaining trapped under the month-long downtrend. Recovering from this position requires a decisive breakout, which has yet to materialize despite recent attempts.
Invalidating the downtrend demands a flip of $95,000 into support. Given the ongoing accumulation and tightening exchange supply, such a move remains possible. Additional support from institutional buyers would further strengthen Bitcoin’s path toward $100,000, restoring bullish momentum.
If large holders remain sidelined, Bitcoin may continue to struggle. A failure to sustain support could send BTC back below $89,800 and toward $86,822. This would reinforcing bearish sentiment and delaying recovery attempts.

BTC/USD (Bitcoin) LONG SET UPEntry Price 1: $89,500
Entry Price 2: $85,500
Stop Loss: $79,500
Take Profit 1: $94,500(Close 25%)
Take Profit 2: $99,500 (Close 50%)
Take Profit 3: $105,500 (Close 75%)
Take Profit 4: $110,500 (Close 100%)
Status: ACTIVE

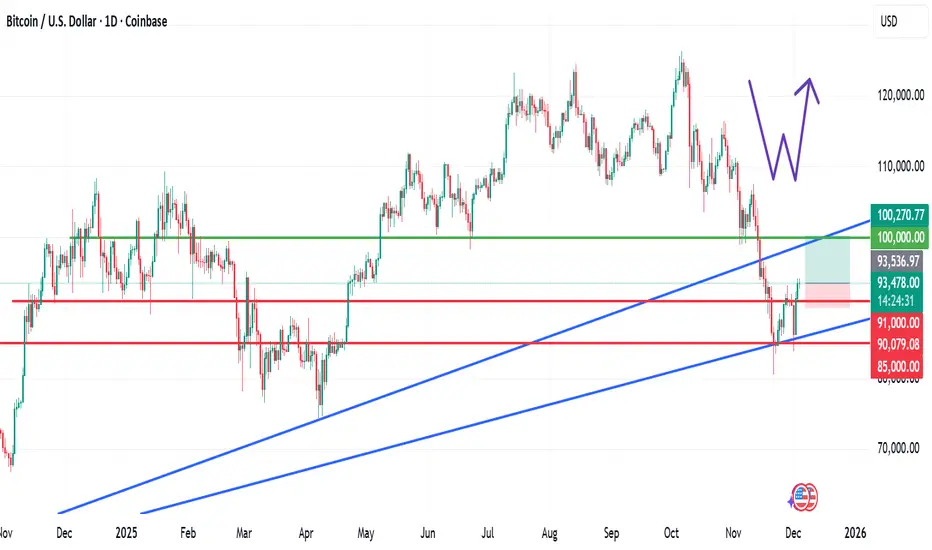
Bitcoin and the Double Bottom Reversal PatternBitcoin and the Double Bottom Reversal Pattern: Is This a Key Turning Point?
Following the previously outlined technical levels that played out successfully, Bitcoin has now formed a double bottom (W) reversal pattern, a widely recognised signal in technical analysis indicating potential bullish momentum.
Price action has also broken above the $91,000 level, which previously served as resistance and aligns with the neckline of the pattern.
A sustained hold above this zone may confirm the reversal structure and support further upside movement.
If the $91,000 support level remains intact, the next logical target based on pattern projection is the $100,000 zone and potentially beyond, depending on market sentiment and volume continuation.
Trade Plan
Entry 1: Current market price (aggressive positioning)
Entry 2: $92,000
Take Profit: $100,000 and above
Stop Loss: $89,900
Ensure your risk management remains balanced and aligned with your strategy.
If you found this analysis useful, feel free to like, share, and drop a comment below.
I am looking forward to engaging with you here on TradingView.
BitcoinBTCUSD
- Completed " 12345 " Impulsive Waves
- RSI - Divergence
- Change of Characteristics
- Fair Value Gap
- Order Block

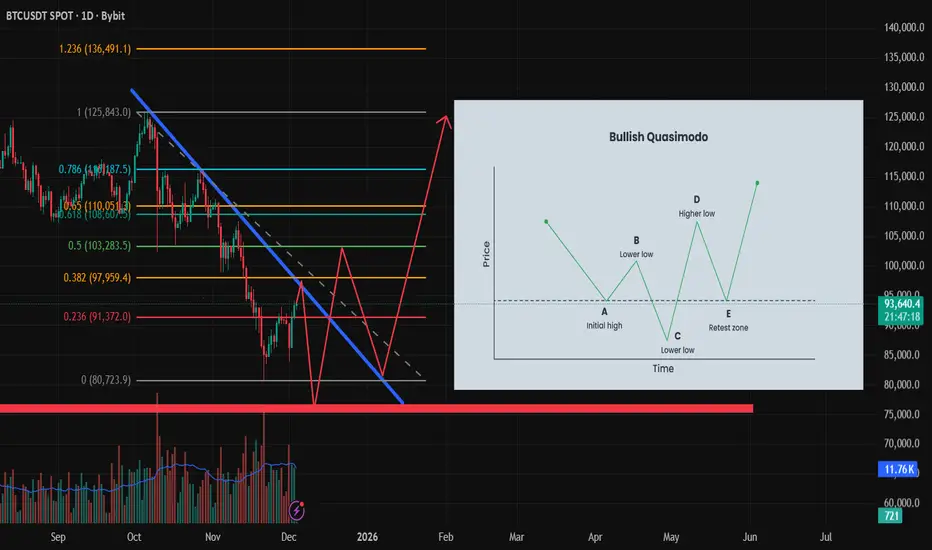
BTC Bullish Quasimodo Forming? Potential Reversal Setup 80k–125kBitcoin continues to trade below the macro descending trendline, respecting lower highs since the last major swing high. Price is currently around the 93k area, reacting to a minor resistance + Fibonacci cluster.
🔍 Why a Bullish Quasimodo Is Possible
A Bullish QM (Quasimodo) pattern forms when the market creates:
Initial High
Lower High
Lower Low (liquidity sweep)
Higher Low (retest zone)
Break of Structure to the upside
BTC appears to have formed steps 1 and 2, and may be setting up for a deeper sweep to complete the Lower Low around the major demand zone.
🧭 Projected Price Path
Short-term expectation (bearish liquidity sweep):
Possible rejection from the descending trendline
Decline toward 91,300 → 88k → 86k
Final liquidity sweep into ~80k, which aligns with a major demand zone and previous volume imbalance
Mid-term expectation (bullish reversal):
Strong bounce from the 80k zone
Formation of the Higher Low (QM retest zone)
Break above the descending trendline
Upside targets:
97,900
103,200
108,000
125,000+ (Fibonacci extension target)
🎯 Bias Summary
Short-term: Neutral to bearish (liquidity sweep expected)
Mid-term: Bullish reversal if QM structure completes and price forms a Higher Low
⚠️ Invalidation
A clean daily close below 78,500 invalidates the Bullish QM scenario.
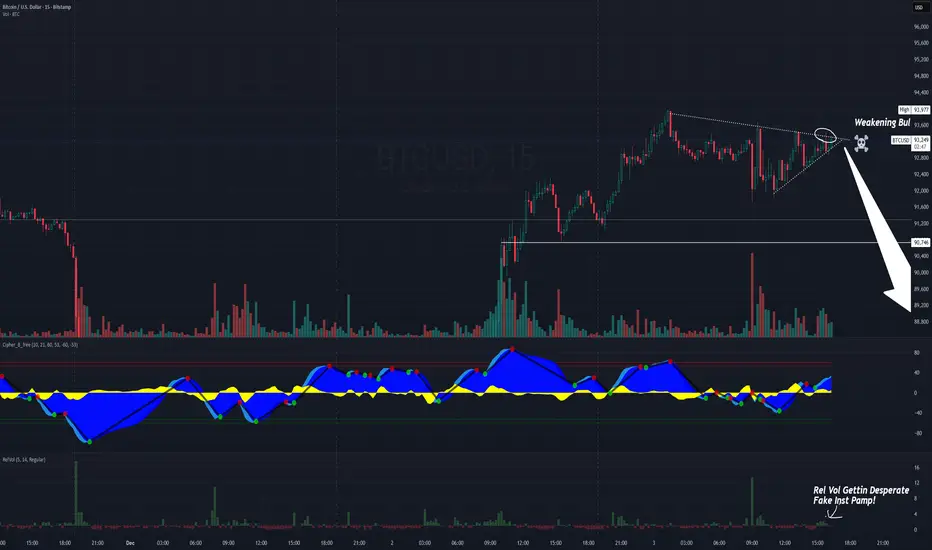
The Bitcoin Meteorite and MSTR falling knifeThe US Trading session just ended and handed Asia a Bitcoin Meteorite. If there's one thing Asia hates - it's fake pumps...and that's all today was on BTC. We'll be lucky if BTC is over $90k when the US market opens tomorrow on 12/4.
Asian session behavior is predictable:
They love to liquidate overleveraged U.S. breakout traders
They fade fake pumps
They push price back toward equilibrium
At the very least we pull back to $92, and while I think $91k is more likely and even $90 isn't out of the question. The other concern is all the benevolent articles coming out about BTC. Larry Fink said bitcoin is the new bellbottoms...or whatever. When they flood the market with bogus 'opinion' pieces, these people only speak because they want to influence retail traders. You really think the CEO of black rock wants to drive the price of BTC UP before they expand their holdings... If they're talking about something...they're selling you a bridge. I think BTC and it's biggest holding company MSTR (which managed to buy only 130 Bitcoins this cycle (BWHAHAHA) is going to crash even harder than it has been. $1.4B in cash reserves to fund $773+ Million in annual dividends while diluting shares is a recipe for bankruptcy and a $.01 share price...
Shorting BTC and MSTR all week long and twice on Sunday.
Bitcoin's Next Move: What 4 Timeframes Reveal Right NowWeekly
A sustained move through the key resistance on this timeframe at105,000 to 110,000, could confirm a reversal. For now, the weekly outlook shows a potential market in correction rather than reversal.
Daily
After dropping nearly 5% yesterday, Bitcoin has rebounded sharply today with a gain of about 6.7%. The price is currently up $5775 at $92,060. Today’s low at $86,190 followed yesterday’s deeper dip to $83,814. The daily chart may suggest further upside potential.
4H
Momentum on RSI has turned higher on the 4-hour chart, lifting from oversold conditions and breaking back above the midline. This suggests improving intraday demand and provides a base for further upside if price continues to hold above the recent breakout level. The next resistance sits around 96,500, the prior swing high on this timeframe.
1H
The hourly timeframe shows the price bouncing back above the 50, 100 and 200-hour moving averages, which are currently clustered around $87,500 and $89,320. If the price stays above these converged moving averages, it can signal continued buying pressure in the near term.

BITCOIN GET READY FOR MASSIVE HIGH PROBABILITY BULL MOVE SOON!!!🚨 BITCOIN HIGH PROBABILITY BUY SETUP 🚨
* Here We Can See Clearly The Next Potential Moves For BTCUSD Coming Hours/Days.
* Keep Your Eyes Close On Your Trading Positions.
* Happy PIP Hunting Traders.
FXKILLA.

Bitcoin Price Falls To $86,000; Will It Shake Out Weak Hands?Bitcoin is trading at $86,005, holding just above the $85,204 support level. The asset remains trapped under a persistent downtrend that has lasted more than a month. This would preventing any sustained recovery attempts.
If market conditions worsen or short-term holder selling accelerates, Bitcoin could break below $85,204. A drop through this support would expose the price to $82,503 and potentially deepen losses as fear rises across the market.
However, if buyers step in and support strengthens, Bitcoin could reclaim upward momentum. A bounce from current levels could send BTC toward $89,800. A decisive move above that resistance would be essential for Bitcoin to retest $90,000 and invalidate the bearish thesis.
BTC Dip Resilience: A Healthy Pullback Inside Structure - Dec 1 BTC is dipping again today, but the price action remains orderly and far from bearish breakdown territory. Despite the volatility, BTC continues to hold above the previous cluster of local lows, preserving its higher timeframe structure. More importantly, price is still sitting comfortably within a key support band that has acted as a demand pocket throughout this entire consolidation phase.
The market has not shown any signs of structural damage. Sellers pushed into support, but so far there has been no follow-through or momentum shift that would indicate trend exhaustion. Instead, the reaction looks controlled, with buyers stepping in each time price revisits this region. This kind of behavior usually reflects absorption rather than weakness.
In the bigger picture, this is the type of pullback you expect during a mid-cycle correction: sharp enough to unsettle sentiment, yet technically intact and anchored by strong underlying demand. Until we see a break beneath those prior lows, the path of least resistance remains upward.
Overall, the chart still leans bullish. The current dip is behaving like a constructive reset, not the start of a deeper unwind.

Wave 4 Trap Complete as Bitcoin Prepares for Final Flush6 Days Ago:
3 Days Ago:
1 December 2025
BTC moved into the expected corrective zone last week but stayed inside the falling channel, showing that wave 4 was only a temporary bounce. Buyers failed to break any key resistance, and momentum kept fading. This kept the broader outlook bearish and hinted that wave 5 was still pending.
BTC has now broken below the short-term rising structure, confirming that wave 4 topped out near the 0.786 retracement. The rejection from that zone triggered a clean shift back into the main downtrend, with price sliding toward the key 86,280 support. As long as BTC holds below the upper channel boundary, the market remains positioned for further downside, with the 1.618 extension around 79,650 emerging as the next probable target for wave 5 completion.
Note:
The rejection from the 0.786–resistance zone shows buyers failed to take control.
Wave B at 86,280 is the immediate pivot level; staying below it keeps downside pressure intact.
The next major target for wave 5 sits near the 1.618 extension around 79,650.

BTCUSD 4H Bullish setupBitcoin is showing a strong bullish structure on the 4H chart.
Price is currently holding above the EMA ribbon and rejecting the lower band with clear buying pressure — a typical sign of continuation after a corrective pullback.
🔶 Bullish Confluences
Price holding above dynamic support (EMA cloud turning green).
Higher-low formation after the recent sell-off, signaling buyers stepping in.
Fibonacci channel support respected, with price bouncing from the midline.
Strong candle reaction from the 0.382 retracement zone, often a bullish continuation level.
Upside liquidity sitting above 93.3k and 95.5k, attractive magnet for price.
🎯 Fibonacci Extension Targets
TP1 – 38.20%: ~93,525
TP2 – 61.80%: ~94,876
TP3 – 100%: ~97,063
If momentum increases, price could push toward the 100k zone again, with extended targets beyond.

BTC/USDT Analysis. Local Structure Favors Buyers
Hello everyone! CryptoRobotics trader-analyst here with the daily market breakdown.
Yesterday, Bitcoin continued rotating inside the resistance zone at $90,000–$92,300.
Locally, there is a strong probability of a breakout above this range, followed by a move toward the next resistance at $94,000–$97,500 (volume zone). This is supported by the absence of aggressive selling pressure and the way volume is distributed inside the consolidation.
The $90,000 level remains a key pivot point. We still allow for a retest of this level before buyers attempt another upward move.
On a larger scale, once price reaches the next sell zone, we expect a deeper correction to form.
Buy Zones
$90,000 (cluster anomalies)
$88,000–$86,000 (local volume zone)
$84,000–$82,000 (volume anomalies)
Sell Zones
$94,000–$97,500 (volume zone)
$101,000–$104,000 (accumulated volumes)
$105,800–$106,600 (local resistance)
This publication is not financial advice.

Bitcoin Long OpportunityBitcoin 👀
After a clear liquidity sweep, price reacted with a bullish expansion, showing that early buyers have stepped in with conviction.
My primary focus is on the buy-side liquidity resting below.
I anticipate a liquidity grab into that area and will look to execute from the M15 unfilled imbalance beneath current price.
On the HTF, we have a strong DOL, supported by an unfilled H1 SIBI, which remains a key objective. 🎯
Also, we have a OTE level of a previous range that aligns with our entry POI - unfilled M15 FVG.
I will consider taking partial profits into the H1 SIBI zone 💰
📉

BTC/USDT Analysis. Sell-Side Absorption in Play
Hello everyone! CryptoRobotics trader-analyst here, and this is your daily market update.
Yesterday Bitcoin followed our long scenario — the move started earlier than expected, without a liquidity grab, as market buyers stepped in aggressively. As of now, price has reached the first resistance at $90,000–$92,300 (volume zone).
In this area, delta has spiked sharply, indicating “high-level buying,” which has already triggered a local correction.
The key pivot level now is $90,000 — it may work as support, but if price settles below it, the level becomes resistance.
If price breaks the local high → expect a test of the upper selling zone and a deeper correction afterwards.
If price breaks and holds below $90,000 → the downside target becomes the anomaly zone at $84,000–$82,000.
Buy Zones
$88,000–$86,000 (local volume zone)
$84,000–$82,000 (volume anomalies)
Sell Zones
$90,000–$92,300 (volume zone)
$94,000–$97,500 (volume zone)
$101,000–$104,000 (accumulated volumes)
$105,800–$106,600 (local resistance)
This publication is not financial advice.

mrmoney limited BITCOIN trading ideabitcoin is in a strong bullish momentum since it tapped into our monthly demand zone giving us a overall bullish moves

BTC/USDT Analysis. Local Long Setup
Hello everyone! CryptoRobotics trader-analyst here, and this is your daily market update.
Since yesterday, Bitcoin has failed to break above the $88,000 level mentioned in the previous analysis, resulting in continued consolidation within a narrow range.
When analyzing this local range, we see dominant selling pressure on cumulative delta, but it has not produced any meaningful downside result — sellers are active, yet unable to push the price lower. Additionally, a notable delta anomaly has formed around $86,000, suggesting the presence of a limit buyer.
A local long setup becomes valid if liquidity is swept below the local lows followed by a test of $86,000, with a stop-loss below $85,200. The upside potential is attractive — the next resistance zone we highlighted earlier becomes the primary target.
If no reaction appears at $86,000 and buyers fail to step in, we expect further downside movement toward a stronger support zone below.
Buying Zones:
• $86,000 (local selling absorption)
• $84,000–$82,000 (volume anomalies)
Selling Zones:
• $90,000–$92,300 (high-volume zone)
• $94,000–$97,500 (high-volume zone)
• $101,000–$104,000 (accumulated volume)
• $105,800–$106,600 (local resistance)
This publication is not financial advice.
Bitcoin retracement bullish setup Price is showing early signs of a potential bullish reversal after sweeping liquidity at the recent lows and forming a short-term base.
✔ Bullish Confluences
Price holding above lower volatility bands, showing reduced sell pressure and potential accumulation.
Higher-low structure forming after the liquidity sweep, indicating a shift in short-term momentum.
Attempt to reclaim mid-channel EMA zones, suggesting buyers are stepping in.
Green momentum signals aligning with stabilized candle structure.
🎯 Fibonacci Extension Targets
If price confirms a breakout and holds above the local EMAs, here are the next upside targets:
38.2% – 85,900
61.8% – 86,950
100% – 88,000
A confirmed break above the 38.2% level opens the path toward 87k+ and the full 100% extension.
A clean break and retest above the 38.2% level would strengthen the bullish case toward the higher targets.

Bitcoin (BTC/USD) 3-Hour Chart - August 2025: Price breaks resistance at $121,919, targeting $128,311 (TP2) with support at $112,856 (Snipe). Key levels include TP1 at $121,919 and SL/TP at $117,107."

What to expect from BTC?BTC took liquidity from April, tested the lower boundary of the ascending channel, and immediately bounced. Historically, such touchdowns have triggered growth cycles.
A head and shoulders formation is more likely. A triple top is less likely. These structures allow shorts to accumulate liquidity at the $100,000 and $110,000 levels.
Wave theory also fits: a rebound from the lower boundary could form an A-B wave into the right shoulder area, which coincides with the length of the bullish flag pole.
