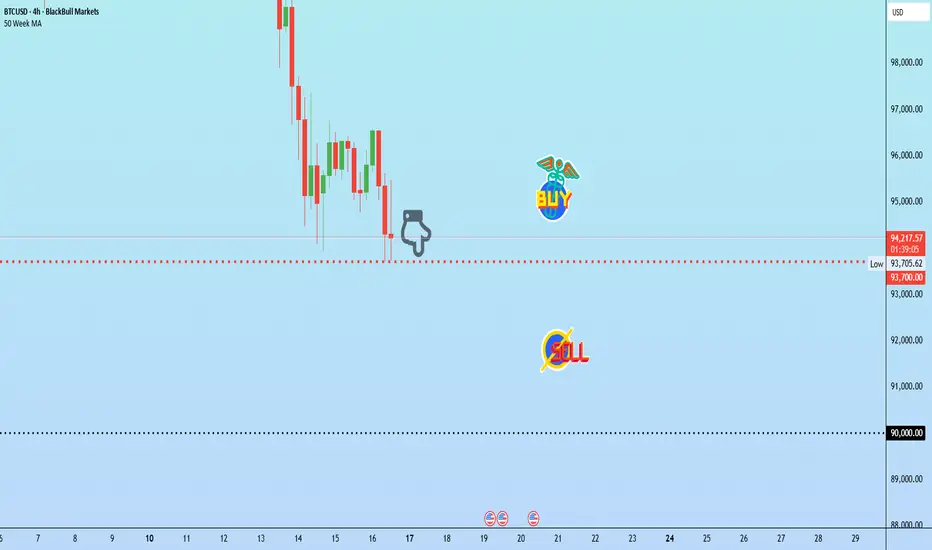
BTC hitting the Monthly 20EMA supportBTC has touched the Monthly 20EMA (overlayed on this 4H chart) on a huge sell off, should make a strong bounce here or it's off to the pits of hell going into December.
Bitcoinlong

Bitcoin approaching major buying opportunity of the year!Here we go are you ready for another major buying opportunity in bitcoin! Key levels to watch for. Ignore the fud!

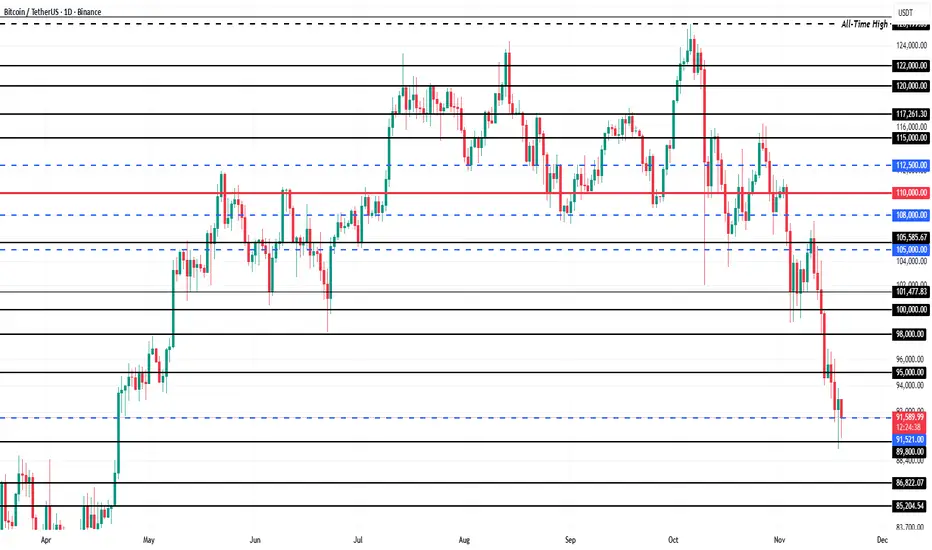
Bitcoin’s Price at $90,000 Is Signaling a Bottom Formation
Bitcoin trades at $90,331 and holds above the $89,800 support level, which has become a key buffer during the decline. The recent drop to a multi-month low has increased caution, but technical and behavioral signals suggest downside pressure is easing.
Based on investor support and historical patterns, a deeper drop appears unlikely. A bounce from $89,800 could push BTC back toward $95,000 as confidence improves. Strengthening demand and exchange outflows reinforce the possibility of a recovery in the near term.
If bullish momentum fades and broader weakness intensifies, Bitcoin could slip below $89,800 and fall toward $86,822. Such a decline would invalidate the current bullish thesis and signal a deeper retracement.
Crypto Market Alert: New York Session Breakdown Asset: Bitcoin (BTC/USD)
Strategy: Quantum Pulse AI (Fibonacci Focus)
Session: New York Open
Date: November 18, 2025
🧠 Executive Summary
The Quantum Pulse AI algorithm has triggered a BUY signal for Bitcoin during the New York session. Despite neutral readings on traditional lagging indicators (MACD and RSI), our proprietary model is detecting an imminent volatility expansion. The price action suggests a "coiled spring" consolidation phase, often a precursor to a sharp breakout.
Current sentiment is reacting to shifting risk parameters in the broader market, positioning BTC as a high-beta asset for the session.
🎯 The Trade Setup
We are looking for a continuation of the bullish structure, targeting liquidity above the recent consolidation range.
Direction: 🟢 BUY (Long)
Entry Price: $92,332.82
Take Profit: $94,553.09
Stop Loss: $90,852.64
Risk Analysis
Risk per Unit: ~$1,480.18
Reward per Unit: ~$2,220.27
Risk-to-Reward Ratio: 1:1.5
Insight: For every $1.00 risked, the trade targets $1.50 in profit. This is a solid, probability-based setup suitable for intraday volatility.
📊 Technical Deep Dive
Why "Neutral" Indicators Matter Here
You might notice the standard indicators are flat:
RSI (14): 50.0 (Dead Neutral)
MACD: 0.0 (Flatline)
Analysis: In the Quantum Pulse strategy, a "flatline" on the MACD combined with an RSI of 50 is not a sign of inactivity—it is a sign of equilibrium. The market has priced in recent moves and is awaiting a catalyst. The "Pulse" algorithm detects that order flow is building up pressure at the pivot points (support/resistance), suggesting that the next move will likely be explosive rather than gradual.
Key Levels
Resistance: The target of $94,553 aligns closely with the recent weekly high structure. A break above here opens the door to $95k+.
Support: The stop loss at $90,852 is placed strategically below the daily pivot area to prevent a "whipsaw" stop-out.
🌍 Fundamental Context
The analysis flags "Heightened Volatility" driven by risk sentiment shifts.
As traditional markets (S&P 500, Nasdaq) open in New York, liquidity flows often spill over into crypto. The trade rationale anticipates that risk-on sentiment will favor Bitcoin as a hedge against currency debasement or simply as a momentum vehicle for the day.
🛡️ Trade Management Plan
Entry: Execute at market or limit at $92,332.
Mid-Trade Adjustment: If price reaches $93,500 (approx. 50% to target), consider moving Stop Loss to Breakeven ($92,332) to secure a "risk-free" trade.
Exit: Hard exit at $94,553. Do not hold through the session close if the target is not met, as swap fees and Asian session volatility may alter the landscape.
Disclaimer: This analysis relies on algorithmic projection and fallback strategies (Fibonacci Retracement). Cryptocurrency trading involves extreme volatility. Never trade with capital you cannot afford to lose.

BTCUSD – Summary of the Higher-Timeframe Buy ScenarioBitcoin has already printed a major Break of Structure (BOS) to the upside, establishing a long-term bullish trend. The current sell-off is a corrective leg, unwinding inefficiencies created during the prior expansion phase.
Price is now gravitating toward a key daily demand zone, which is the origin of the BOS and the zone that previously launched the strong bullish impulse. This area remains unmitigated and holds institutional order-flow significance.
If price retraces into this zone, a reaction is highly probable. The expectation is for consolidation, a shift in short-term structure, and then a new bullish leg that continues the higher-timeframe trend—targeting new highs once the market rebalances.
This setup frames the demand zone as the strategic value area for long-term buyers, aligning with structural bias and discounted pricing.

BTC to fire up!Looking at the structure, it seems like selling is over and we are about to turn around. This is potential bottom for BTC.

BITCOIN : First Drop Then Shoot Up To $150,000Overview🧠
Bitcoin is in a bearish trend since it reversed from our previous trading zone. We expect the price to continue declining between 60,000 and 70,000. This is a suitable time to consider buying Bitcoin. Once the trade is activated, there are three potential targets: 90,000, 120,000 and 150,000.
Please use appropriate risk management when trading Bitcoin as it is a more volatile asset.
We wish you the best of luck.
Team Setupsfx_❤️🏆

Analytics: Market Outlook and Forecasts
📈 WHAT HAPPENED?
Last week, Bitcoin reached key resistance in the $105,800-$107,400 range, from which we expected a correction. If the seller showed weakness, it would be profitable to open long positions. However, there was no noticeable protection from the buyer, and the price decreased.
We’re currently at the lower boundary of the important medium-term support zone of $97,000-$93,000 (volume zone). The selling pressure is still high, but it’s not resulting in any significant movement. There is a lack of updates within the zone, and the angle of attack has decreased, while the volumes have increased. There are limit buyers present, but their activity is insufficient to indicate strength.
💼 WHAT WILL HAPPEN: OR NOT?
The medium-term market structure appears to be short-term. But the global picture still allows for a confident resumption — it just takes time.
We can expect a long exit from the current zone when a clear setup is formed. However, another decline wave is inevitable, as there is a strong volume zone above, which should be worked out under the current structure.
In a negative scenario, if there is no buyer interest, the decline will continue until the next global support.
Buy Zones
$97,000–$93,000 (high-volume zone)
$88,000–$82,000 (high-volume zone)
Sell Zones
$101,000–$104,000 (accumulated volumes)
$105,800–$106,600 (local resistance)
$109,500–$110,700 (accumulated volumes)
$112,400–$113,300 (accumulated volumes)
$114,700–$115,700 (accumulated volumes)
$120,900–$124,000 (high-volume zone)
📰 IMPORTANT DATES
Macroeconomic events this week:
• November 19, Wednesday, 7:00 (UTC) — publication of the UK Consumer Price Index for October;
• November 19, Wednesday, 10:00 (UTC) — publication of the Eurozone Consumer Price Index for October;
• November 19, Wednesday, 19:00 (UTC) — publication of the minutes of the US FOMC meeting;
• November 20, Thursday, 13:30 (UTC) — publication of the average hourly wage for September, the number of initial unemployment claims, the change in the number of non-agricultural workers for September, the unemployment rate in the United States for September, and the Philadelphia Fed's Manufacturing Activity Index for November;
• November 20, Thursday, 15:00 (UTC) — publication of data on second-hand housing sales in the United States for October;
• November 21, Friday, 14:45 (UTC) — publication of the US manufacturing and services business activity index for November.
*This post is not financial recommendation. Make decisions based on your own experience.
#analytics
BTC TO $150KWith liquidity being broken, we can finally see sellers getting more strength. I expect price to still fall further before a new leg of bulls comes into position

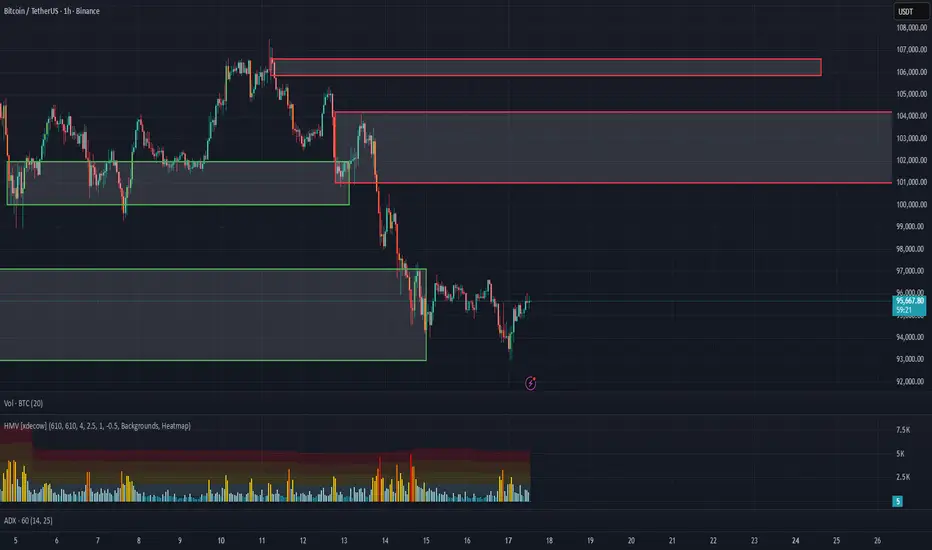
BTC needs to hold this level or risk a slide toward 90K?Bitcoin is at a crucial juncture. This week’s move could possibly prove vital for the cryptos forecast leading into Christmas.
Bitcoin has extended losses for a 4th session, now trading less than $95K. 93,700 dollars is possibly the most immediate support on the chart.
For any recovery to gain traction, price might need to reclaim 101,150 dollars and establish higher lows above it.
Perhaps the most important fundamental issue pressuring BTCUSD are the remarks from Fed officials questioning whether a December rate cut is warranted. Adding to the downside, Japan Exchange Group has apparently paused the listing of three crypto treasury firms while it reviews new compliance and disclosure rules. Japan remains the largest market in Asia for listed Bitcoin treasury firms, with fourteen companies currently holding BTC.
Bitcoin: Liquidity CycleTypical liquidity cycle is 5-6 years long (65m). Buy bitcoin before an upswing (or end of QT) and sell when liquidity tightens. Macro is the best way to analyze markets?
Adjust your stakes based on position of the cycle.
Markets can have risk-on, risk-off episodes. Where Bitcoin is a risk-on asset.
Use 10Y-02Y for guidance.

BTC temporary moving upHey guys,
I think btc will bounce from this support line that hasn't been tested yet.
Target 1: 107,400
Target 2: 110,700
Target 3: 116,300
Lets see where btc will be ending up at.

Bitcoin LONG OpportunityBitcoin Potential Long
Recently, we observed a liquidity sweep targeting key swing points, including the Previous Day’s Low (PDL), which represents sell-side liquidity within the previously established range.
Going forward, I anticipate that price may continue to draw toward liquidity levels below the current range , specifically the Previous Week’s Low (PWL) and an unfilled imbalance within the Monthly Fair Value Gap (FVG).
Should price reach this zone, I will be closely monitoring market structure and lower-timeframe price action for signs of a potential reversal or long setup from that area towards Buyside Liquidity.

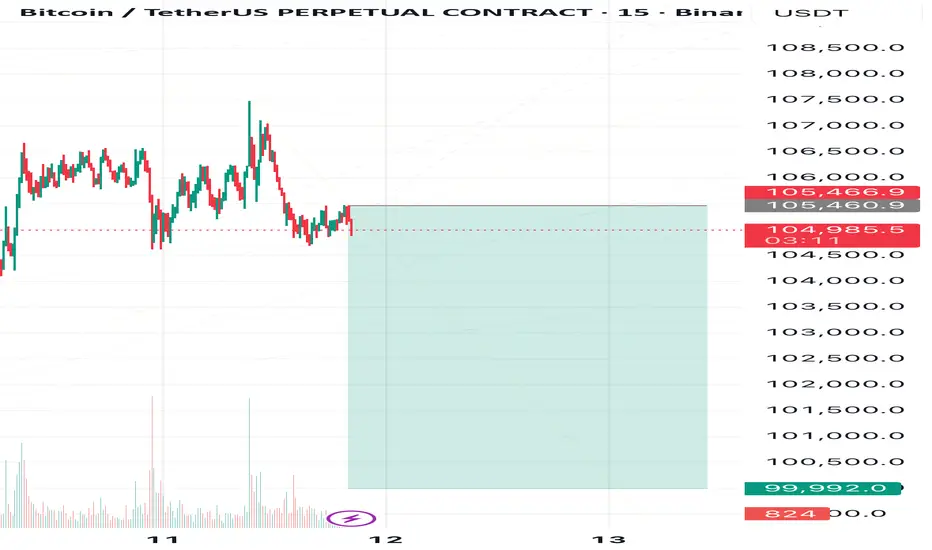
Bitcoin’s Slide to the 100K SideI expect Bitcoin to decline toward 99,999🎯
❌Invalidation Zone: above 105,565.
⚠️This is not a signal — make your own decisions and always trade with stop-losses!)
What’s your view on this setup?
💭Share your thoughts in the comments and follow to stay tuned for what’s next!
BITCOIN TO $130,000 - $140,000Hello! It's me again!
My friends, it seems that BTC's price action is clearly indicating its trend and direction. Of the last five candles on the weekly chart, four have shown a very clear indication: there are buyers on the downside, it has remained above the 55-week moving average, and we've seen very strong support around $103,000.
It's also true that the uptrend on the weekly chart is already quite worn out. It has been quite long and has remained solid until now; however, this could be the bullish move that ends the trend.
At the moment, the technical analysis is simple and very clear: we are within the lower range of an upward move (I bought at $109,900 six weeks ago and I plan to hold since the movement is clear).
In conclusion, Bitcoin will be looking for the $130,000 range and, at most, $140,000. The final upward move is about to begin.
See you later! And remember, this isn't advice, it's just an opinion.

BTC/USDT Analysis. Probability of a New Growth Phase
Hello everyone! This is CryptoRobotics trader-analyst, and here’s your daily analysis.
Yesterday, Bitcoin fell below the previously mentioned delta anomaly zone around ~$104,500. At the local support near ~$103,300, the price paused, consolidated briefly, and bounced upward. Yesterday’s anomaly failed to produce a strong pivot, indicating seller weakness.
Today, the same anomaly zone was retested, but no selling continuation followed.
Based on current volume distribution and delta, long positions have greater potential. We’re watching for buying opportunities from the $104,700–$104,100 range, which now acts as a mirror support zone.
If BTC breaks through the $105,800–$106,600 resistance area, the next upside target lies near $110,000.
Buy zones:
$104,700–$104,100 (mirror zone)
~$103,300 (accumulated volumes)
$102,000–$100,000 (volume anomalies)
$97,000–$93,000 (volume cluster)
Sell zones:
$109,500–$110,700 (accumulated volumes)
$112,400–$113,300 (accumulated volumes)
$114,700–$115,700 (accumulated volumes)
$120,900–$124,000 (high-volume zone)
This publication is not financial advice.

BTC Bitcoin Bullish Price Action Here's My Trade PlanBTC just broke to the upside! 💥 On the 🕓 4-hour timeframe, price action looks strong: higher highs and higher lows 📈⬆️. I’m waiting for a pullback 📉—once support is found 🛑 and structure breaks bullish again, I’m considering another buy opportunity 🚀💸.
Not financial advice.

TIME TO LONG BITCOIN (READ BELOW) Hey traders!
Here again. Since my last analysis a lot of things happened in $BTC. I've been shorting Bitcoin since 110 - 115K as you saw on my last analysis and now I think it's time to shift to a more bullish idea.
The last tho months were tricky. USA shutdown, liquidity contraction.. all the indicators led me to the bearish way. I'm not gonna lie, I thought all those liquidity tensions could blow up the entire markets on a mid term ( 1 - 5 months).
However, since the government is about to reopen again ( liquidity incoming) and the REPO MARKET seems to be healed from those FED massive injections, I decided to take the risk and try to profit from a bullish momentum.
What am I expecting?
One of my first targets are 110K on short term ( incoming days). Then I will close 10 - 20 % of my longs. After that, if martkets allows, another 30% will be closed above 116k level. The rest... ATH?
1st target - > 110K
2nd - > 116K
3rd -> ATH
Don't overtrade and staf saye. Momentum could shift anytime soon.

Bitcoin price forecast, short-term BTC chart analysisResistance line: Represented by a red diagonal line indicating a downtrend, suggesting that the price may struggle to break above this level.
Support line: A green horizontal line at the bottom of the chart, marking the support area where a recent W pattern formed, currently around 99K.
CME gap: Highlighted in yellow at the center of the chart, representing a short-term resistance area.
Parallel channel: Formed by two gray diagonal lines, illustrating the range within which the price is likely to move.
POC (Point of Control) line: A red line cutting across the center of the chart, representing the price level with the highest trading volume. Currently around 110,000 USDT, it can serve as a key support or resistance level.
Liquidity zone: The area where the POC line near 110,000 USDT overlaps with the upper boundary of the parallel channel, indicating a zone of highest expected liquidity. This is where short stop losses and long take profits are likely to cluster.
Predicted path: Shown in green, suggesting the price may bounce off the support line, rise along the parallel channel, break through the CME gap, and move toward the liquidity zone. If it breaks the red resistance line, the ascent toward the liquidity zone could accelerate.
Conclusion: Bitcoin is expected to gradually rise as it overcomes resistance levels, ultimately reaching the high-liquidity zone around 110K–112K. This analysis is based on current market conditions, and actual price movements may differ due to various market factors.

BTC 4H Bullish setupBitcoin is showing early signs of a potential reversal after testing key support levels within the descending channel. Price action is consolidating around $102.2K, with several bullish confluences hinting at a possible bounce.
🔍 Bullish Confluences
Channel Support Retest – Price is reacting off the lower boundary of the descending channel, historically a bounce zone.
Volatility Band Support – Candles are forming near the green lower band, signaling potential exhaustion of selling pressure.
Momentum Divergence Potential – Market structure suggests a possible bullish divergence forming, supporting a short-term recovery move.
🎯 Fibonacci Targets
38.2%: $103,850
61.8%: $104,308
100%: $106,286
A clean break above $103.8K could confirm bullish momentum and open room toward the $106K resistance zone.

Bitcoin: Not Dead Yet - Altseason Incoming...All In Before the Explosion: Bitcoin’s Next Leg and the Incoming Altseason Wave
Once again I'm ALL IN on IG:BITCOIN and a few selected ALTS.
Bull market NOT over.
🔥Altseason hasn’t even started warming up and this is not hopium ...
Here’s the raw macro truth the chart is yelling:
INDEX:BTCUSD is sitting cleanly inside the macro demand zone
Still riding the ascending channel that has carried every major leg of this cycle
No top. No breakdown. No weakness.
This is positioning , not exhaustion.
⏱ Cycle Structure:
• Each expansion leg: 14–15 weeks 📈
• Each correction: 16–18 weeks 📉
We’re exiting the correction window (ends Nov 10th🗓️)→ entering the next expansion phase.
📊 What the chart confirms:
• Long-term channel from Jan 2024 still intact → trend pointing to six figures.
• Weekly demand zone acting as controlled re-accumulation , not distribution.
• Clear trigger: break above $126K → macro ignition.
• Weekly RSI sitting on base support ⚫ → same level that preceded every major leg up.
• High-timeframe target for this cycle still $150K–$170K →parabolic to 220k+ 🎯
• Volume profile shows accumulation not distribution 🎯
📝 Scenarios:
1️⃣ Direct Blast-Off 🚀
Demand zone holds → $126K break → new ATH → trend accelerates into $160K–$170K.
2️⃣ Manipulation Flush 🩸
Wick below demand(flash crash to $90k) → mid-channel tap → violent reclaim → same final target.
❌ Invalidation:
Only a weekly close below the channel kills the structure.
Nothing else matters.
✅ Bottom Line:
This bull market isn’t cooling, it’s reloading .
Bitcoin is gearing for its next expansion wave, and alts will follow with the delayed, violent, inevitable altseason.
This next leg is where generational entries pay off or get regretted.
My stake is on IG:BITCOIN where is yours?

PATTERN logic + MACD LOWS/POTENCIAL = High probabilities.If you combine basic FACTORS of Patterns + MACD (weaknesses or Lows/Highs) you get pretty straightforward probability.
Weekly MACD above zero (and daily macd above zero) mean strong impulse, trend. But sometimes deep corrections in negative territory (bears) are not negative, because every chart pattern require strong "push" to break the pattern. I think you can see if there's smoke, in advance.
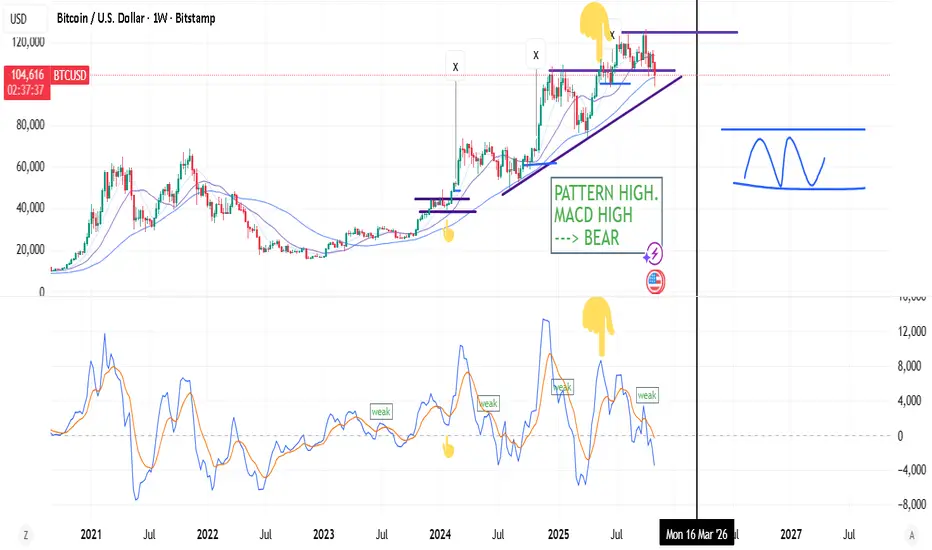
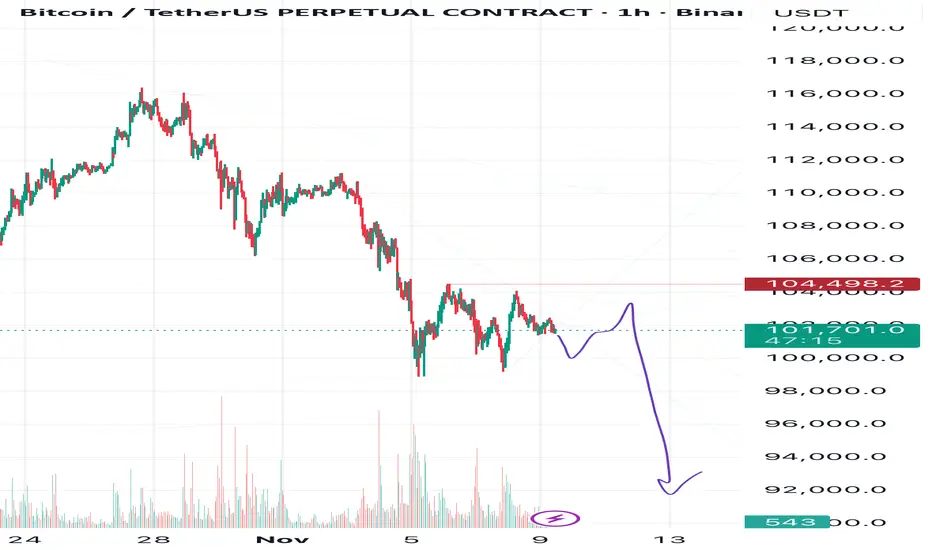
Bitcoin Daily View — Triangle in Play, Bears May StayIn my view, Bitcoin is currently forming a corrective triangle (ABCDE), and the breakout seems more likely to occur to the downside.
🎯 Targets:
• 1️⃣ 98,000
• 2️⃣ 94,000
• 3️⃣ 92,000
❌ Invalidation Level: 104,500
In my previous posts, I mentioned that I expect Bitcoin to eventually reach 83,000, but for now, I’m setting my target at 92,000, as I don’t think it will drop that far immediately.
⚠️Disclaimer: This is just my personal market view, not financial advice. Always trade with stop-losses!
💬 Share your thoughts in the comments and follow for upcoming Bitcoin updates!