BTC's situation+next targets and expected movementsBitcoin, as you can see, is within a descending wedge. If it breaks down, the price could drop below $100k, but we should wait for the breakout confirmation.
Bitcoinlong

BTC/USDT Analysis. Will longs resume pt.2?
Hello everyone! This is CryptoRobotics trader-analyst, and here’s the daily market overview.
Yesterday, our main scenario on Bitcoin played out — the price dropped to the buying zone at $120,400–$119,400 (selling absorption) and showed an initial reaction.
At the moment, there’s abnormal activity from a limit buyer, who continues to absorb most of the market selling. However, market buyers are not yet taking initiative, keeping the market in an accumulation phase.
We expect a retest of $120,600 (local buyer aggression) or a sweep of the local low. If a strong reaction appears, long positions with a favorable risk-to-reward ratio can be considered.
It’s quite possible that from this level we’ll see a renewed wave of buying and a move toward the all-time high.
Buy zones:
$120,600 (local buyer aggression)
$116,700–$115,000 (pushing volumes, strong graphical imbalance)
$112,500–$111,500 (mirror zone, volume anomalies)
$110,000–$108,800 (strong selling absorption)
This publication is not financial advice.

Bitcoin Bullish Scenario: Bitcoin Bullish Scenario:
*Expecting price to retrace to 50% of current daily trend range and bounce back to may another All time High.
*Purple area is Support for current bullish trend.

Bitcoin - The path remains clearly bullish!💰Bitcoin ( CRYPTO:BTCUSD ) remains bullish either way:
🔎Analysis summary:
For the past 1.000 days, Bitcoin has simply been heading higher. Considering that the previous bullruns lasted about 800 days, Bitcoin is ready for a correction. But market structure tells us, that Bitcoin remains bullish, even if we see a short term correction in the near future.
📝Levels to watch:
$50.000, $1.000.000
SwingTraderPhil
SwingTrading.Simplified. | Investing.Simplified. | #LONGTERMVISION

BTCUSD: Triple Tap at 123K - The Line Between Bulls and BearsPrice has now tested the 123K resistance zone three times. On the third attempt, we saw a shallow breakout, hinting at absorption rather than rejection - a sign that sellers might be running thin((among them, I used to be lol).
Now, all eyes are on the 123K retest - the potential make-or-break pivot. If this level flips to support, bulls could drive toward the next Fib extension at 129,700. But if the level gives way, we’re likely headed back into the 117K–118.5K base zone.
Key Levels
🔴 Resistance Zone: 122,500 – 124,500
🟢 Target: 129,700 (Fib Ext 1.272)
⛔️ Invalidation: Below 122,000
🔵 Base Support: 117,000 – 118,500
📝 Thesis:
Triple tests tend to weaken supply zones. The shallow breakout suggests accumulation rather than exhaustion. Confirmation comes if buyers defend the 123K handle - failure to hold flips momentum back to the downside.
TL;DR:
Triple resistance test → shallow breakout → retest in play.
123K is the pivot. Hold = 129,700. Fail = back to base.
⚠️Risk Note:
Stay alert for fakeouts around macro events. Volume and close structure will tell the real story.

Bitcoin hits all-time high, altcoins follow suit!Bitcoin (BTCUSD) has smashed a new all-time high, reaching $125,700! The rally is fueled by steady inflows into spot ETFs, rising institutional interest, expectations of a softer Fed policy, and growing demand for safe-haven assets. Additional tailwinds include tech upgrades across networks and a revival in trading activity. This historic milestone for Bitcoin has lifted the entire crypto market. Investors are turning their attention back to top-10 altcoins — names with strong recognition, loyal communities, and clear development roadmaps.
Ethereum (ETHUSD) — trading around $4,558.76. The network has undergone major upgrades, making wallets more user-friendly and transactions faster and more stable. Layer-2 solutions are gaining traction, fees are becoming more predictable, and the network load is better distributed. As a result, investor interest in ETH-based tools and its ecosystem continues to grow. If Ethereum’s roadmap stays on schedule, it could further strengthen its position as the go-to platform for decentralized applications.
Solana (SOLUSD) — around $233.30. The ecosystem is preparing a high-performance validator module aimed at significantly boosting speed and resilience. This is critical for high-traffic use cases like exchanges, gaming, and micro-payment services. Solana is also set to gain the spotlight during a major industry conference later this year — a typical launchpad for new partnerships, grants, and product announcements. If improvements are implemented successfully, Solana could gain more ground in the fast and low-cost transactions segment.
BNB (BNBUSD) — approximately $1,208.83. The network continues to cut costs for users and developers, expand its toolkit for launching apps, and maintain price stability through regular supply control. The easier it becomes to build and scale on BNB Chain, the greater the volume — and the stronger the token demand. With security and performance updates expected on schedule, BNB remains a top-tier infrastructure asset.
FreshForex analysts believe Bitcoin’s record high reaffirms the global appetite for digital assets, while strong developments across major altcoins add depth and resilience to the market. Q4 2025 could deliver solid returns for active buyers — with the most powerful surge expected in Q1 2026.

Bitcoin Range Analysis: 110k-124k Breakout WatchHello everyone, as we can see, Bitcoin has bounced off the last major support at 109-110k. Currently, the latest resistance is at 124k, so the range to play in at the moment is 110-124k. We are waiting to see if the range will be broken upwards or downwards.

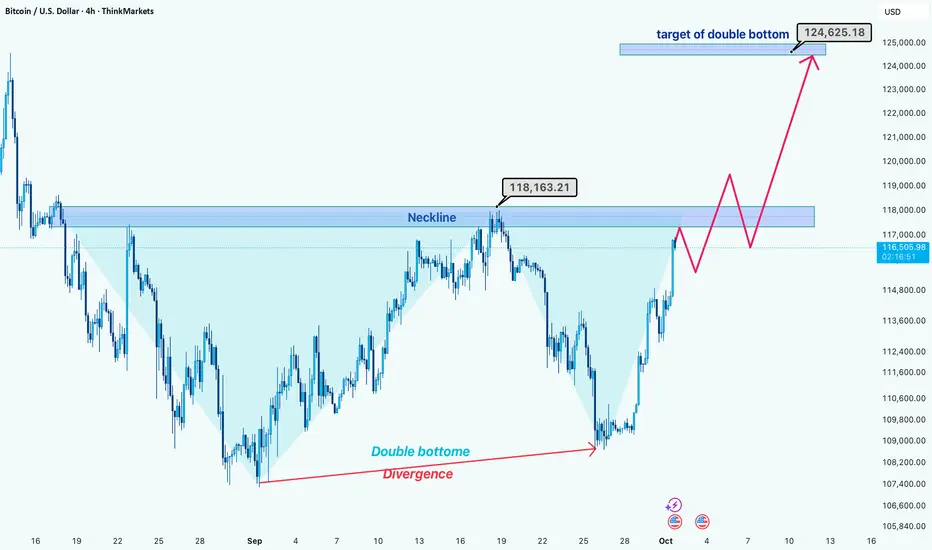
Bitcoin Technical: Double Bottom Setting Up for $124.6K?Hi guys!
Bullish Divergence
Bitcoin has recently formed a bullish divergence, which signals that selling pressure is weakening and buyers are stepping in.
Double Bottom Formation
A double bottom pattern is clearly visible, but the critical neckline resistance around $118,163 hasn’t been broken yet. This area is the key confirmation level.
Potential Breakout
Thanks to the bullish divergence, there’s a strong possibility that BTC will break above this neckline in the coming sessions.
Long Position Strategy
The safest long entry would be after the neckline breakout and a small pullback (correction) to confirm support. This reduces the risk of a false breakout.
Target Projection
If confirmed, the double bottom pattern projects a target around $124,600, offering a solid upside potential from the current levels.
Disclaimer: As part of ThinkMarkets’ Influencer Program, I am sponsored to share and publish their charts in my analysis.
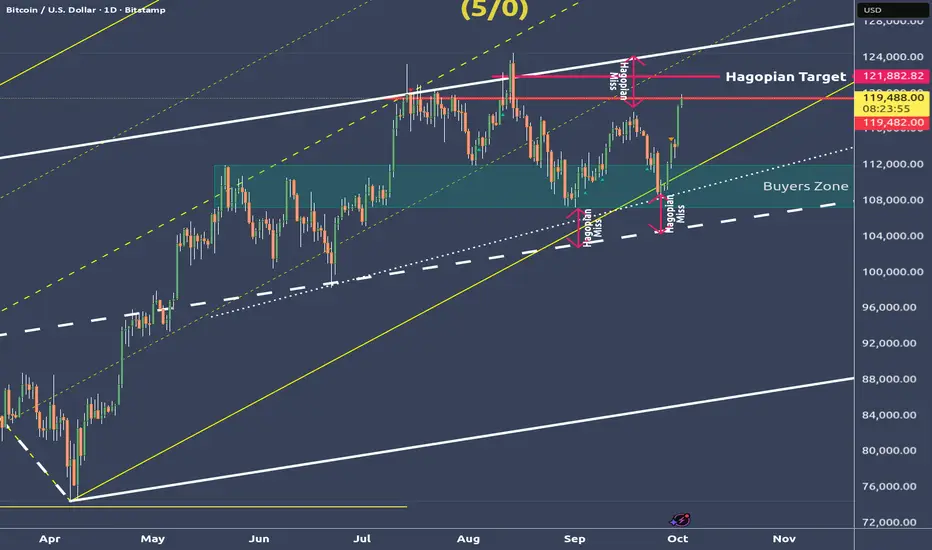
Bitcoin deep dive - We go up to the Hagopians line🔱 Up to the HAGOPIAN's line! 🔱
My last post showed what the possible moves are.
Bitcoin blew through both U-MLH's and is now on the way to the HAGOPIAN-Line.
I could imagine that we even tag the white U-MLH again.
That would be about where the confluence with the yellow forks 1/4 line is.
Because there is much more to say about this chart, I thought I'll do a video.
⛏️ I constructed the Chart from the ground up so you can see all the details and thoughts running through my Mycel Network §8-)
👉 Just check my SOM links.
🙏 Thanks you all for the Boosters I got lately. You all are absolutely awesom and I really appreciate it! 🙏
Bitcoin : Stay heavy on positionsBitcoin : Stay heavy on positions (2x~3x)
Maintaining the same outlook as before.
** This analysis is based solely on the quantification of crowd psychology.
It does not incorporate price action, trading volume, or macroeconomic indicators.

WHAT IF.. $BITCOIN holds? New ATH incomingHey again traders!
BTC is leaving no man alive. What everybody thinks about the 107K level ( masive bearish breakout) was invalidated by a bullish breakout to 114K.
The sad part? We are in a bearish channel.
The good one? If we hold 110K - 112K there is a high probabilty that 117K - ATH will come on the upcoming weeks.
Have to be mentioned that we are entering in Q4 historically the most bullsh Q for markets!

Bitcoin Price Eyes $120,000 as Seller Exhaustion Sets InBitcoin is trading at $116,502, attempting to hold $115,000 as a new support level. Securing this area is vital as the cryptocurrency also works to break out of the two-month downtrend that has capped its upward momentum since midsummer.
If conditions improve, Bitcoin could rally beyond $117,261. Breaching this level would open the door to $120,000. This would reinforce optimism among traders and institutions anticipating further growth in the crypto king’s valuation.
However, failure to maintain current levels would invalidate the bullish outlook. Bitcoin could fall back to $112,500 or even $110,000, extending the bear run. Such a move would dampen sentiment, signaling renewed vulnerability in the world’s largest cryptocurrency.

BTC Analysis: Support, Market Structure & My Trade Plan📊 Bitcoin (BTC) has been rallying strongly and remains in a clear bullish trend 🚀.
🔎 At this stage, I’m watching for price to pull back into support. If BTC can hold that level and then confirm with a bullish break of market structure on the 30-minute chart ⏱️, it would provide a potential long entry setup 🎯.
📈 The broader momentum remains bullish, so I’ll be patient and wait for confirmation before getting involved.
⚠️ Disclaimer: This analysis is for educational purposes only and not financial advice. Always trade with proper risk management.

Bitcoin Liquidity GrabBitcoin came back into discount pricing (between the swing low and swing high), and it looks like it is still waiting for the next catalyst for the next leg up.
We are currently still in the weekly imbalance, which a lot of times will act as a demand zone. Before we can take a long position, we need to clear the "bump in the road" — or in this case, liquidity.
I will wait for price to take out the liquidity under the equal lows around 107.2k, and then I’ll wait for a CHoCH on the 1H–4H before looking for a long trade.
Happy trading,

BITCOIN HIGH PROBABILITY SETUP SOON!!!🚨 BTC HIGH PROBABILITY BUY SETUP 🚨
* Here We Can See Clearly The Next Potential Moves For BTCUSD Coming Hours/Days.
* Keep Your Eyes Close On Your Trading Positions.
* Happy PIP Hunting Traders.
FXKILLA.

BTCUSD update May 22nd, 2025I have returned and here is my updated chart. I'm such a perfectionist sometimes when it comes to lines that it takes my hours to get them exactly how I envision. To start off, yes I am bullish on Bitcoin and believe that this cycle hasn't ended yet but I will admit that I think the end of it is closer than the beginning. With that being said, I will not disappear when the bear market starts, I will simply make updates and try to catch the bottom like I did in the past. So far I am going with history and my bottom target is above 66,800 and I expect the floor to fizzle out around 71-73k; if it ends up being higher than that, great! Overall this idea is just an update for my own personal records and my prediction is based on what has happen that last time this pattern was brought to us.
Stay safe out there, happy trading, and as always--Cheers!

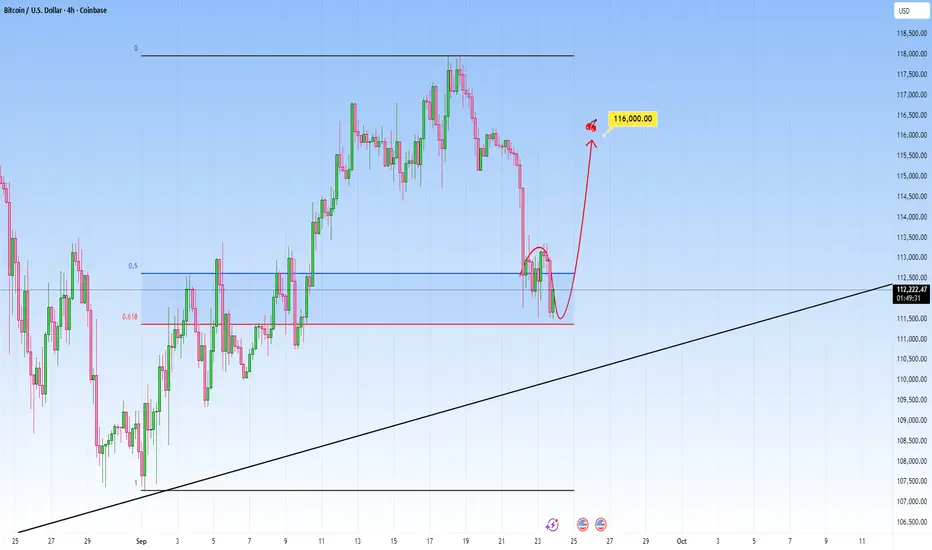
Bitcoin Analysis: Key Level to WatchPrice sold off aggressively, and now it sits within a key reaction area.
We can see price just tapped into the 0.5 and 0.618 Fibonacci retracement level of the last leg up. This is the golden pocket, a place where markets tend to react often.
Now look closely: price is showing early signs of rejection here, with wicks forming and momentum slowing down. If buyers step in here, and hold this zone that is our signals, targeting around the previous high.
But if price breaks clean below it, that invalidates the bullish idea and we could see some more continuation lower.
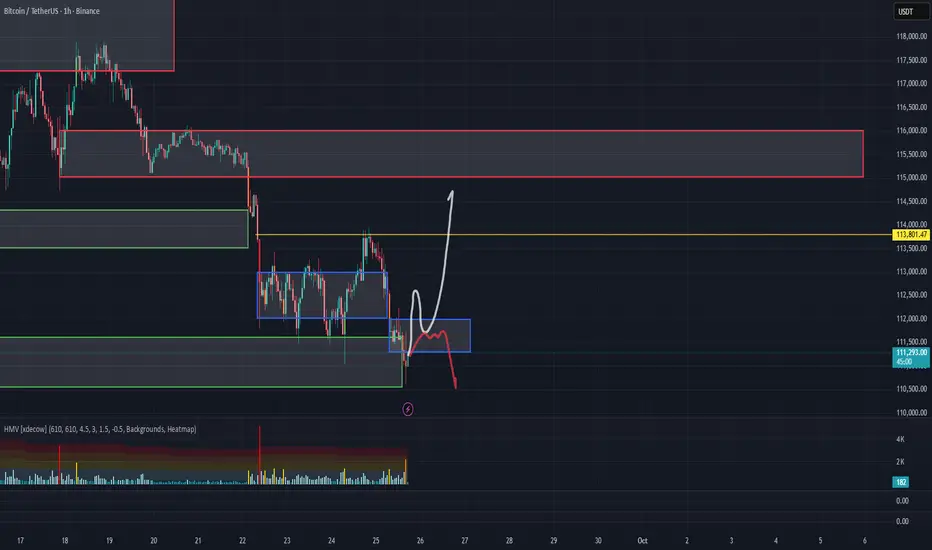
BTC/USDT Analysis. Moving Within the Expected Scenario
Hello everyone! This is CryptoRobotics trader-analyst with your daily market update.
Yesterday, as expected, Bitcoin made a false breakout to the upside, testing the ~$113,800 zone (market imbalance, mirror level) and then quickly reversed downward. When testing the $113,000-$112,000 area, there was no significant reaction, and the price moved lower to test the more important $111,600-$110,500 zone (accumulated volumes).
At the moment, the primary scenario remains a resumption of buying. A local volume zone has formed above the current price at $112,000-$111,300 — breaking and consolidating above it would significantly increase the probability of moving toward the next major resistance. We are considering a long position either after consolidation above this zone or upon a retest with a clear buying reaction, which would be a more conservative entry.
If this level is rejected, we may see further downside movement toward $108,000.
Buy Zones:
• $112,000-$111,300 (potential local support)
• ~$108,400 (cluster anomalies)
• $108,000–$102,500 (accumulated volumes)
Sell Zones:
• $115,000-$116,000 (accumulated volumes)
• $118,000–$119,000 (accumulated volumes)
• $121,200–$122,200 (buy absorption)
This publication is not financial advice.
Bitcoin Breaks Through Key Support Band — Price May Crash SoonAt the time of writing, Bitcoin trades at $111,542, reflecting a 4.7% weekly decline. The crypto king remains stuck below the $112,500 resistance, unable to attract enough momentum to flip the level into support.
If bearish pressure persists, Bitcoin could break through $110,000 support, opening a path to $108,000. Continued selling could extend the drawdown further, dragging BTC to $105,000 in the near term.
However, if investors step in to stabilize price action, Bitcoin could reclaim $112,500 as support. A successful bounce from that level would challenge the prevailing bearish narrative, potentially setting the stage for recovery and invalidating the downside outlook.

Bitcoin Reward – Bullish Thieves or Bearish Bandits?🚨💰 BTC/USD "Bitcoin vs U.S. Dollar" Crypto Market Grand Heist Plan 🎭🚨
🕵️♂️ Dear Thief OG’s, Money Makers & Market Bandits 💎💰
It’s time to lock & load the Bitcoin Heist Plan with both sides of the robbery open (Bullish & Bearish)! ⚡
🔑 Entry Zones (Where the Robbery Begins)
📉 Bearish Bandits: Any price level! Rob the upside liquidity & run it down!
📈 Bullish Thieves: Pullback entry 108,000.0 and above – sneak in with style & power.
🛑 Stop Loss (Escape Route)
🔒 For Bullish: Thief SL @ 105,000.0 🚨
⚠️ Reminder, OG’s: Adjust your SL with your own strategy & risk plan. Don’t get caught by the market police 👮♂️💥.
🎯 Target (The Loot Bag)
🏆 Bullish Robbery Target: 124,000.0 💸
🏴☠️ Bearish Robbery Targets:
1️⃣ 110,000.0
2️⃣ 104,000.0
📜 Thief’s Market Note
This isn’t just a trade, it’s a crypto robbery blueprint – choose your side, Bullish or Bearish, and execute like a true Thief Trader. Always plan your entries in layers, stack the loot, and manage your risk like a pro bandit. ⚡💼
🔥💥 If you love the heist style, Boost this idea 💥🔥
Every boost adds fuel to the Thief Trading Crew 🚀💎.
Stay alert, stay sharp, and remember… the market is the biggest bank, and we are here to rob it! 🤑🎭💰

Bitcoin’s Breaking Point: Why Price Needs To Stay Above $111,500At the time of writing, Bitcoin trades at $112,960, holding slightly above the $112,500 support level. Within the last 24 hours, BTC slipped from $115,100 and touched $111,478 during its intra-day low. This volatile action underscores the importance of maintaining current levels.
The crypto king has so far managed to stay above $111,400, the STH cost basis. By securing $112,500 as support, Bitcoin has the potential to bounce back toward $115,000, which would help prevent a bear market structure from taking shape.
However, any renewed selling pressure could drag Bitcoin through $112,500 and toward the $110,000 support. If that occurs, the bullish thesis would be invalidated, and BTC could slide further, officially marking the onset of bearish momentum.

BTCUSDT.P - September 23, 2025$100,621.3 – $107,211.5 are ideal DCA zones before we push toward $130,000 by year-end; plan your trades accordingly.

Bitcoin BTC: Watching for Support and Accumulation📊 Bitcoin (BTC) has been pushing lower and is now appearing overextended to the downside. Recently, price has staged a deep correction that may be nearing exhaustion.
🔎 I’ll be watching closely to see if BTC can hold key support levels and potentially begin forming an accumulation base 🏗️.
📈 Should price confirm strength with a bullish break of market structure, that would signal a possible long opportunity 🚀. Until then, patience is required to let the setup fully develop.
⚠️ Disclaimer: This is educational analysis only and not financial advice. Always trade responsibly and manage risk carefully.
