Bitcoin Technical: Double Bottom Setting Up for $124.6K?Hi guys!
Bullish Divergence
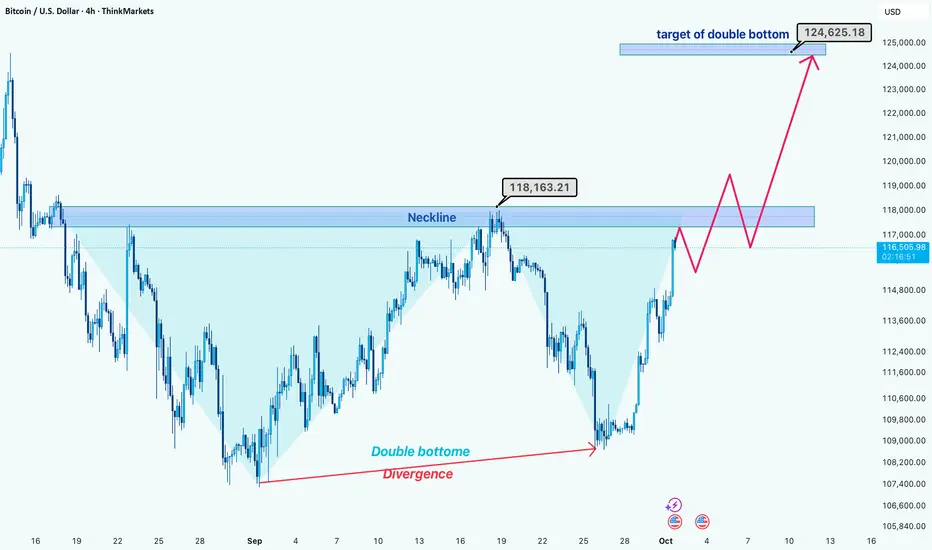
Bitcoin has recently formed a bullish divergence, which signals that selling pressure is weakening and buyers are stepping in.
Double Bottom Formation
A double bottom pattern is clearly visible, but the critical neckline resistance around $118,163 hasn’t been broken yet. This area is the key confirmation level.
Potential Breakout
Thanks to the bullish divergence, there’s a strong possibility that BTC will break above this neckline in the coming sessions.
Long Position Strategy
The safest long entry would be after the neckline breakout and a small pullback (correction) to confirm support. This reduces the risk of a false breakout.
Target Projection
If confirmed, the double bottom pattern projects a target around $124,600, offering a solid upside potential from the current levels.
Disclaimer: As part of ThinkMarkets’ Influencer Program, I am sponsored to share and publish their charts in my analysis.
Bitcoinlong
Bitcoin deep dive - We go up to the Hagopians line🔱 Up to the HAGOPIAN's line! 🔱
My last post showed what the possible moves are.
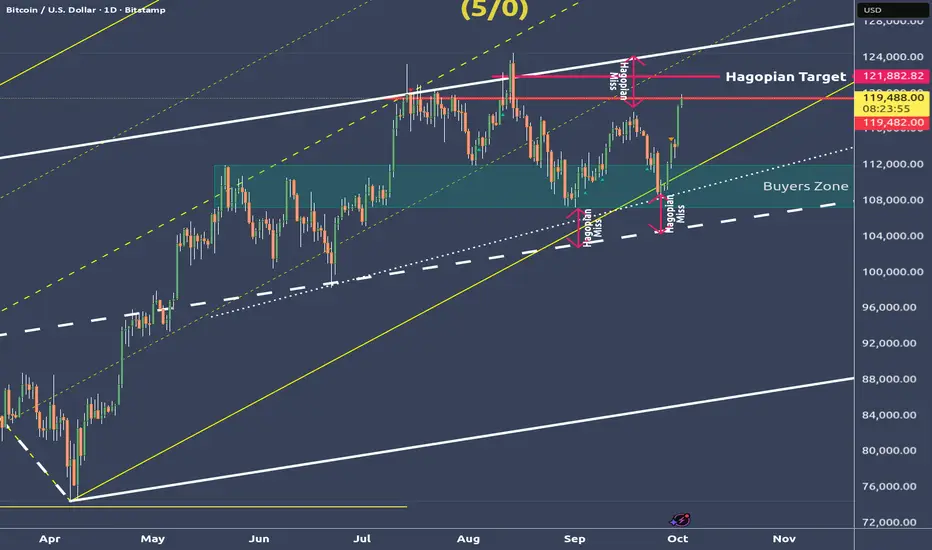
Bitcoin blew through both U-MLH's and is now on the way to the HAGOPIAN-Line.
I could imagine that we even tag the white U-MLH again.
That would be about where the confluence with the yellow forks 1/4 line is.
Because there is much more to say about this chart, I thought I'll do a video.
⛏️ I constructed the Chart from the ground up so you can see all the details and thoughts running through my Mycel Network §8-)
👉 Just check my SOM links.
🙏 Thanks you all for the Boosters I got lately. You all are absolutely awesom and I really appreciate it! 🙏
Bitcoin : Stay heavy on positionsBitcoin : Stay heavy on positions (2x~3x)
Maintaining the same outlook as before.
** This analysis is based solely on the quantification of crowd psychology.
It does not incorporate price action, trading volume, or macroeconomic indicators.

WHAT IF.. $BITCOIN holds? New ATH incomingHey again traders!
BTC is leaving no man alive. What everybody thinks about the 107K level ( masive bearish breakout) was invalidated by a bullish breakout to 114K.
The sad part? We are in a bearish channel.
The good one? If we hold 110K - 112K there is a high probabilty that 117K - ATH will come on the upcoming weeks.
Have to be mentioned that we are entering in Q4 historically the most bullsh Q for markets!

Bitcoin Price Eyes $120,000 as Seller Exhaustion Sets InBitcoin is trading at $116,502, attempting to hold $115,000 as a new support level. Securing this area is vital as the cryptocurrency also works to break out of the two-month downtrend that has capped its upward momentum since midsummer.
If conditions improve, Bitcoin could rally beyond $117,261. Breaching this level would open the door to $120,000. This would reinforce optimism among traders and institutions anticipating further growth in the crypto king’s valuation.
However, failure to maintain current levels would invalidate the bullish outlook. Bitcoin could fall back to $112,500 or even $110,000, extending the bear run. Such a move would dampen sentiment, signaling renewed vulnerability in the world’s largest cryptocurrency.

BTC Analysis: Support, Market Structure & My Trade Plan📊 Bitcoin (BTC) has been rallying strongly and remains in a clear bullish trend 🚀.
🔎 At this stage, I’m watching for price to pull back into support. If BTC can hold that level and then confirm with a bullish break of market structure on the 30-minute chart ⏱️, it would provide a potential long entry setup 🎯.
📈 The broader momentum remains bullish, so I’ll be patient and wait for confirmation before getting involved.
⚠️ Disclaimer: This analysis is for educational purposes only and not financial advice. Always trade with proper risk management.

Bitcoin Liquidity GrabBitcoin came back into discount pricing (between the swing low and swing high), and it looks like it is still waiting for the next catalyst for the next leg up.
We are currently still in the weekly imbalance, which a lot of times will act as a demand zone. Before we can take a long position, we need to clear the "bump in the road" — or in this case, liquidity.
I will wait for price to take out the liquidity under the equal lows around 107.2k, and then I’ll wait for a CHoCH on the 1H–4H before looking for a long trade.
Happy trading,

BITCOIN HIGH PROBABILITY SETUP SOON!!!🚨 BTC HIGH PROBABILITY BUY SETUP 🚨
* Here We Can See Clearly The Next Potential Moves For BTCUSD Coming Hours/Days.
* Keep Your Eyes Close On Your Trading Positions.
* Happy PIP Hunting Traders.
FXKILLA.

BTCUSD update May 22nd, 2025I have returned and here is my updated chart. I'm such a perfectionist sometimes when it comes to lines that it takes my hours to get them exactly how I envision. To start off, yes I am bullish on Bitcoin and believe that this cycle hasn't ended yet but I will admit that I think the end of it is closer than the beginning. With that being said, I will not disappear when the bear market starts, I will simply make updates and try to catch the bottom like I did in the past. So far I am going with history and my bottom target is above 66,800 and I expect the floor to fizzle out around 71-73k; if it ends up being higher than that, great! Overall this idea is just an update for my own personal records and my prediction is based on what has happen that last time this pattern was brought to us.
Stay safe out there, happy trading, and as always--Cheers!

Bitcoin Analysis: Key Level to WatchPrice sold off aggressively, and now it sits within a key reaction area.
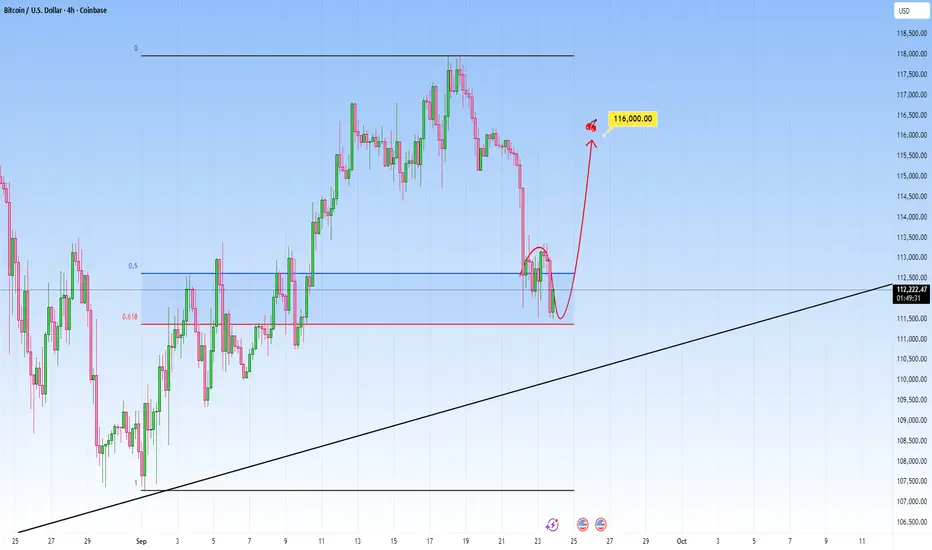
We can see price just tapped into the 0.5 and 0.618 Fibonacci retracement level of the last leg up. This is the golden pocket, a place where markets tend to react often.
Now look closely: price is showing early signs of rejection here, with wicks forming and momentum slowing down. If buyers step in here, and hold this zone that is our signals, targeting around the previous high.
But if price breaks clean below it, that invalidates the bullish idea and we could see some more continuation lower.
BTC/USDT Analysis. Moving Within the Expected Scenario
Hello everyone! This is CryptoRobotics trader-analyst with your daily market update.
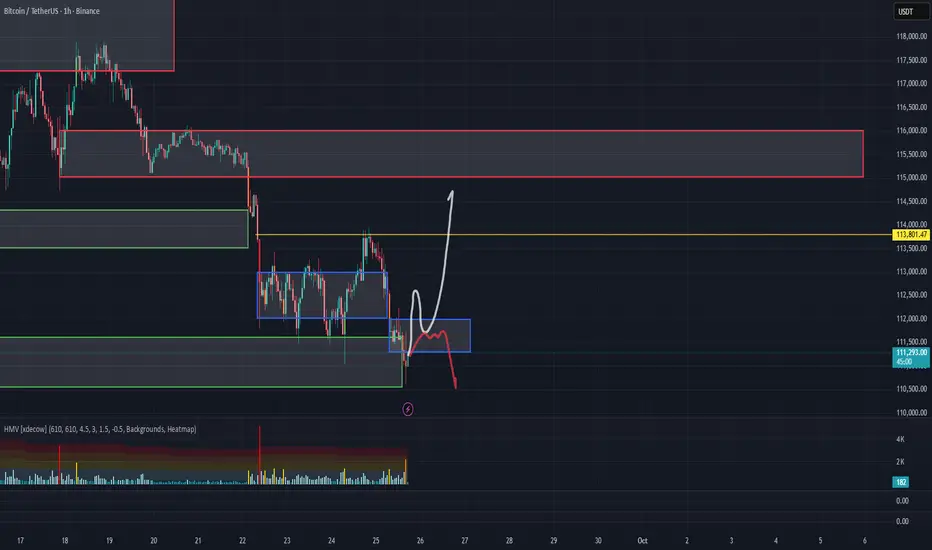
Yesterday, as expected, Bitcoin made a false breakout to the upside, testing the ~$113,800 zone (market imbalance, mirror level) and then quickly reversed downward. When testing the $113,000-$112,000 area, there was no significant reaction, and the price moved lower to test the more important $111,600-$110,500 zone (accumulated volumes).
At the moment, the primary scenario remains a resumption of buying. A local volume zone has formed above the current price at $112,000-$111,300 — breaking and consolidating above it would significantly increase the probability of moving toward the next major resistance. We are considering a long position either after consolidation above this zone or upon a retest with a clear buying reaction, which would be a more conservative entry.
If this level is rejected, we may see further downside movement toward $108,000.
Buy Zones:
• $112,000-$111,300 (potential local support)
• ~$108,400 (cluster anomalies)
• $108,000–$102,500 (accumulated volumes)
Sell Zones:
• $115,000-$116,000 (accumulated volumes)
• $118,000–$119,000 (accumulated volumes)
• $121,200–$122,200 (buy absorption)
This publication is not financial advice.
Bitcoin Breaks Through Key Support Band — Price May Crash SoonAt the time of writing, Bitcoin trades at $111,542, reflecting a 4.7% weekly decline. The crypto king remains stuck below the $112,500 resistance, unable to attract enough momentum to flip the level into support.
If bearish pressure persists, Bitcoin could break through $110,000 support, opening a path to $108,000. Continued selling could extend the drawdown further, dragging BTC to $105,000 in the near term.
However, if investors step in to stabilize price action, Bitcoin could reclaim $112,500 as support. A successful bounce from that level would challenge the prevailing bearish narrative, potentially setting the stage for recovery and invalidating the downside outlook.

Bitcoin Reward – Bullish Thieves or Bearish Bandits?🚨💰 BTC/USD "Bitcoin vs U.S. Dollar" Crypto Market Grand Heist Plan 🎭🚨
🕵️♂️ Dear Thief OG’s, Money Makers & Market Bandits 💎💰
It’s time to lock & load the Bitcoin Heist Plan with both sides of the robbery open (Bullish & Bearish)! ⚡
🔑 Entry Zones (Where the Robbery Begins)
📉 Bearish Bandits: Any price level! Rob the upside liquidity & run it down!
📈 Bullish Thieves: Pullback entry 108,000.0 and above – sneak in with style & power.
🛑 Stop Loss (Escape Route)
🔒 For Bullish: Thief SL @ 105,000.0 🚨
⚠️ Reminder, OG’s: Adjust your SL with your own strategy & risk plan. Don’t get caught by the market police 👮♂️💥.
🎯 Target (The Loot Bag)
🏆 Bullish Robbery Target: 124,000.0 💸
🏴☠️ Bearish Robbery Targets:
1️⃣ 110,000.0
2️⃣ 104,000.0
📜 Thief’s Market Note
This isn’t just a trade, it’s a crypto robbery blueprint – choose your side, Bullish or Bearish, and execute like a true Thief Trader. Always plan your entries in layers, stack the loot, and manage your risk like a pro bandit. ⚡💼
🔥💥 If you love the heist style, Boost this idea 💥🔥
Every boost adds fuel to the Thief Trading Crew 🚀💎.
Stay alert, stay sharp, and remember… the market is the biggest bank, and we are here to rob it! 🤑🎭💰

Bitcoin’s Breaking Point: Why Price Needs To Stay Above $111,500At the time of writing, Bitcoin trades at $112,960, holding slightly above the $112,500 support level. Within the last 24 hours, BTC slipped from $115,100 and touched $111,478 during its intra-day low. This volatile action underscores the importance of maintaining current levels.
The crypto king has so far managed to stay above $111,400, the STH cost basis. By securing $112,500 as support, Bitcoin has the potential to bounce back toward $115,000, which would help prevent a bear market structure from taking shape.
However, any renewed selling pressure could drag Bitcoin through $112,500 and toward the $110,000 support. If that occurs, the bullish thesis would be invalidated, and BTC could slide further, officially marking the onset of bearish momentum.

BTCUSDT.P - September 23, 2025$100,621.3 – $107,211.5 are ideal DCA zones before we push toward $130,000 by year-end; plan your trades accordingly.

Bitcoin BTC: Watching for Support and Accumulation📊 Bitcoin (BTC) has been pushing lower and is now appearing overextended to the downside. Recently, price has staged a deep correction that may be nearing exhaustion.
🔎 I’ll be watching closely to see if BTC can hold key support levels and potentially begin forming an accumulation base 🏗️.
📈 Should price confirm strength with a bullish break of market structure, that would signal a possible long opportunity 🚀. Until then, patience is required to let the setup fully develop.
⚠️ Disclaimer: This is educational analysis only and not financial advice. Always trade responsibly and manage risk carefully.

2-Month High Bitcoin Accumulation Could Push Price To $120,000Bitcoin is trading at $116,027, maintaining steady gains since the start of the month. The crypto king is now facing resistance at $117,261, a key level that has kept upward progress capped in recent sessions. Breaking this barrier will be crucial for Bitcoin’s next move.
If Bitcoin manages to breach and flip $117,261 into support, it could rally toward $120,000 in the coming days. Strong buying pressure and favorable momentum indicators make this outcome highly plausible.
However, a loss of momentum could bring renewed selling pressure. Should BTC fall through the $115,000 support, the price risks slipping to $112,500, invalidating the bullish outlook.

BTC Trade Update - Time to Buy?Trade Update on BINANCE:BTCUSD
COINBASE:BTCUSD is currently forming a hidden divergence around the support zone on H1 - a very strong buy signal and potential bullish reversal, as seen in previous instances. I’ve been waiting for this setup, and I expect a strong reversal soon.
Key points:
Entry around CMP to 115,200 remains a solid buy zone.
The next 4H candle close will be very important for confirmation.
Conservative traders may prefer to wait for price close + a Japanese candlestick reversal signal.
Price may dip to retest the support zone (possible spike/sharp rejection), but unlikely to hold for long.
Overall trend remains bullish, further supported by the recent Fed rate cut.
Trade safe and watch closely for the next confirmation.

Bitcoin : Stay heavy on positionsBitcoin : Stay heavy on positions (2x~3x)
Maintaining the same outlook as before.
** This analysis is based solely on the quantification of crowd psychology.
It does not incorporate price action, trading volume, or macroeconomic indicators.

ETHUSDT 4h
CRYPTOCAP:ETH might be ready to pop!
Entry: $4,869
Target: $6,136
Consolidation looks like a spring ready to launch 🚀
Keep eyes on the breakout!
DYOR & NFA
#ETH #Crypto

Bitcoin Price Prediction: Will BTC Hit $119K Next?Bitcoin Price Prediction: Will BTC Hit $119K Next?
Bitcoin’s journey has been nothing less than a roller coaster, marked by dramatic rises and sharp falls. As of late, the cryptocurrency has seen fluctuations influenced heavily by broader economic signals, particularly the policy decisions from the United States Federal Reserve. The latest buzz in the crypto community revolves around whether Bitcoin can breach a new milestone of $119,000. This speculation is fueled by recent shifts in the market and macroeconomic policies that could either propel or hinder this ascent.
Current Market Overview
Key Resistance and the $118K Threshold
Bitcoin currently faces a significant resistance level at $118,000. This figure is not just a random high point; it represents a critical psychological and technical barrier. A break above this level could signal a strong bullish momentum, potentially setting the stage for reaching new heights. The resistance has formed due to various factors including profit-taking, historical resistance levels, and speculative trading behaviors.
The Role of the US Federal Reserve
The Federal Reserve's policies, particularly interest rate cuts, have a profound impact on investment in risk assets like cryptocurrencies. Lower interest rates generally decrease the yield on safer investments like bonds, making higher-risk investments more attractive. The anticipation around the Fed's decisions can lead to increased volatility in the Bitcoin market.
Liquidity and Market Sentiment
The liquidity in the Bitcoin market, evidenced by the influx of both buy and sell orders, plays a crucial role in its price movements. High liquidity leads to less price manipulation and more stability, whereas low liquidity can lead to higher volatility. Currently, the market is witnessing substantial liquidity, indicating active participation from both retail and institutional investors.
Factors Influencing Bitcoin's Price Trajectory
Institutional Adoption
One of the primary drivers behind Bitcoin’s potential rise to $119K is the increasing adoption by institutional investors. As more firms enter the market, their substantial buying power can significantly push the price upwards. This adoption also adds legitimacy to Bitcoin, encouraging more cautious investors to dip their toes in the crypto waters.
Technological Advances
Improvements in blockchain technology and the introduction of new features can also influence Bitcoin's price. For instance, enhancements in scalability and security can make Bitcoin more attractive to both investors and users.
Regulatory Environment
Regulations play a pivotal role in shaping the cryptocurrency landscape. Positive regulatory developments, or lack of negative ones, could boost investor confidence and push the price of Bitcoin higher.
Economic Indicators and Market Sentiments
Inflation and the Dollar Index
Inflation levels and the strength of the dollar also influence Bitcoin’s value. Typically, Bitcoin has been seen as a hedge against inflation. A weaker dollar often makes Bitcoin more attractive to international buyers, potentially pushing its price up.
Sentiment Analysis
Market sentiment, driven by news and social media, significantly impacts Bitcoin’s price. Positive news can lead to fear of missing out (FOMO), driving the price up, while negative news can trigger panic selling.
Technical Analysis and Future Predictions
Chart Patterns and Indicators
From a technical standpoint, Bitcoin has shown resilience by bouncing back from several corrections. The formation of a bullish flag pattern, combined with strong support levels being tested and held, suggests upward momentum.
Predictive Models
Various predictive models based on historical price data, market cycles, and external economic factors suggest a bullish outlook for Bitcoin. These models often incorporate elements like stock-to-flow ratios which have been historically accurate in predicting Bitcoin’s long-term price movements.
Expert Opinions
Many industry experts and analysts have weighed in on Bitcoin’s potential to hit $119K. While opinions vary, the prevailing sentiment is cautiously optimistic, contingent on market conditions and macroeconomic factors remaining favorable.
Conclusion
The question of whether Bitcoin will reach $119K is complex and laden with variables. Key factors include Federal Reserve policies, market liquidity, institutional investment, and broader economic indicators. While the short-term journey may be volatile, the long-term outlook for Bitcoin remains bullish, with many paths potentially leading to new all-time highs. As always in the crypto world, only time will tell, but the signs are promising for those betting on Bitcoin’s success.

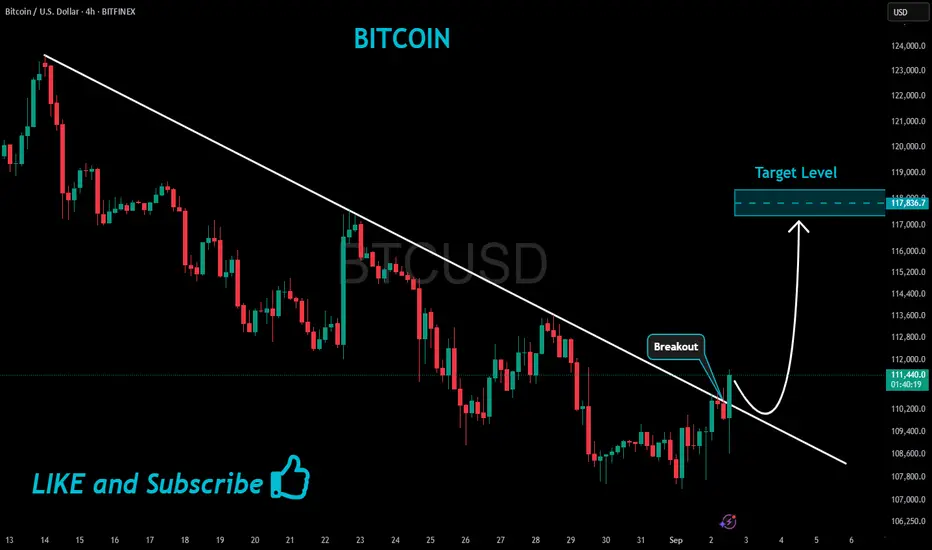
BITCOIN Bullish Breakout!
HI,Traders !
#BITCOIN made a bullish
Breakout of the falling resistance
And the breakout is confirmed
So we are bullish biased
And we will be expecting
A further bullish move up !
Comment and subscribe to help us grow !
BitCoin $BTC weekly demand level helping the strong rallyWeekly demand imbalance is still in control and is playing out well. A third large bullish candlestick body is being created. Trying to break the resistance level and the all-time highs.
