BTC/USDT Analysis. Selling Climax
Hello everyone! CryptoRobotics trader-analyst here with your daily market analysis.
Yesterday, Bitcoin continued its decline, reaching a low of $60,000 before rebounding.
The daily candle closed on elevated volume levels, comparable only to those seen in August 2024. This indicates emerging buyer interest at current price levels.
Despite the locally positive context and the ongoing rebound, another wave of selling pressure remains likely. Buying volumes during the recovery remain weak, and the first major resistance zone is likely to trigger renewed selling activity.
Seller volume concentration remains significant up to $71,000, and until price confidently breaks and holds above this level, a full bullish reversal remains unlikely.
Therefore, the priority scenario remains a potential decline toward the high-volume zone at $65,000–$63,000.
Most likely, another wave of decline may begin after a test of the $69,500–$71,000 zone, where large cluster volume anomalies are currently located.
Buy Zones
$65,000–$63,000 (maximum traded volumes)
$72,200–$56,000 (daily buy zone)
Sell Zones
$69,500–$71,000 (large cluster anomalies)
$72,500–$75,200 (selling pressure)
$77,800–$79,200 (accumulated volumes)
$82,000–$85,500 (volume anomalies)
$87,600–$90,500 (accumulated volumes)
This publication is not financial advice.
Bitcoinnews

#BITCOIN: 2026 Is Loading Possible Drop First And Then Boom! Happy New Year 2026💥🎇
We extend our best wishes for your success and happiness, hoping this year brings the achievement of all your trading objectives.
Let us now analyse Bitcoin's concluding performance for the year 2025👨💻📈
🔺Bitcoin is currently exhibiting strong consolidation, trading within a range of $80,000 to $95,000. It is possible that the price is awaiting robust Non-Farm Payroll (NFP) data to bolster the DXY, which could indirectly lead to a price correction towards the $67,000-$64,000 range. This area is characterized by significant bullish volume and liquidity. A potential swing target could be established above the recent yearly high of $125,000.
Entry, Stop Loss, and Take Profit💭
🔺A strong order block entry is identifiable at $67,000, a critical level for global investors. Upon a price rejection from this vicinity, we anticipate a reversal and subsequent progression towards our designated take-profit target of $135,000.
🔺 A stop loss can be positioned below $59,000 providing a sufficient buffer in the event of a liquidity hunt. This trade may require up to a full year to materialise unless fundamental shifts induce unexpected price movements.
Support and Encouragement 🏆
🔺 We encourage you to comment on and share this analysis if you find it insightful. Your engagement, particularly through likes, provides valuable affirmation of our efforts.
We wish you good year ahead and appreciate your continued support.
Team SetupsFX_

BTC/USDT Analysis. Market Panic
Hello everyone! This is the CryptoRobotics trader-analyst with your daily market update.
Yesterday, Bitcoin broke a key support level. While the breakdown itself was expected, as mentioned previously, the magnitude of the move was significantly stronger than anticipated. At its peak, the decline exceeded 7%.
The $86,000–$84,800 zone (anomalous activity) was broken, and only upon reaching the major buy zone at $84,000–$82,000 (strong volume anomalies) did the sell-off temporarily pause.
At this stage, the scenario remains unfavorable for buyers. Defensive activity is present, but it is mainly driven by limit orders — market buying pressure is largely absent. Additionally, a mirrored resistance zone with strong selling pressure has formed above at $84,500–$86,000.
A retest of this area may provide a solid opportunity to re-enter short positions. The current context suggests an elevated probability of further downside continuation toward the technical level around $74,500.
A reversal from the current support is possible, but only if price tests the $84,500–$86,000 zone and sellers fail to continue the downward move. Until such confirmation appears, the priority remains on short setups.
Buy Zones
$84,000–$82,000 (strong volume anomalies)
Sell Zones
$87,000–$88,000 (selling pressure)
$84,500–$86,000 (mirrored zone, selling pressure)
$92,600–$93,500 (volume anomalies)
$96,000–$97,500 (selling pressure)
$101,000–$104,000 (accumulated volumes)
This publication is not financial advice.

BTC/USDT Analysis. Local Scenario in Play
Hello everyone! This is the CryptoRobotics trader-analyst with your daily market update.
Yesterday, Bitcoin started to execute the previously outlined long scenario and managed to hold above the volume zone at $88,000–$87,200.
On the 1-hour timeframe, we are now seeing increasing volume along with rising delta, which may indicate buyer activity and limit order absorption at current price levels.
The upside potential remains unchanged — at minimum, we expect a test of the technical level at $91,240. However, based on the current structure, a local pullback may occur before further continuation to the upside.
Buy Zones
$88,000–$87,200 (buyer support / holding zone)
$86,000–$84,800 (anomalous activity)
$84,000–$82,000 (strong volume anomalies)
Sell Zones
$92,600–$93,500 (volume anomalies)
$96,000–$97,500 (selling pressure)
$101,000–$104,000 (accumulated volumes)
This publication is not financial advice.

BTC/USDT Analysis. Microstructure Assessment and Potential Trade
Hello everyone! This is the CryptoRobotics trader-analyst, bringing you the daily market update.
Since the beginning of this week, Bitcoin has remained under persistent selling pressure, which continues at the moment.
Yesterday, the local low failed to hold, resulting in further downside movement. Price is now testing a key accumulated volume zone. The overall structure remains bearish, with no clear reversal formations observed so far. Our base scenario assumes a deeper fill of this zone, with potential downside toward $87,000.
The key intraday level is $90,160. A large concentration of anomalous seller volume clusters is located above this area. In case of a retest and false breakout of this level, as well as the now mirrored zone at $90,400–$91,700, we consider a short position targeting $87,000.
Buy Zones
$88,400–$87,000 — accumulated volumes
$86,000–$84,800 — anomalous activity
$84,000–$82,000 — strong volume anomalies
Sell Zones
$90,400–$91,700 — mirrored zone, anomalous selling
$92,600–$93,500 — volume anomalies
$96,000–$97,500 — selling pressure
$101,000–$104,000 — accumulated volumes
This publication is not financial advice.

BTC/USDT Analysis. Sellers Remain in Control
Hello everyone! This is CryptoRobotics trader-analyst, and here is the daily market update.
Today, the scenario outlined in yesterday’s weekly analysis has started to unfold. After testing the mirrored resistance zone at $93,200–$94,400, buyers failed to maintain control. Selling pressure intensified, leading to a decline and a full fill of the buyer zone at $92,000–$90,400 (accumulated volumes).
Although a reaction was observed from this area, the current volume distribution suggests continued downside potential, with a likely retest of the key technical level at $90,160.
If the current local low holds, an intraday corrective move toward the newly formed sell zone at $92,600–$93,500 (volume anomalies) is possible. Until a clear reversal setup appears, we continue to expect renewed selling pressure from this area.
Buy Zones
$92,000–$90,400 — accumulated volumes
$88,400–$87,000 — accumulated volumes
$86,000–$84,800 — anomalous activity
$84,000–$82,000 — strong volume anomalies
Sell Zones
$92,600–$93,500 — volume anomalies
$96,000–$97,500 — selling pressure
$101,000–$104,000 — accumulated volumes
This publication is not financial advice.

BTC/USDT Analysis. The level is broken — what’s next?
Hello everyone! This is the CryptoRobotics trader-analyst with a daily market update.
Yesterday, the previously outlined scenario played out as expected. After a brief consolidation around the $95,000 level, Bitcoin continued its upward move. The balance structure has been broken, but the key question now is whether it makes sense to chase longs at current prices.
Despite Bitcoin’s strong weekly performance, retail traders remain cautious. Moreover, activity from small-cap market participants continues to decline. Historically, this behavior suggests there is still room for further growth, and a move toward six-digit prices may follow.
On a local scale, we are observing anomalous activity in the $96,900–$97,500 zone. When price returns to this area, delta shifts toward buyers, yet this dynamic also signals seller pressure at resistance. If Bitcoin fails to confidently break and hold above the local hourly high at $97,200, a corrective move toward the nearest strong support becomes likely.
That said, the broader market sentiment remains bullish. In the event of a clean breakout and consolidation above this level, the $96,900–$97,500 zone may act as a support area.
Buy zones
$94,400–$93,200 (volume anomalies)
$92,000–$90,400 (accumulated volumes)
$88,400–$87,000 (accumulated volumes)
$86,000–$84,800 (anomalous activity)
$84,000–$82,000 (strong volume anomalies)
Sell zones
$96,900–$97,500 (potential resistance, volume anomalies)
$101,000–$104,000 (accumulated volumes)
This publication is not financial advice.

BTC/USDT Analysis. Another Manipulative Move
Hello everyone! This is the CryptoRobotics trader-analyst with a daily market update.
Yesterday, Bitcoin tested the sell zone at $88,800–$90,000 (area of abnormal selling activity), where price once again met resistance and went on to print a new local low.
The $87,000 level — previously marked by the largest seller volume — failed to produce a reaction on the retest and did not act as a buyer absorption zone, highlighting short-term demand weakness.
Price did not reach the key support at $84,000–$82,000 (volume anomalies). However, before testing that area, significant buyer activity emerged: attempts to push below the local low were defended, and selling pressure failed to extend the move.
At the moment, Bitcoin is moving back toward $90,000, where untested abnormal volume remains.
In the near term, we are considering a scenario involving the formation of a full reversal structure with a potential move toward the technical level at $94,500.
On a retest of the abnormal activity zone $86,000–$84,800, and upon a clear buyer reaction, we will look for long opportunities.
Buy Zones
$86,000–$84,800 (abnormal activity)
$84,000–$82,000 (volume anomalies)
Sell Zones
~$90,000 (abnormal volume)
~$92,400 (local sell zone)
$94,000–$97,500 (major volume zone)
$101,000–$104,000 (accumulated volumes)
This publication is not financial advice.

BTC/USDT Analysis. Yesterday’s Pattern Played Out
Hello everyone! This is the CryptoRobotics trader-analyst with a daily market update.
Yesterday, we identified volume accumulation positioned on the buy side. Shortly after the analysis was published, Bitcoin made a sharp move toward $90,000, fully realizing the local upside potential discussed earlier.
At the moment, the market picture remains mixed.
On one hand, a local bearish structure break has formed on the 1H timeframe, and recent buying pressure lacks volume support.
On the other hand, sellers are failing to take control: during the local rally and the test of the $87,000 level — where the largest seller volume of the week was formed — selling pressure was quickly absorbed by buyers. This area is now acting as local support.
Above the current price lies a zone of abnormal seller activity, formed during yesterday’s short squeeze. The $88,800–$90,000 area is considered key resistance. The base scenario is range trading between support and resistance.
A confident breakout and consolidation above $88,800–$90,000 would confirm a full break of the local downtrend that has been in place since last week.
Buy Zones
$87,000 (sell-side absorption)
$84,000–$82,000 (volume anomalies)
Sell Zones
$88,800–$90,000 (abnormal selling activity)
~$90,300 (local resistance)
~$92,400 (local resistance)
$92,000–$93,000 (local volume zone)
$94,000–$97,500 (major volume zone)
$101,000–$104,000 (accumulated volumes)
This publication is not financial advice.

BTC After the Flush: Building a Base Into 2026Bitcoin printed a clear correction from the 126,333 spot top into 80,625, a 36% retrace that finally reset an overheated trend. After that impulse down, price stopped bleeding and started building a base. That is the context for my long, not a breakout chase.
My first entry triggered at 85,000. If price sweeps lower, I will add, with my final planned entry sitting in the 72,000 to 70,000 region. The whole idea is simple: scale into higher time frame demand after a deep reset, then let the market do the work if it wants to rotate back into risk.
Technicals: on the daily, the selloff created an obvious “damage candle” sequence, followed by compression and range behavior. I am treating the 80K to 85K band as the core demand zone. The level that matters for confirmation is the recovery of the mid range resistance around 94,652, because a clean reclaim would shift the structure from “bounce” to “reversal attempt” and opens the door for a move back into the 100K area and, eventually, a retest of the prior ATH zone near 126K if momentum returns.
Fundamentals : the macro backdrop is supportive for risk if financial conditions keep easing. The Fed has already moved policy lower and continues to guide the market with forward projections, which is the type of environment that can reprice duration and high beta assets.  At the same time, institutional crypto flows have been rebuilding. CoinShares reported a rebound in digital asset ETP inflows with Bitcoin leading, and daily US spot Bitcoin ETF flow data has also shown positive net flows on recent sessions.  On derivatives, CME positioning and open interest remain a key dashboard for whether this base is being built with size behind it. 
Execution note: I am not trying to “be right” on the exact bottom. I am trying to be positioned where the risk is definable and the upside is asymmetric. If the narrative changes, I will adjust. If the market gives the move, I will pay myself and protect capital.
Note: Please remember to adjust this trade idea according to your individual trading conditions, including position size, broker-specific price variations, and any relevant external factors. Every trader’s situation is unique, so it’s crucial to tailor your approach to your own risk tolerance and market environment.

BTC/USDT Analysis. News-Driven Activity
Hello everyone! CryptoRobotics trader-analyst here, and this is the daily market analysis.
Yesterday, Bitcoin surged and reached our resistance zone at $94,000–$97,500 (volume area) after the release of positive U.S. labor market data.
At the moment, we are observing signs of buyer weakness: recent local highs are updated without momentum, and after testing the local support at $92,000 (pushing volume), the buyer is not showing initiative. Delta imbalance has shifted back toward sellers.
A key area to watch is around ~$93,500, where the highest concentration of absorbed spot-buying volume is located. If the price tests this level and reacts, we consider short positions targeting the 87,800–86,400 support.
An additional scenario is a repeated fake breakout of the local high. In this case, the downside potential remains the same.
Alternative scenario: a confident breakout of the current high. If this happens, the trading priority shifts fully to longs, and we will look for long setups on a retest, with targets above $100,000.
Buy Zones
• 87,800–86,400 (volume zone)
• $84,000–$82,000 (volume anomalies)
Sell Zones
• $94,000–$97,500 (volume zone)
• $101,000–$104,000 (accumulated volume)
• $105,800–$106,600 (local resistance)
This publication is not financial advice.

BitcoinBTCUSD
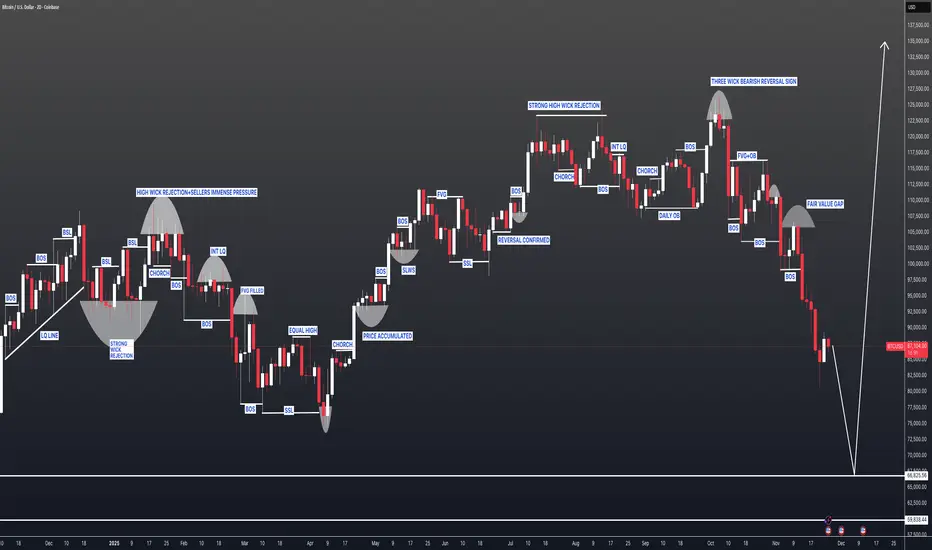
- Completed " 12345 " Impulsive Waves
- RSI - Divergence
- Change of Characteristics
- Fair Value Gap
- Order Block

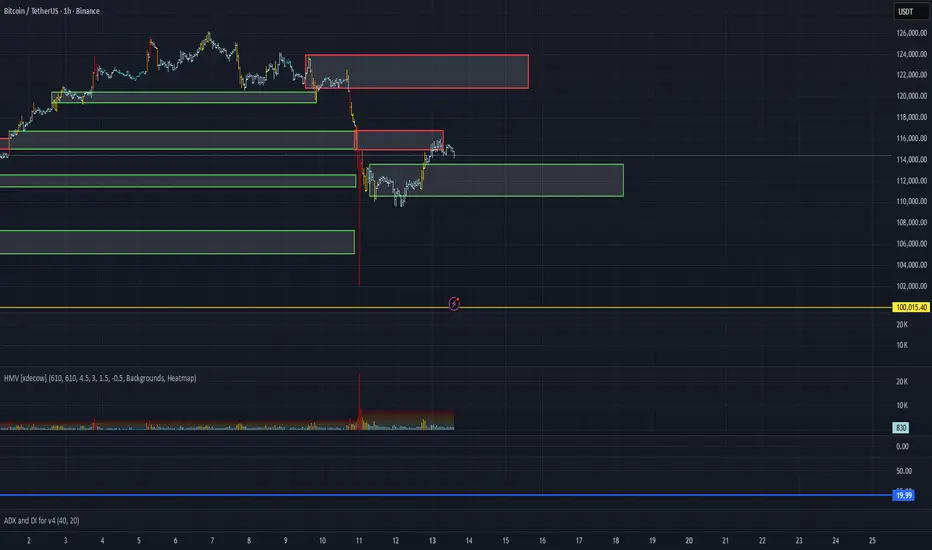
BITCOIN(BTCUSDT): First Setup Dropped From $107k To $80K, Next? Dear Traders,
Bitcoin has fallen from our selling point as described in our previous trading setup on BTCUSDT. The price has dropped significantly from $107k to $80k.
We anticipate a further decline to approximately $66k to $57k. This area appears to be a discounted price point where a large number of buyers are likely to be present. Once the price reaches our entry point marked by two white lines, we believe it will follow a strong bullish impulse. This will likely take the price from $60k to $140k.
We wish you the best of luck and trade safely.
Team Setupsfx
Bitcoin Can reach 93000 Bitcoin could reach the price level of $93,000 in the coming weeks.
There is a possibility that after breaking the midline of its long-term weekly channel, it may move up to the indicated FVG level to fill the remaining unfilled orders.
After that, it could start a new bullish rally aiming for the upper boundary of the channel.
This is purely an analysis and should not be considered as financial advice.
Buying or selling is at the trader’s own risk.

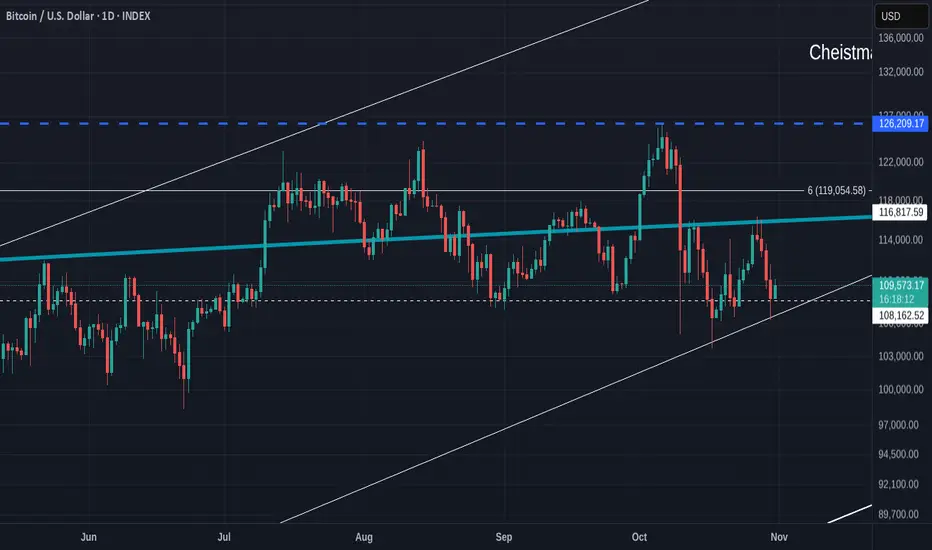
Bitcoin Daily Update - DO NOT PANIC - RED October not always Bad
This Bitcoin Daily chart should offer you hope if you are feeling a little worried about where Bitcoin is going.
See the Support offered where the Wicks touch that rising line of support.
Also note how that Horizontal dashed line offers Support.
WE ARE STILL IN RANGE
The Blue line ( Arc) is where we need to cross today to make a GREEN October.
It may not happen. But we had a Red october in 2012 in the middle of a bull Run, so I am not panicing, even if I remain cautious till we cross that line.
That 6 Fib line is a Major hurdle to cross
But the Daily MACD is Good.
Currently, the Red signal line has offered support to the Yellow MACD and while that lasts, I remain bullish.
This weekend is going to be VERY interesting.
BTC/USDT Analysis. The seller is trying to take control again
Hello everyone! This is the trader-analyst from CryptoRobotics, and here’s your daily analysis.
Yesterday, after reaching the upper boundary of the $115,000–$114,000 zone (local delta activity), buyers showed abnormal activity, but it failed to result in sustained growth. Only after dropping to the lower boundary did Bitcoin find support.
At the moment, we’re seeing a rebound, and the price is testing the area of yesterday’s buying activity — $115,000–$115,400. If there’s no reaction from this zone, the movement toward $120,000 may continue. However, if resistance holds, we expect a pullback toward the nearest support.
Currently, the delta shows absorption of buying, so long positions are considered only after a local high breakout followed by a retest.
Buy Zones:
$111,700–$110,000 (accumulated volumes),
$108,700–$107,500 (volume zone),
$105,600–$104,500 (volume anomalies),
$97,000–$93,000 (volume zone).
Sell Zones:
$115,000–$115,400 (buy absorption),
$120,900–$124,000 (volume zone).
This publication is not financial advice.
BITCOIN Bearish Breakout!
HI,Traders !
#BITCOIN made a bearish
Breakout of the key horizontal
Level of 109022.4 and the
Breakout is confirmed
So we are bearish biased
And we will be expecting
A further bearish move down !
Comment and subscribe to help us grow !

Analytics: Market Outlook and Forecasts
📈 WHAT HAPPENED?
On Friday evening, October 10, the cryptocurrency market experienced one of the largest crashes in history. It was also the largest cascade of futures liquidations ever. A total of about $20 billion was liquidated in one day. Bitcoin dropped by 16% in the moment, and many altcoins fell by 20% to 90%.
The main reason was the announcement by US President Donald Trump about increasing tariffs on goods imported from China. The "domino effect" was amplified by the failure of the Binance exchange, which triggered a new cascade of liquidations.
According to the chart, Bitcoin broke through most of the support zones, but the decline stopped and the price closed in the range of $116,000-$111,600. This is where the buyer showed strength and absorbed the majority of the seller's activity.
💼 WHAT WILL HAPPEN: OR NOT?
After significant corrections, bitcoin often enters the sideways phase for 1-2 weeks. However, there are already signs of recovery.
At the moment, we’re trying to gain a foothold above the volume zone of $113,700-$110,600 (maximum volumes), there are practically no significant volumes above it that could provide resistance. It’s difficult to say how the price will react in this range. But, most likely, we’ll see another wave of sales in the near future — there are no obvious signs of a reversal yet.
If there is a reaction from the mentioned zone, a long on recovery with a target range of $120,900-$124,000 (volume zone) can be considered.
Buying zone:
$113,600–$110,600 (high-volume area)
Selling zone:
$120,900–$124,000 (volume zone)
📰 IMPORTANT DATES
Macroeconomic events this week:
• October 14, Tuesday, 6:00 (UTC) — publication of the German Consumer Price Index for September;
• October 14, Tuesday, 16:20 (UTC) — speech by Federal Reserve Chairman Jerome Powell;
• October 15, Wednesday, 12:30 (UTC) — publication of the US Core Consumer Price Index for September and in comparison with September 2024;
• October 16, Thursday, 6:00 (UTC) — publication of the UK's GDP for August;
• October 16, Thursday, 12:30 (UTC) — publication of the volume and core index of retail sales, the US producer price index for September, as well as the number of initial jobless claims in the US and the Philadelphia Fed's manufacturing activity index,
• October 17, Friday, 9:00 (UTC) — publication of the Eurozone's consumer price index for September;
• October 17, Friday, 12:30 (UTC) — publication of the average hourly wage, changes in the number of non-agricultural workers, and the unemployment rate in the United States for September.
*This post is not a financial recommendation. Make decisions based on your own experience.
#analytics
Will Bitcoin Able to Breakdown Below $111,950?On the daily timeframe, Bitcoin CRYPTOCAP:BTC is showing signs of potentially forming a Double Top reversal pattern , indicating a possible trend shift from bullish to bearish. Should the price break below $111,950, Bitcoin could decline toward the $104,320 range, which also coincides with a fair value gap area.
Although the liquidation map from Coinglass highlights liquidation clusters between $110,841 and $111,905, traders and investors are advised to remain cautious in anticipating Bitcoin’s volatile price movements.

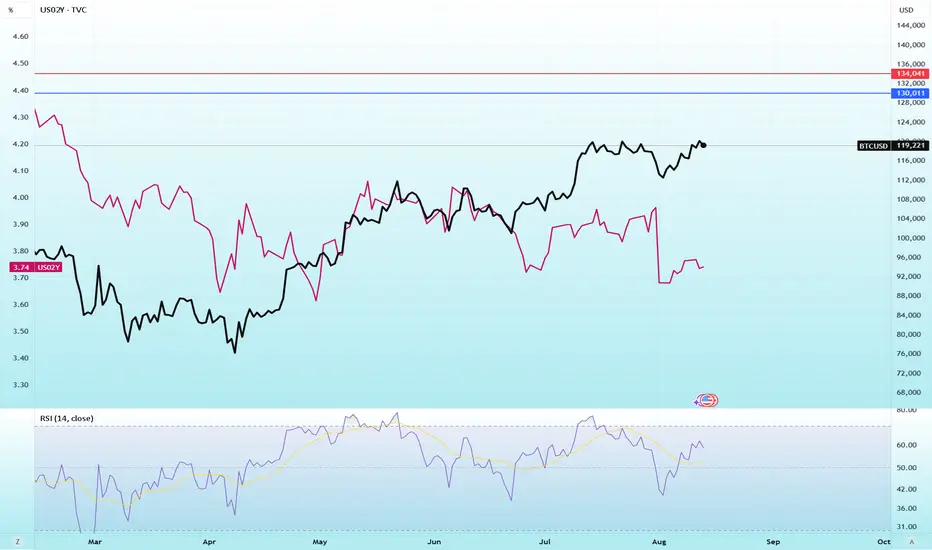
Declining 2-Year US Treasury Yields Could Fuel Bitcoin’s BullishThe follow chart is a comparison between Bitcoin CRYPTOCAP:BTC Daily Chart and the US 2 years Treasury Bonds TVC:US02Y .
The graphic shows the 2-year US Treasury yield declining from 3.7684% to 3.7308% on August 12, 2025, following a steep drop after CPI inflation in July stabilized at 2.7%. This underscores market expectations that the Federal Reserve will lower interest rates, driving up demand for bonds as a safe haven asset.
The potential on Short-Term Impact on the Bitcoin Market:
Positive: Falling rates and expectations for rate cuts weaken the US dollar, boosting capital flows into riskier assets such as Bitcoin. BTC may gain in the immediate term, testing the $130,000 resistance level, aided by new liquidity from stablecoins.
Risk: While falling yields can support Bitcoin’s bullish momentum, they may also signal recession fears. If investors interpret the decline as a warning of economic slowdown, BTC could face selling pressure—potentially dropping to $111,939. Volatility remains elevated, especially after the recent liquidation of leveraged long positions. Keep an eye on upcoming economic data for confirmation of market direction.
Analytics: market outlook and forecasts
📈 WHAT HAPPENED?
At the beginning of last week, Bitcoin reached the resistance level of $115,000-$116,300 (a mirror volume zone) and experienced a quick correction. However, at this level, there was a strong absorption of sales, as the volumes clearly indicated active buys, and by Wednesday, the focus shifted towards long positions.
The only surprise was a slight stop in the $117,600-$118,600 zone (accumulated volumes). In general, we passed it with almost no resistance, which is a sign of buyer strength.
An additional catalyst for growth was President Donald Trump's executive order on August 7, which allows Americans to invest in cryptocurrency through their retirement accounts. This decision could pave the way for a multibillion-dollar influx of new funds into the cryptocurrency market.
💼 WHAT WILL HAPPEN: OR NOT?
Now we’re almost close to the ATH, but at the moment there is a small resistance in the range of $121,500-$122,300. It’s not yet clear in which direction the volume will move, but in case of a breakout of the ATH, this zone can become the nearest support in the case of a correction.
If sells are activated at the current levels, it’s worth paying attention to the level of ~$120,000 (pushing volumes). In this case, a local sideways movement is possible between the level of ~$120,000 and the zone of $122,300-$121,500.
Buy Zones:
~$120,000 (pushing volumes)
$117,500–$116,000 (accumulated volumes)
$115,300–$114,000 (accumulated volumes)
📰 IMPORTANT DATES
On macroeconomic events this week:
• August 12, Tuesday, 12:30 (UTC) - publication of the basic consumer price index (CPI) of the United States for July, as well as in comparison with July 2024;
• August 13, Wednesday, 6:00 (UTC) - publication of the consumer price index (CPI) of Germany for July;
• August 14, Thursday, 6:00 (UTC) — publication of the UK's GDP for the second quarter and for June;
• August 14, Thursday, 12:30 (UTC) — publication of the number of initial unemployment claims and the US producer price index (PPI) for July;
• August 14, Thursday, 23:50 (UTC) — publication of Japan's GDP for the second quarter;
• August 15, Friday, 12:30 (UTC) — publication of the volume and base index of US retail sales for July.
*This post is not a financial recommendation. Make decisions based on your own experience.
#analytics

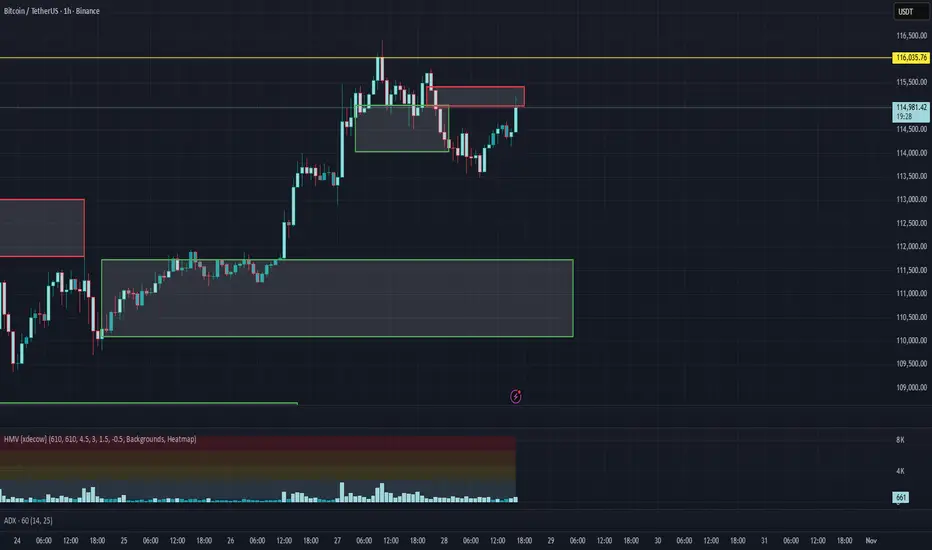
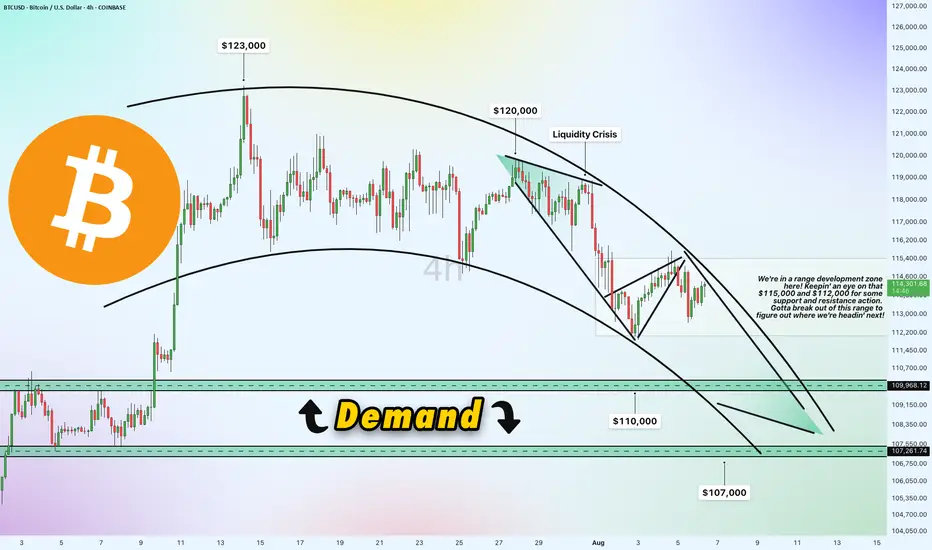
Bitcoin 4h Chart Update [Tight Range / Breakout Opportunities]Breakout Opportunities
We're in a range development zone here! The chart shows Bitcoin (BTC/USD) trading within a tight range, with key levels at $115,000 and $112,000 acting as critical support and resistance zones. The price recently peaked near $123,000 but has since pulled back, forming a liquidity crisis zone around $120,000 where selling pressure kicked in. A breakout above $115,000 could signal a move toward $120,000 or higher, while a drop below $112,000 might push it toward the demand zone. Gotta break out of this range to figure out where we're headin' next!
Demand Zone
$110,000 & $107,000
Price slipped down from $120,000 due to a lack of buying liquidity, potentially it will land into a demand zone between $110,000 and $107,000. This area could act as a strong support level where buyers might step in. If the price holds here, it could bounce back toward the $112,000-$115,000 range. However, a failure to hold this zone might see it test lower support around $107,000 or even $105,000.
Direction and Possible Ranges
Upward Potential: If Bitcoin breaks above $115,000 with strong volume, the next targets could be $120,000 (liquidity crisis zone) and potentially $123,000, aligning with recent highs. A sustained move above $120,000 might open the door to $125,000 or beyond.
Downward Risk: Should the price fail to hold above $112,000 and break below, it could slide into the demand zone ($110,000-$107,000). Further weakness might push it toward $105,000, a psychological and technical support level.
Current Trend: The chart shows a descending trendline from the $123,000 peak, suggesting bearish pressure unless a decisive breakout occurs. The 4-hour timeframe indicates indecision, with the range-bound action hinting at a potential volatile move once direction is confirmed.
Keep an eye on these levels for the next big move!
BTC/USDT Analysis – Negative Sentiment Returns
Hello everyone! This is the daily analysis from the trader-analyst at CryptoRobotics.
Yesterday, Trump officially imposed tariffs on 68 countries, which are set to take effect on August 7. The legality of these tariffs is already being challenged in court. The market reacted extremely negatively to this development — despite the overall positive technical setup and volume distribution, Bitcoin dropped to $114,000, deeply testing the volume zone and local lows.
Despite all of this, the bullish scenario should not be ruled out. The price action during the decline has been weak: while selling pressure is high, it has not led to a full breakdown of the lows. At this stage, it’s better to avoid opening new positions. Consider long setups only after a test of the $117,600–$118,600 supply zone, and watch for a buyer’s reaction on the retest.
If negative momentum continues, the price could drop further to the next support zone.
Buy zones:
• $110,000–$107,000 (accumulated volumes)
Sell zones:
• $117,600–$118,600 (accumulated volumes)
This publication is not financial advice.
