BTC/USDT Analysis. Attempts to Break the Global Range
Hello everyone! This is the CryptoRobotics trader-analyst. Due to the holiday period, we temporarily paused daily updates, but now we are back with regular weekday analysis.
Ahead of the New Year, Bitcoin spent an extended period trading within a range. As previously mentioned multiple times, the breakout potential was directed toward the upper boundary of this range — and this scenario began to materialize.
On January 2, we observed a local “Santa rally” and a move toward the higher-timeframe resistance zone at $94,000–$97,500, from which a subsequent downward movement developed.
At the moment, after testing the now-mirror support zone around $90,000, the market received a strong reaction: selling pressure was absorbed, and buying activity resumed.
We are currently considering a move toward the newly formed resistance at $92,000–$93,000, where previous buying absorption and seller activity were observed. This zone is now ключевая:
— a confident breakout and consolidation above it would open upside potential toward $100,000;
— strong resistance and failure to break higher could intensify the pullback and return the market to a range-bound structure. In this case, the primary downside target would be the $88,400–$87,000 zone, where significant accumulated volume is located.
Buy zones:
• $88,400–$87,000 — accumulated volume
• $86,000–$84,800 — anomalous activity
• $84,000–$82,000 — strong volume anomalies
Sell zones:
• $92,000–$93,000 — buying absorption, seller activity
• $101,000–$104,000 — accumulated volume
This publication is not financial advice.
Bitcoinoverview

Analytics: Market Outlook and Forecasts
📈 WHAT HAPPENED?
Last week, amid a record drop in gold on October 21, Bitcoin entered a phase of increased volatility. Initially, the asset experienced a ~5.5% increase, forming a strong volume anomaly, before returning to its initial levels.
After a sharp reversal, we anticipated a local uptrend and a short bounce from the seller's anomaly. However, we only observed a minor short movement, which was absorbed by the buyer.
💼 WHAT WILL HAPPEN: OR NOT?
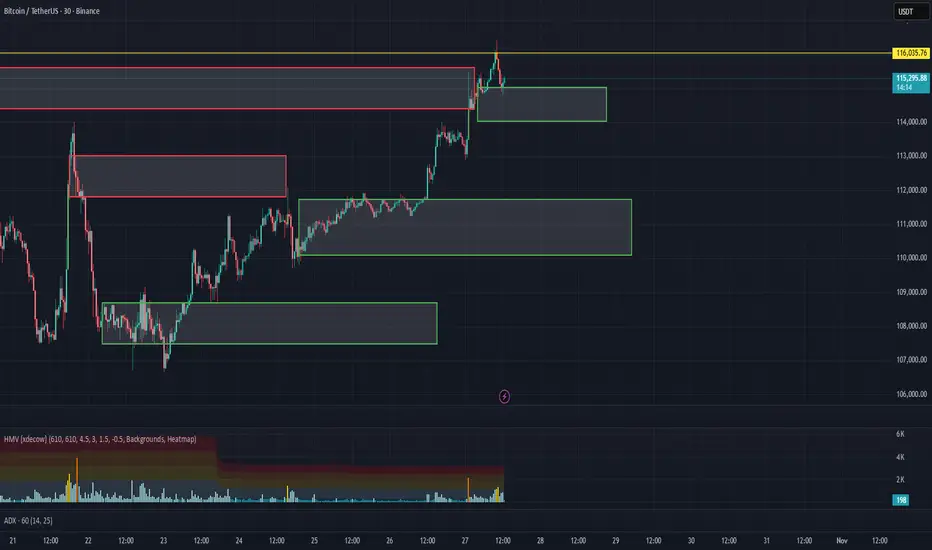
We’ve reached an important level, which is now being tested. Given how easily the market passed strong resistance, the mood remains bullish.
The main expectations: break after a local retest of the $115,000-$114,300 range (buyer activity by delta) or test the next buyer zone before resuming growth. The target for the movement is the $120,000 mark.
Buy Zones:
$115,000–$114,000 (local delta activity),
$111,700–$110,000 (accumulated volumes),
$108,700–$107,500 (volume zone),
$105,600–$104,500 (volume anomalies),
$97,000–$93,000 (volume zone).
Sell Zones:
$120,900–$124,000 (volume zone).
📰 IMPORTANT DATES
Macroeconomic events this week:
• October 27, Monday, 14:00 (UTC) — publication of data on new home sales in the United States for September;
• October 28, Tuesday, 14:00 (UTC) — publication of the US Consumer Confidence Index for October;
• October 29, Wednesday, 13:45 (UTC) — announcement of the interest rate decision in Canada;
• October 29, Wednesday, 18:00 (UTC) — FOMC statement and announcement of the US Federal Reserve's interest rate decision;
• October 29, Wednesday, 18:30 (UTC) — FOMC press conference;
• October 30, Thursday, 9:00 (UTC) — release of Germany's GDP for the third quarter of 2025;
• October 30, Thursday, 12:30 (UTC) — publication of the US GDP for the third quarter of 2025;
• October 30, Thursday, 13:00 (UTC) — publication of the German Consumer Price Index (CPI) for October;
• October 30, Thursday, 13:15 (UTC) — announcement of the deposit rate and the Eurozone interest rate decision for October;
• October 30, Thursday, 13:45 (UTC) — press conference by the European Central Bank;
• October 31, Friday, 1:30 (UTC) — publication of the Chinese manufacturing sector business activity index for October;
• October 31, Friday, 10:00 (UTC) — publication of the Eurozone consumer price index for October;
• October 31, Friday, 12:30 (UTC) — publication of the US personal consumption expenditure base price index for September.
*This post is not a financial recommendation. Make decisions based on your own experience.
#analytics
Analytics: Market outlook and forecasts
📈 WHAT HAPPENED?
Last week, Bitcoin reached the first sell zone at $112,400-$113,300 (local volume zone), from which we’ve already received a reaction twice.
During the last test of this zone, a large volume was formed, which was positioned in short. This indicates the potential for a decline to the level of $108,000. On the other hand, the untested liquidity beyond the $113,500 level suggests the opposite and acts as a "magnet" for the price.
Currently, we’re trading within a local range where market sales are being absorbed.
💼 WHAT WILL HAPPEN: OR NOT?
We anticipate a move towards the new zone of $112,200-$113,200 (volume zone), from which a short-term movement is likely to develop if there is a reaction.
The opposite scenario is a strong breakout of this zone during buyer activity. In this case, a test of the $114,400-$115,500 zone (volume zone) and the ~$116,500 level (volume anomaly) is likely.
In this scenario, the $112,200-$113,200 marks will become a mirror volume support zone, and the global long trend will resume.
Buy Zones:
$108,000–$102,500 (accumulated volumes)
Sell Zones:
$112,200–$113,200 (volume zone)
$114,400–$115,500 (volume zone)
~$116,500 (volume anomaly)
$117,200–$119,000 (accumulated volumes)
$121,200–$122,200 (buy absorption)
📰 IMPORTANT DATES
Macroeconomic events this week:
• September 10, Wednesday, 12:30 (UTC) - publication of the US Producer Price Index (PPI) for August;
• September 11, Thursday, 12:15 (UTC) - announcement of the Eurozone deposit rate for September and the Eurozone interest rate decision;
• September 11, Thursday, 12:30 (UTC) — publication of the US basic consumer price index and the number of initial jobless claims for August;
• September 11, Thursday, 12:45 (UTC) — press conference of the European Central Bank (ECB);
• September 12, Friday, 6:00 (UTC) — publication of the UK GDP for July and the German consumer price index for August.
*This post is not a financial recommendation. Make decisions based on your own experience.
#analytics

BTC/USDT Analysis — Buyer Weakness
Hello everyone! This is the trader-analyst from CryptoRobotics with your daily market analysis.
Yesterday, Bitcoin finally moved into a correction after forming resistance at $121,500–$122,300. There was no reaction at the nearest support around $120,000 (push volumes). Only at $119,000 did buyers attempt to step in — the delta suddenly turned positive — but for now, all buying attempts are being absorbed.
The scenario is currently highly mixed: on the one hand, wave analysis shows we are still in a strong bullish trend; on the other, volume spiked sharply at the top and is being positioned for shorts, while there was also no clear defense at support.
At this stage, we expect further correction either from current levels or after a retest of ~$120,000 (mirror zone). After that, we will watch for the buyer’s reaction at the lower support zone. This scenario will be invalidated if $120,000 is broken without any defense from sellers.
Buy Zones:
$117,500–$116,000 (accumulated volumes)
$115,300–$114,000 (accumulated volumes)
Sell Zones:
~$120,000 (mirror zone)
$121,500–$122,300 (volume zone)
This publication is not financial advice.

Analytics: Market Outlook and Predictions
📈 WHAT HAPPENED?
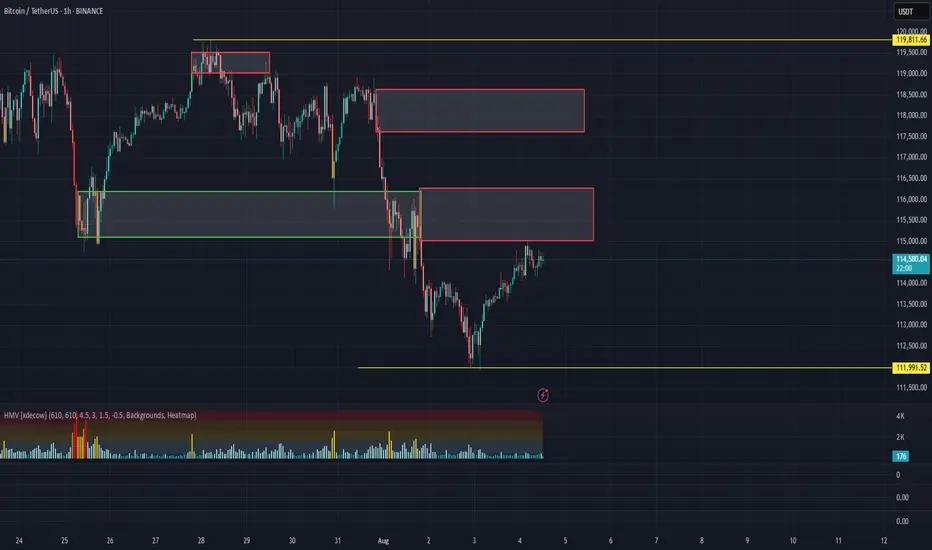
Last week, US President Donald Trump once again "shook up" the financial markets.
The report published by the White House was received positively and contributed to the recovery of the Bitcoin price. But soon after, new import duties were introduced, which changed the short-term trend of the first cryptocurrency to a downward one. Unfortunately, no one is immune to FUD.
The local minimum was recorded at $112,000, after which the price rebounded slightly, but didn’t reach the key zone of $110,000-$107,000 (accumulated volumes).
💼 WHAT WILL HAPPEN: OR NOT?
Currently, buyer activity remains weak, with significant volumes concentrated above the current price, and no active demand at the local lows. Another wave of sales is likely from the $115,000-$116,300 zone to the formed low of $112,000.
On the other hand, wave analysis shows the weakening of sellers. The market has already absorbed the last wave of sales, and there was a break on the hourly timeframe. With the growth of buying volumes, a rebound to the nearest volume resistance is possible. However, we’ll most likely not be able to do without strong sales, and we’re highly likely to see Bitcoin at $110,000.
Buy Zones:
$110,000–$107,000 (accumulated volume)
Sell Zones:
$117,600–$118,600 (accumulated volume)
$115,000–$116,300 (mirror volume zone)
📰 IMPORTANT DATES
Macroeconomic events that we’re following this week:
• Tuesday, August 5, 13:45 (UTC) — publication of the business activity index (PMI) in the US services sector for July;
• Tuesday, August 5, 14:00 (UTC) — publication of the US Non-Manufacturing Purchasing Managers' Index (ISM) for July;
• Thursday, August 7, 11:00 (UTC) — announcement of the UK interest rate decision for August;
• August 7, Thursday, 11:30 (UTC) — publication of the Bank of England's letter on UK inflation;
• August 7, Thursday, 12:30 (UTC) — publication of the number of initial jobless claims in the United States for August.
*This post is not a financial recommendation. Make decisions based on your own experience.
#analytics
BTC/USDT Analysis: Watching the Reaction at the HighHello everyone! This is a daily analysis from the trader-analyst at CryptoRobotics.
Yesterday, Bitcoin finally broke out of the range to the upside. The local selling zone at $96,100–$96,600 didn’t show any reaction. On the retest, it acted as a mirror level and supported continued growth.
At the moment, the local bias has shifted. All major volume clusters are now located below the price, so we can expect a new high. If we break through the current high, it’s important to watch the sellers' reaction. A false breakout could lead to a significant drop, but if it doesn't happen, the next potential target is $105,000.
Sell zones:
$98,000 (key level)
$107,000–$109,000 (volume anomalies)
Buy zones:
$91,500–$90,000 (strong buy-side imbalance)
$88,100–$87,000 (absorption of market selling)
$85,500–$84,000 (accumulated volumes)
$82,700–$81,400 (volume zone)
$74,800 (key level)
$69,000–$60,600 (accumulated volumes)
What do you think — which scenario will play out?
Drop your thoughts in the comments — it's always interesting to compare views!
This publication is not financial advice.
