BTC - Short - 3 Wave Correction Bitcoin Short signal with a lower entry for those that didn’t catch the last top.
3 simple targets.
Entry - 111,900-112,000
Stop Loss - 116,400
Target 1 - 85,000
Target 2 - 36,000
Target 3 - 10,000
Buckle in.
- DD
Bitcoinprediction

Bitcoin Breakdown | BPR Rejection Could Trigger Deep Sell-OffHello Billionaires!!
We All know that BTCUSD is showing classic Smart Money Distribution after a clean BPR rejection in the premium zone.
Price swept the Buy Side Liquidity (TS) and tapped into the BPR, confirming bearish order flow. Now, we’re likely to see a continuation down toward the FVG & OB below 106K–102K, targeting the SSL zone.
📉 Smart Money Storyline:
BSL taken ✅
BPR tapped (Premium Delivery) ✅
Bearish continuation setup forming 🔥
Possible drawdown into FVG & OB before new accumulation
💡 If BTC holds below the BPR zone, expect strong downside liquidity runs in the coming days.
#BTCUSD #AliyanFX #SmartMoneyConcepts #ICT #PriceAction #Liquidity #BPR #OB #FVG #Forex #TradingViewIdeas #CryptoAnalysis

Bitcoin Parallel Channel Master Analysis🟦 Parallel Channel Overview
The chart reveals a well-established ascending parallel channel, guiding Bitcoin’s price action over an extended period.
The upper and lower bounds have been respected multiple times, validating the strength and consistency of this trend structure.
Price currently hovers near the midline, following a bounce from the lower boundary, indicating the channel remains intact and bullish momentum is supported.
🧭 Current Price Action
A recent dip tested the lower boundary and was met with strong buying interest — a bullish sign.
Price is now pressing up against the midline, which acts as a crucial pivot:
A successful flip of the midline to support could propel the price toward the upper channel boundary.
A failure here may trigger another retest of the lower support.
📌 Key Structural Levels
Lower Channel Support: The primary demand zone; a breakdown here could suggest a broader structural change.
Midline (Median): The dynamic pivot — the battleground for bulls and bears.
Upper Channel Resistance: Where profit-taking or breakout acceleration typically occurs.
🔁 Repeating Breakout Pattern: Timeline & Insights
🔹 1st Breakout – February 2024
Price breaks above the channel and sets a new high.
Eventually retraces back into the channel.
In August 2024, the break out area from February becomes midline support, validating the zone.
🔹 2nd Breakout – November 2024
Another breakout occurs, reaching a peak roughly equal to the first breakout.
In April 2025, price once again retests the midline, mimicking the previous August retest behavior.
🟡 Pattern Recognized
Breakout → Peak → Pullback to Midline Support → Reaccumulation → Breakout
With this repeating structure, a 3rd breakout is likely, assuming midline support holds.
Based on historical intervals:
Feb to Nov 2024 = ~9 months
Aug to Nov = ~3 months
This positions the next breakout for June 2025, following the April retest.
🔮 Projected Outcome: 3rd Breakout
If the vertical breakout range repeats:
3rd breakout peak could mirror the height of previous breakouts.
⚖️ Summary & Strategic Implications
✅ Structure is bullish as long as Bitcoin trades within or above the channel.
✅ Midline bounces have reliably preceded breakouts — current April 2025 retest strengthens that thesis.
✅ June 2025 becomes a critical breakout watch window.
❌ Break below the midline would invalidate the repeating breakout structure and shift focus to lower support zones.

BITCOIN !!!Hello friends
Given the good decline we had, a good opportunity was provided to buy at good prices with capital and risk management and in steps and move to the specified goals.
There was good liquidity at the bottom that was collected, now we can expect a good growth.
*Trade safely with us*

BTC Pullback: Key Support at $99,800 – Next Move?#Bitcoin is currently experiencing a pullback, likely triggered by news, such as President Trump’s tariff announcement on China.
The price is hovering around $110,500, but it doesn’t look strong enough to hold at this level, so a move toward $99,800 is possible. The 0.5 Fibonacci retracement at $99,800 acts as a key demand zone. However, the RSI isn't oversold yet, which means there’s potential for further downside if this support breaks.
In my opinion, the best approach right now is to wait for some confirmation.
Stay tuned and follow for more updates, and if you're stuck in any coin, feel free to DM me I’ll do my best to help you out.
CRYPTOCAP:BTC BITSTAMP:BTCUSD BINANCE:BTCUSDT

#BITCOIN ANALYSIS I have been warning you for the last 45 days #BITCOIN ANALYSIS
I have been warning you for the last 45 days that a big dump was coming and now it’s playing out exactly. Bitcoin has already dumped around $20K and is now trading near 112K, right at the major resistance zone that has triggered every big correction since 2018.
A small bounce to 115K–116K is possible, but after that I expect another leg down toward 100K, and potentially lower to 90K.
I’m still holding my 50% short position. If anything changes or I close my position, I’ll update you. Remember I mentioned earlier that if BTC went back to 125K–128K, I would add more shorts and that plan hasn’t changed.
Till Monday, I expect some volatility, but Monday’s price action will give a clearer direction.
🔸 Weekly:
BTC touched the long-term trendline again → clear rejection happened.
👉 Until we get a weekly close above 125K, the risk of a major pullback stays high.
BITSTAMP:BTCUSD
🔸 Daily:
Price is inside the 110K–125K supply zone. Structure is weak.
If price breaks and resists below 110K, then 100K is the next target.
📊 My Trade:
✅ First target 105K hit
Holding 50% shorts, expecting a bounce to 115K, then lower.
📌 Downside Targets: 105K ✅ → 100K → 95K → 90K

$BTC : Bitcoin's Momentum Just Hit A Wall! - 10/10/2025CRYPTOCAP:BTC ’s decline kicked off at $123,558.18, and momentum is fading fast.
If the rebound from $107K to $115K holds, it may mark the completion of waves (e, e, and X)—setting the stage for wave Z, which could unfold rapidly to complete the setup.
Projected targets for wave Z are charted. Let’s see how this plays out! ⚠️📉
#Bitcoin #BTC #ElliottWave #CryptoAnalysis

BTC - Short Trade Update All is going to plan here. A good DCA entry for the short would be 116,800 zone
Expecting a drop straight to 35,000 from here.
This will definitely happen. At the risk of sounding insane, I have zero doubts about it.
Good luck to everyone.
- DD

BTC/USD Bullish Reversal Setup from Demand Zonea potential bullish retracement setup on Bitcoin (BTC/USD) in the 1-hour timeframe. After a strong bearish move, price entered a highlighted demand zone, suggesting a possible short-term reversal. The projection shows a rebound from this support area toward Target 1 (118,472) and Target 2 (119,404), with a Stop Loss positioned below the recent swing low at 115,628.

BITCOIN SIGNAL: NEXT TARGET REVEALED!! (scary) Yello Paradisers! Enjoy the video!
And Paradisers! Keep in mind to trade only with a proper professional trading strategy. Wait for confirmations. Play with tactics. This is the only way you can be long-term profitable.
Remember, don’t trade without confirmations. Wait for them before creating a trade. Be disciplined, patient, and emotionally controlled. Only trade the highest probability setups with the greatest risk to reward ratio. This will ensure that you become a long-term profitable professional trader.
Don't be a gambler. Don't try to get rich quick. Make sure that your trading is professionally based on proper strategies and trade tactics.

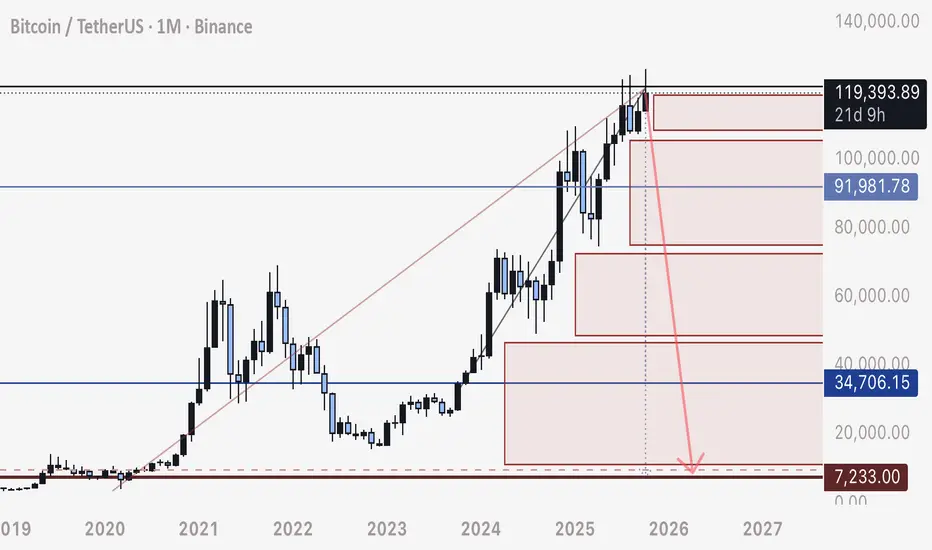
Why BTC will drop at EXTREME SPEED to 8,000This is a Segway off of all my recent posts, and here we will apply the same understanding of stop loss and liquidation order blocks to the 1 Month.
Bitcoin has been moving in a straight upwards consolidation with no actual retrace since Dec 2022.
What this does, is attract mass amount of stop loss orders, intact and left in place, through the whole movement.
These stop loss orders will create a natural cascading drop as they all fill, exponentially moving more and more liquidity out of BTC and into USD/ USDT.
Bitcoin will drop, at exceptional speed, and the chart tells us the whole story.
Be safe.
- DD
BTC/USDT Analysis. Will longs resume pt.2?
Hello everyone! This is CryptoRobotics trader-analyst, and here’s the daily market overview.
Yesterday, our main scenario on Bitcoin played out — the price dropped to the buying zone at $120,400–$119,400 (selling absorption) and showed an initial reaction.
At the moment, there’s abnormal activity from a limit buyer, who continues to absorb most of the market selling. However, market buyers are not yet taking initiative, keeping the market in an accumulation phase.
We expect a retest of $120,600 (local buyer aggression) or a sweep of the local low. If a strong reaction appears, long positions with a favorable risk-to-reward ratio can be considered.
It’s quite possible that from this level we’ll see a renewed wave of buying and a move toward the all-time high.
Buy zones:
$120,600 (local buyer aggression)
$116,700–$115,000 (pushing volumes, strong graphical imbalance)
$112,500–$111,500 (mirror zone, volume anomalies)
$110,000–$108,800 (strong selling absorption)
This publication is not financial advice.

Bitcoin Bullish Scenario: Bitcoin Bullish Scenario:
*Expecting price to retrace to 50% of current daily trend range and bounce back to may another All time High.
*Purple area is Support for current bullish trend.

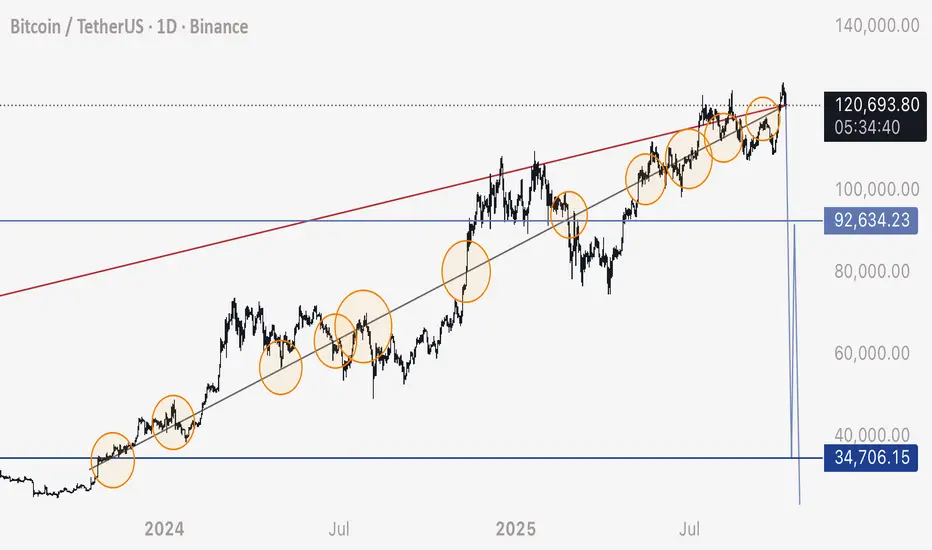
BTC - Explanation of My 35,000 Drop Prediction Here is a broken down explanation of why I’ve been predicting Bitcoin dropping to 35,000
1. We can see this diagonal ascending trendline and how price has been respecting it by looking at the various contact points circled in orange.
2. Bitcoin has been consolidating on either side of this trendline since the beginning of it.
3. Liquidity has been building and building in the form of sell orders / long stop losses all the way down as price has made no substantial recovery of these zones.
4. Eventually Bitcoin will stick it as resistance and as soon as those order blocks are hit, there is enough orders in place (stop losses and liquidations) to drop the price to 35,000 in a very short time period. Essentially, the limit orders are in place like a staircase all the way down, they will fill one after the next and the chart has all the fuel and propellant needed to make a wick to that level.
5. The only reason we would see price consolidate so truly to a bearish line like this is to attract buys and longs as it slowly moves up - this mechanic of the market makes it not only possible but highly likely to happen and we don’t need any sort of black swan or bad news. The orders are ready to set off.
6. This is way more likely than people seem to think. Every long opened has a stop loss order or liquidation order for the entire position size. We can CLEARLY see, just by looking at the chart, these wide open gaps on the chart are filled with these orders. They have been left intact PURPOSELY in order to design a natural, fast wick of a movement.
7. This wick will reclaim all of the market makers and liquidity providers liquidity to them, and de-leverage all open positions.
I truly believe this will happen exactly as I say it will.
- Drop to 35,000
- Very fast drop (2-12 hours for the whole movement - if not, 1 hour)
I’d encourage readers to at least be mindful of the rational behind this analysis and take proper precautions to protect yourselves.
Respectfully,
- DD
Bitcoin Roadmap Before FOMC Minutes – Correction or New ATH?Today, we have one of the most important macro events — the FOMC Meeting Minutes
Let’s quickly understand what it is and why it could shake the crypto market
What are FOMC Minutes?
They’re the detailed notes from the last Federal Reserve meeting, showing what members discussed about interest rates, inflation, and the economy.
Markets carefully read every line to find hints about future rate cuts or continued tightening.
Why does it matter for Bitcoin?
When the Fed turns dovish (hinting at lower rates), risk assets like Bitcoin usually rally But when the tone is hawkish (worried about inflation), investors move to cash or bonds, causing crypto to dip.
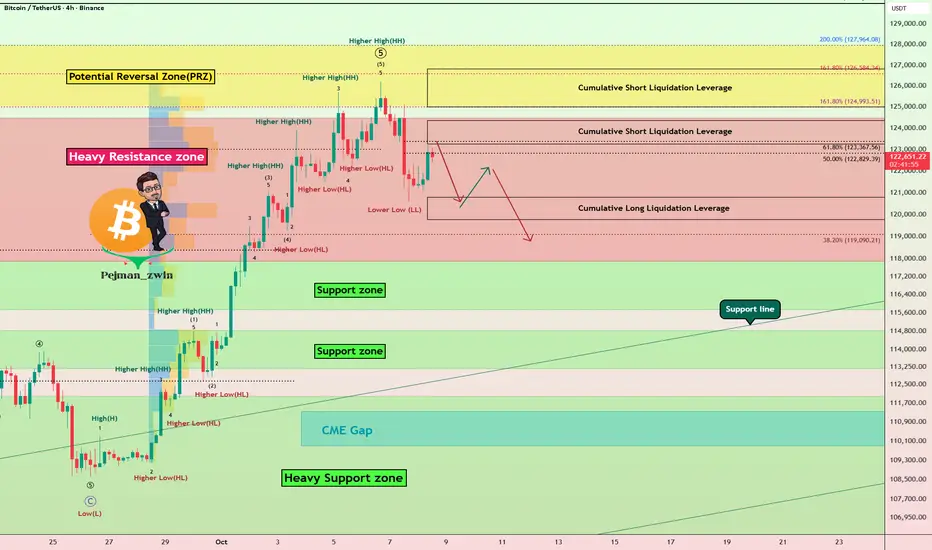
Let’s take a look at Bitcoin ( BINANCE:BTCUSDT ) on the 4-hour timeframe .
Before analyzing the chart, let’s quickly review what defines a strong uptrend :
1-Higher Lows(HL):
Each new low should form above the previous one, showing that buyers are stepping in earlier each time.
2-Higher Highs(HH):
Each new high should be higher than the last, confirming that bullish momentum is still in control.
3-Structure Respect:
The new low should not break below the previous high — if it does, it doesn’t necessarily mean the trend is over, but it indicates a weakening of the bullish structure.
Based on the points above, Bitcoin failed to form a new Higher Low(HL) during the past 24 hours, and the previous high was retested .
These signals indicate a loss of bullish momentum, suggesting that we might see at least a short-term correction from a technical perspective.
Bitcoin has already started to bounce back nicely from the Potential Reversal Zone (PRZ) and is currently trading in a Heavy Resistance zone($124,474-$117,900) .
In terms of Elliott Wave theory , it seems that with the formation of a Lower Low(LL) , Bitcoin has completed at least a series of impulsive waves , and we can now expect corrective waves .
I expect Bitcoin to drop to at least Cumulative Long Liquidation Leverage($120,779-$119,957) before the FOMC Meeting Minutes start and could continue to rise or correct depending on the tone of the FOMC Meeting Minutes .
Note: You should note that these days, Bitcoin has a higher correlation with the SPX500( SP:SPX ) index than before, so if there is a sudden movement in Bitcoin, one of the reasons could be a sudden movement in the SPX500.
Do you think this bullish move could lead to a new all-time high (ATH) for Bitcoin again!?
Cumulative Short Liquidation Leverage: $124,350-$123,244
Cumulative Short Liquidation Leverage: $126,813-$125,000
CME Gap: $111,355-$109,915
Please respect each other's ideas and express them politely if you agree or disagree.
Bitcoin Analysis (BTCUSDT), 4-hour time frame.
Be sure to follow the updated ideas.
Do not forget to put a Stop loss for your positions (For every position you want to open).
Please follow your strategy and updates; this is just my Idea, and I will gladly see your ideas in this post.
Please do not forget the ✅' like '✅ button 🙏😊 & Share it with your friends; thanks, and Trade safe.
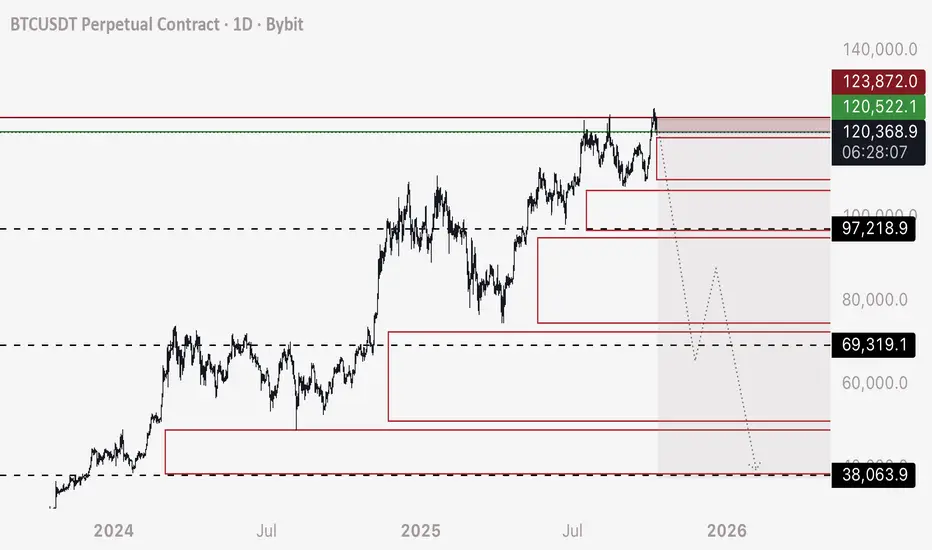
BTC - Short a Stop Hunt and Stay on the Right SideI’m breaking my larger idea down into multiple trades, now that others are opening up to the reality that it’s possible.
These order blocks shown are filled with long position stop losses, leveraged sell orders that only fill when price crosses over - and will set off like a chain reaction.
This will create a very fast drop IE Stop Hunt - and we can take advantage of it.
TRADE 1 - SHORT
Entry - 120,200 to 120,500
Stop Loss - 123,800 (although I don’t see Bitcoin rising back above 121,000 before this trade completes)
Target 1 - 97,250 (Close 25% of trade)
Target 2 - 69,400 (Close 50% of trade)
Target 3 - 38,100 (Close 40-90% of trade as it’s possible we continue to drop and don’t retrace from here to 90,000 appx)
I’ll be logging this trade.
All the best and buckle in.
- DD
Bitcoin STRONG Weekly Bounce - What's Next?Hello BTC Watchers 📈
📢 Bitcoin was trading right on top of a crucial support zone. But the price has successfully bounced in the weekly and made a strong comeback from the support zone.
The weekly moving averages
The daily moving averages
This is telling for a number of reasons. In the weekly we see a strong bounce above the moving averages as well as in the daily, and in the daily we had just bounced back from a correction which took us to the 100d MA (which is the general zone for a correction, or at least a wick towards that area. This indicate that in the short and longer term, the chart is looking up and bulls are in control.
What are you thoughts, new ATH or just a fakeout?

BTC/USDT Analysis. Will longs resume?
Hello everyone! This is CryptoRobotics trader-analyst, and here’s the daily market overview.
Yesterday, after we highlighted the absorption pattern on Bitcoin, the price slightly recovered and entered sideways consolidation, holding within the range for nearly a full day. The initial target at $124,000 was reached earlier than expected, but it formed the upper boundary of the current range.
At the moment, Bitcoin continues rotating within this range. The main expectation is a test of the local low and the buying zone at $120,400–$119,400 (selling absorption). If strong buying protection appears there, the potential will be aimed toward the all-time high.
If the reaction is weak or absent, we may see a decline toward ~$116,000.
Buy zones:
$120,400–$119,400 (selling absorption)
$116,700–$115,000 (pushing volumes, strong graphical imbalance)
$112,500–$111,500 (mirror zone, volume anomalies)
$110,000–$108,800 (strong selling absorption)
This publication is not financial advice.

Forecasting the Cycle High... And Next Bear Market Low?This is an interesting study I originally did 2 years ago.
What started as a conversation with a student, who asked me if we could somenow 'project the next Bear market low'...
It got me thinking, and experimenting.
In this video I share the nearly 'accidental' discovery we made, and I think people might finding interesting (albeit pure speculation and most probably wrong).
Any comments welcome.
PS> Apologies for the rambling, it's been a long day.

Bitcoin Cup and Handle Pattern!BTCUSDT technical analysis update
BTC is forming a cup and handle pattern on the weekly chart. The price is currently forming the handle, which could take 1-2 months to complete. Once the price breaks the neckline, we can expect a significant bullish move in BTC.
Regards
Hexa

BTCUSD – 30M | Bullish Continuation Expected BITSTAMP:BTCUSD
Structure | Trend | Key Reaction Zones
Market recently tapped into strong demand zone (120,400–120,800) after a clean supply rejection.
Clear liquidity grab above highs followed by a deep correction to retest demand base — structure still bullish overall.
Market Overview
BTC has completed its corrective phase and is now reacting strongly from the demand box, suggesting potential continuation towards 123,000–125,000 if buyers sustain momentum. Price respecting the structure beautifully — accumulation signs visible again.
Key Scenarios
✅ Bullish Case 🚀 →
🎯 Target 1: 123,400
🎯 Target 2: 124,800
🎯 Target 3: 125,700 (supply zone retest)
❌ Bearish Case 📉 →
Invalidation below 120,000 (strong demand break).
Current Levels to Watch
Support 🟢: 120,400–120,800
Resistance 🔴: 123,400 / 125,700
⚠️ Disclaimer: This analysis is for educational purposes only. Not financial advice.

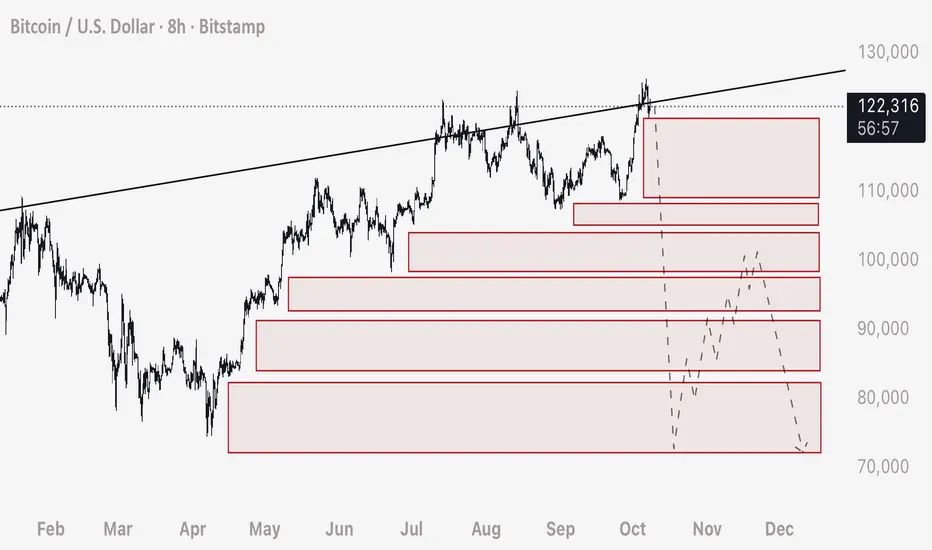
Using Order Blocks to Predict Price Movement on HTFExpanding on my previous post, we can apply this technique to predict price movement on the higher time frames (8 Hour in this case).
Step 1 - Drawing the Boxes
- Fundamentally what we want to do, is look at the price movement and figure out where clusters of stop loss would be contained.
- To do this, we want to look for the areas of upwards (in this example) consolidation that hasn’t dropped down to trigger the orders.
- I have drawn boxes here close to the candle set, and extended them out past where price currently is to prove that these areas have not been reclaimed or had the stop loss orders triggered.
PLEASE NOTE: Stop Loss orders and Liquidation Orders are very unique. Unlike limit orders that will automatically fill if price is above or below, these orders do not fill unless price CROSSES the exact price of the order. In essence, it’s important to understand that looking back on the chart we can understand there are limit orders for sells (in this example) that’s below the current price. If a limit sell order was to be placed at a lower price, it would fill automatically if price is above.
- We can anticipate a take profit (locally in this example) at 74,000. SHORT entry should be where the orders begin to set off to a large degree, in this example, entry would be BELOW where price currently is, at 122,200. We want to make sure that the stop loss orders will be enough to carry the price through these blocks. Stop loss can be places above the local wick high (where the SHORT stop losses have already been filled) at 123,900.
Step 2 - Predicting and Understanding Wick Speed
- To predict how fast the movement will complete, we need only evaluate the amount of TIME allowed for positions to be placed (longs in this example). Very simply because the more time provided to traders in an upwards consolidation, the more positions and consequently stop losses and liquidations will be placed below the price.
- More TIME = More Orders = Faster Wick Speed. To understand this another way, imagine there was 2 scenarios where regular limit buys were placed. Scenario 1 has 100 people placing buy orders, Scenario 2 has 10,000 people placing buy orders. Scenario 2 would move price higher at a faster speed, and to a greater distance. In other words we are predicting VOLUME of STOP LOSS ORDERS.
PLEASE NOTE: Stop Loss orders move price at a greater volume compared to the position entry. If Trader A uses $1,000 to open a Long, and uses a leverage of 10x - his Stop Loss or Liquidation order is to close the entire leveraged position size. While he is injecting $1,000 of liquidity into the market with his order, he is consequently leaving a sell order underneath his entry for $10,000 (leveraged position size).
PLEASE NOTE: The placement and amounts contained in stop losses or liquidations are not available to the public. Exchanges do not need to disclose that information, and you can assume it’s only shared with the market makers or liquidity providers. Heatmap Platforms such as Coinglass have disclaimers that state it’s not based on true date and is only a prediction.
SUMMARY:
I hope this serves you with a practical demonstration of how we can use Stop Loss analysis to predict price movement.
I also hope that you can understand you’re able to do this yourself by developing the vision to quickly see it in the chart. We are blessed in that we simply need to look backwards to see where we will be going next, as the orders that move Bitcoin are previously embedded in the chart.
Yours truly and all the best,
- DD
If you have any questions or want further clarifications - please ask in the comments and I will answer you.
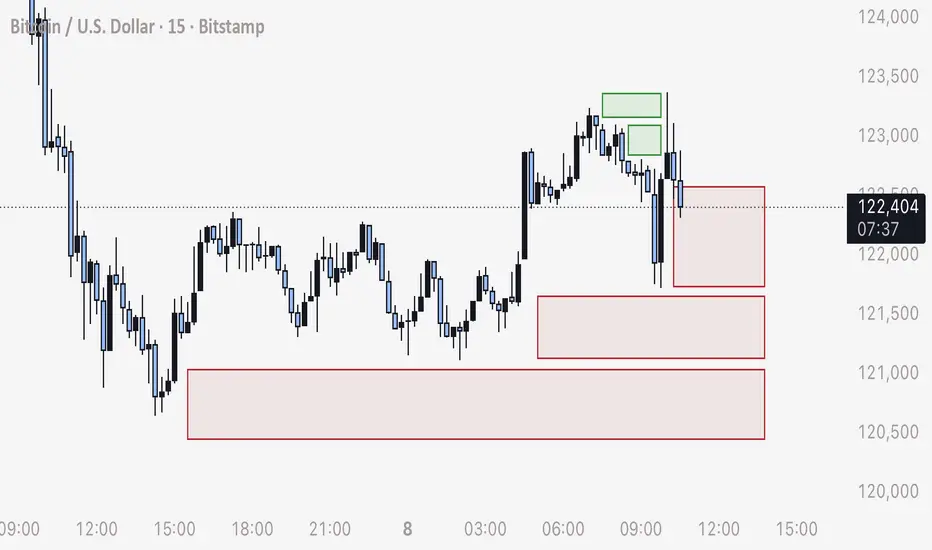
BTC - Practical Example of Trading Order Blocks / Stop HuntsHere is a very practical, recent example of trading the reaction of BTC hitting stop loss order blocks and how price moves.
Green Boxes:
- Note that price moves in a slow, downwards consolidation
- This slow drop allowed time for traders to enter shorts, consequently leaving stop loss orders for the entire position size
- The price movement when these cascading blocks of orders are triggered always moves exponentially faster than the consolidation. Slower the move in a direction = faster the wick in the opposite direction. More orders ( buys or sells ) equals greater speed and distance.
- These orders being triggered (stop losses and liquidations) trump any pattern, support or resistance. It all becomes irrelevant as the order chains will always execute and set off, ignoring any technical pattern.
Predicting this Wick to 123,300:
- Notice the downwards consolidation followed by a faster drop in the end.
- Price quickly moved higher
- From this point we can anticipate that the high leverage stop loss orders for shorts will be triggered, at this point you can scalp a long, take profit slightly above where the consolidation started.
Red Boxes:
- The red boxes are sell orders created from long positions being opened and consequently their stop loss and liquidation orders
- Mark and extend boxes from the open zones that price has not reclaimed
- When price moves down low enough, to start filling these sell orders, you may short to slightly below the beginning of the upwards consolidation
- I’d anticipate when price moves below 122,200, that’s when the wick will form and land at a minimum of 120,100 (if not setting off more sell orders as we look at higher time frames than the 15 M)
- Looking at the slowness and time allowed for the upwards consolidation, we can anticipate a larger amount of longs have been opened, and this can be translated to an increased speed of a wick down and faster movement.
In Summary:
I hope this serves you as a good, practical example of the method of trading stop losses hunts and order blocks, which in my experience is the only reliable way to predict the price of Bitcoin.
Yours truly,
- DD