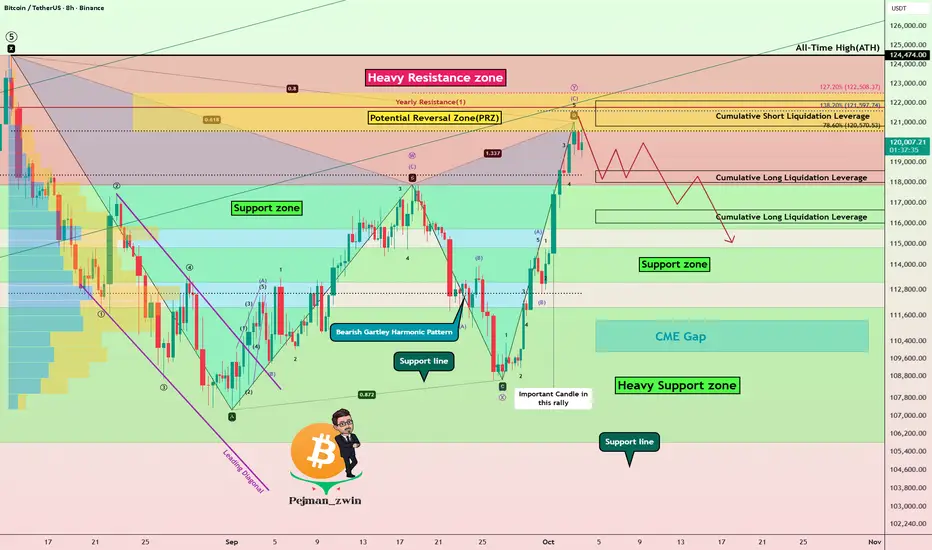
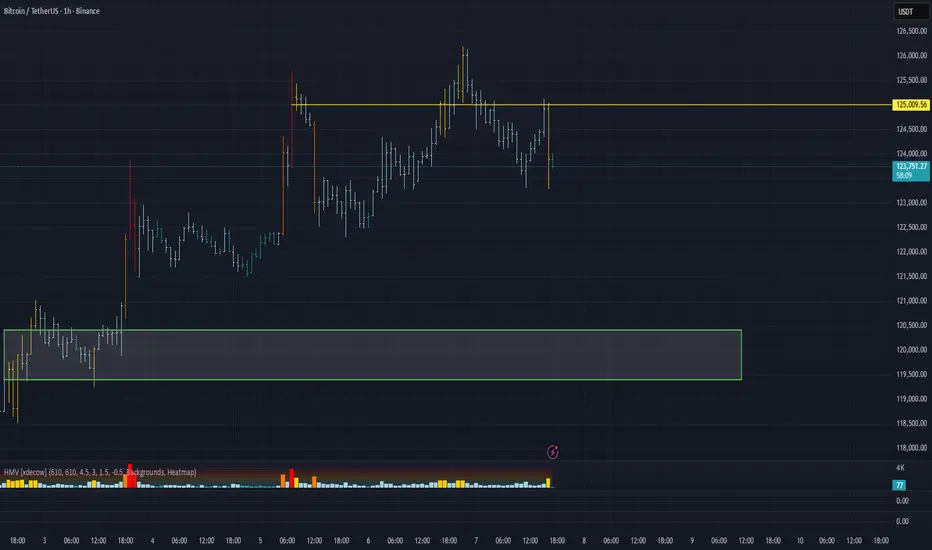
Elliott Wave + Gartley Harmonic: Why Bitcoin May Correct Soon!?Bitcoin( BINANCE:BTCUSDT ) has shown strong bullish momentum over the past week, climbing nearly +10% and testing key resistance zones . Several fundamental and technical factors fueled this rally.
Key Drivers of the Rise:
ETF inflows – Significant net inflows into spot Bitcoin ETFs boosted demand.
Macro uncertainty – U.S. government shutdown risk and weaker job data supported risk assets.
Monetary policy – Expectations of softer Fed policy improved market sentiment.
Derivatives impact – Options expiry, high OI, and short squeezes added upward pressure.
Exchange outflows – Lower BTC supply on exchanges signaled accumulation.
Positive sentiment – “Uptober” narrative and bullish analyst targets lifted confidence.
-------------------------------------------
Now, if we look at the Bitcoin chart in the above timeframes from a technical analysis perspective , we can see the following:
First of all, let me say that the rally that Bitcoin has had over the past 7 days has NOT been accompanied by high volume, and this is not good news for Bitcoin to create a new All-Time High(ATH) .
Bitcoin is entering a Heavy Resistance zone($124,474(ATH)-$117,900) and is moving near the Potential Reversal Zone (PRZ) and Cumulative Short Liquidation Leverage($122,120-$120,823) .
In terms of Elliott Wave theory , Bitcoin appears to be completing a microwave C of the main wave Y . One of the reasons I saw the waves as corrective , other than the microwaves, was the low volume of Bitcoin in the past 7-day rally .
If we look at the Bitcoin chart from a pattern perspective , the important Bearish Gartley Harmonic Pattern is also well and standardly defined on the chart, such that point D in the PRZ can be completed. The Gartley Harmonic Pattern is the most important pattern among the harmonic patterns .
I DO NOT expect a new ATH formation for Bitcoin in this rally due to the above reasons, and I expect it to at least decline to the Support zone($114,820-$113,180) .
Note: Important prices to watch for if Bitcoin reverses (in order of importance of volume): $118,400-$112,700
Note: You should note that these days, Bitcoin has a higher correlation with the SPX500( SP:SPX ) index than before, so if there is a sudden movement in Bitcoin, one of the reasons could be a sudden movement in the SPX500.
Educational Tip : The volume of each candle is considered to be the identity and credibility of that candle, and you can find these candles with the help of volume candle charts.
Cumulative Long Liquidation Leverage: $118,583-$118,000
Cumulative Long Liquidation Leverage: $116,652-$116,000
CME Gap: $111,355-$109,915
Stop Loss(SL): $125,00(Worst)
Please respect each other's ideas and express them politely if you agree or disagree.
Bitcoin Analysis (BTCUSDT), 8-hour time frame.
Be sure to follow the updated ideas.
Do not forget to put a Stop loss for your positions (For every position you want to open).
Please follow your strategy and updates; this is just my Idea, and I will gladly see your ideas in this post.
Please do not forget the ✅' like '✅ button 🙏😊 & Share it with your friends; thanks, and Trade safe.
Bitcoinprediction
Bitcoin (BTC/USD) - Bullish Breakout Alert : Targeting $130k ?🚀 Bitcoin (BTC/USD) - Bullish Breakout Alert: Targeting $130K+ in October 2025! 🚀
Hello Traders! In today's chart, I’ve analyzed Bitcoin’s recent movements. As of October 8, 2025, BTC is trading above $123,500, showing an 8.6% surge last week. Following September’s 5.35% gain, the market is in a bullish mood, aligning with the historical "Pumptober" trend.
What to Watch on the Chart:
Double Bottom Pattern: Two troughs formed near $113,000, signaling a bullish reversal. The neckline resistance at $117,300 has been broken, with the next target at $122,000-$125,000.
Symmetrical Triangle Breakout: A breakout from a two-month descending channel has occurred, indicating a sharp upside move, potentially up to $138,000.
Moving Averages: Both the 50-day MA ($118K) and 200-day MA ($115K) are rising, providing strong support. RSI at 65 is in the bullish zone but not overbought.
Volume Trend: ETF inflows ($175M+ last month) and increasing institutional buying volume suggest sustainability, potentially pushing BTC to $130K-$135K.
Prediction: If $124K holds, the target by the end of October is $131,500 (6-8% upside). Worst case, support at $118K-$120K may be tested. Long-term: $150K+ is possible in 2025 due to ETF and halving effects.
Risk: A US government shutdown or macro volatility could lead to a 5-10% dip. Always DYOR and use stop-loss!
Share your thoughts in the comments – bullish or cautious? Like & share if helpful! 📈 #Bitcoin #BTC #CryptoAnalysis #TradingView

Future of #GOLD #XAUUSDSurprises from #Gold #Levels and #Positional #Targets.
Based on Analysis from yearly chart and #Fibonocci retracement and #extension
& Based on Elliot wave theory, Gold didn't give a retracement at 1.618 levels, which means, Gold broke and holding above 2950., which means the next possible stop is at 2.618 Fib extension and #elliot wave #analysis 3rd wave. Until it reaches this levels the momentum will continue and will reach quickly !
So the ultimate possible target will be #4617.
The Intermediate monthly resistances will be 4041 / 4277 / 4617.
Riding the 3rd wave, which is an Impulse wave will give quick positional targets.
Need not believe this analysis blindly. Do your own analysis and wait and watch the wonders.
Analysis shared for Educational purpose only. Do your own analysis, to be successful on a longer run !!!
#technical #analysis #wonders. There is no holy grail.

Bitcoin - The path remains clearly bullish!💰Bitcoin ( CRYPTO:BTCUSD ) remains bullish either way:
🔎Analysis summary:
For the past 1.000 days, Bitcoin has simply been heading higher. Considering that the previous bullruns lasted about 800 days, Bitcoin is ready for a correction. But market structure tells us, that Bitcoin remains bullish, even if we see a short term correction in the near future.
📝Levels to watch:
$50.000, $1.000.000
SwingTraderPhil
SwingTrading.Simplified. | Investing.Simplified. | #LONGTERMVISION

BTC - Trade Setup Today for my Flash Crash Plan Branching off my previous two posts today, which are linked below and give an in depth analysis and theory behind this idea and plan, here are the details of my short trade on Bitcoin.
Entry - 121,400 to 121,700
Stop Loss - Keep it Tight at 127,400 in case Bitcoin moves up to 126,800 to form the head of an inverse head and shoulders (unlikely but I keep two direction ideas in mind always)
Take Profits:
105,700 - 10% Closure
85,800 - 10% Closure
67,900 - 20% Closure
43,800 - 60% Closure
From here, if I see Bitcoin start to rise from 35,000 - I will open a hedge long position, fully close 80% of short, and DCA all profits back into my short at 92,000 to 93,000
21,600 - 60% Closure
10,000 - 100% Closure
From here, I will buy BTC on spot at 8,000 to 10,000
Any questions feel free to comment below.
For each laughing face I will add in more to my short, which I am logging for a future post.
Yours truly,
- DD
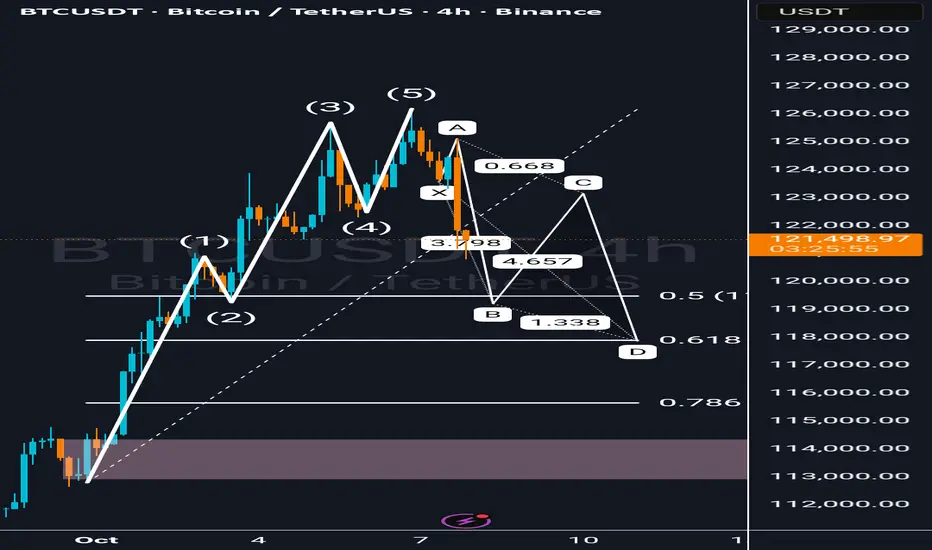
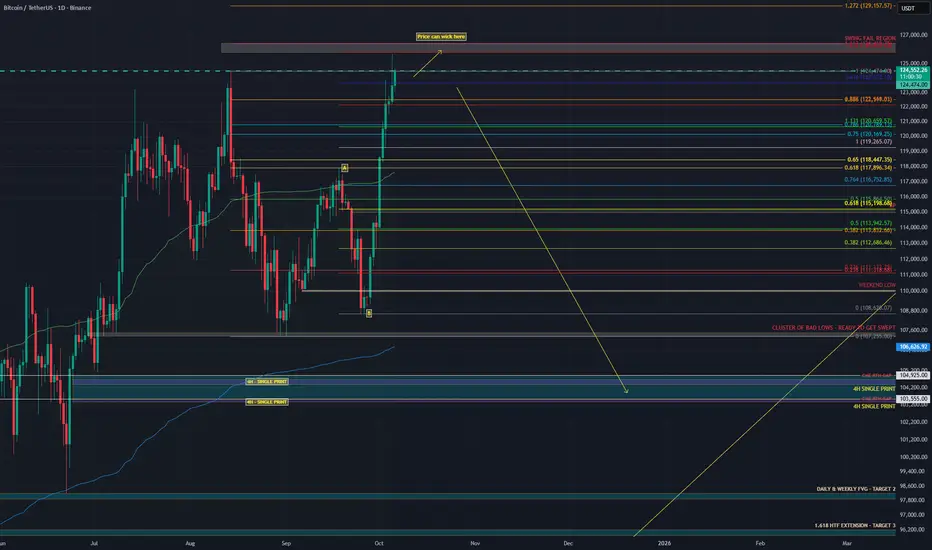
BTC / USDT – Wave 5 Completed, Correction in Progress!
📉 BTCUSDT – Wave 5 Completed, Correction in Progress!
After completing a clear Elliott Wave impulse (1–5), Bitcoin now appears to be entering a complex corrective phase.
The chart shows an emerging ABC pattern that may align with a harmonic XA–BC–D structure, with key Fibonacci confluence zones around:
0.5 retracement: 119,484
0.618 retracement: 117,900
Potential Wave D target: 117K–118K
This correction could offer a buy-the-dip opportunity if BTC holds above the Fibonacci support and shows a strong bullish reaction.
However, if Wave D breaks below the 0.786 zone (around 115K), selling pressure could extend toward the 1.272 extension (around 109K).
📊 Short-term traders: Watch price reactions near 119K–118K.
📈 Long-term investors: Wait for a confirmed reversal signal before entering.
---
💬 What do you think? Is this just a healthy pullback before the next impulsive wave, or the start of a deeper correction?
#BTCUSDT #Bitcoin #ElliottWave #CryptoAnalysis #TradingView
Bitcoin Crash Incoming - Watch for this 3 wave Move Here is a close up look at expected corrective path.
This move will be extraordinary fast, the fastest and largest drop we’ve seen in cryptos history.
Please see my linked related posts from today for a detailed overview of this theory, explanation, and helpful insights.
God speed and love to all.
- DD
BTC/USDT Analysis. Correction Likely
Hello everyone! This is CryptoRobotics trader-analyst with the daily market analysis.
Yesterday, Bitcoin followed our scenario, but with a slight deviation: we tested $125,000 (cluster anomalies) and retested the ATH, after which a correction followed.
At the moment, we have retested this level and received a fairly strong reaction. We expect a correction with targets at $120,000 and $116,000, or, if selling pressure is insufficient, the development of a prolonged sideways movement to accumulate liquidity for the next upward move.
Buy Zones:
$120,400–$119,400 (sales absorption)
$116,700–$115,000 (pushing volumes, strong graphical imbalance)
$112,500–$111,500 (mirror zone, volume anomalies)
$110,000–$108,800 (strong sales absorption)
This publication is not financial advice.
Bitcoin Crushes $125K – New ATH Unlocked: Bull Run Just Started?Yo traders, Skeptic from Skeptic Lab! 🩵 Bitcoin just smashed a new ATH—your next move could set the 3-month path! In this video, we dive deep into the daily/4h analysis: from the long squeeze bounce at key support to the parabolic breakout and resistance crush. We hunt fresh long triggers (1h resistance break), skip shorts for now (bias bullish), and I share my take on your positions—hold profits if you're green (target $130K?), partial close if not. HWC/MWC/LWC all uptrend—momentum's building! Don't FOMO; money management saves the day. Like, comment your coin focus, follow for more.

Bitcoin : Stay heavy on positionsBitcoin : Stay heavy on positions (2x~3x)
Maintaining the same outlook as before.
** This analysis is based solely on the quantification of crowd psychology.
It does not incorporate price action, trading volume, or macroeconomic indicators.

Why MY “Big Dump” THESIS STILL STANDS. BITCOIN WILL BLEEDHappy Monday traders,
I’ve reviewed the latest data again and nothing has changed my view. The structure still looks weak underneath the surface and the setup for downside remains strong.
Summary:
• Price rising → Market pushing higher, looks strong on the surface.
• Stablecoin OI increasing → New leveraged perp positions opening. Speculative money is driving the move, not real buyers.
• Coin-margined OI dropped, then slightly increased → Shorts were closed during the breakout, and now new shorts are opening near the highs.
• Spot CVD flat or slightly negative → Real demand is still missing. Spot traders aren’t supporting this move.
• Stablecoin CVD rising → Perp traders are aggressively buying, lifting price artificially.
• Long/Short ratio falling (2.05 → 1.02) → Fewer longs and more shorts entering. Shorts are fading strength while price keeps rising.
• Price up + OI up + Spot CVD flat → Buyers are being absorbed by new shorts. This is distribution forming at the highs.
• Possible short-term move to 126K → Could sweep weekend highs during RTH for liquidity before a potential reversal.
• If Spot CVD stays flat while OI rises on that move → That would likely be the final squeeze before a deeper dump.
-------------------
1️⃣ The same leverage-driven structure
The breakout on September 25 looked impressive, but it was built on leverage rather than real spot demand.
Stablecoin OI (aggregated) increased from 257K → 285K contracts (+10.9%)
This shows fresh leveraged exposure coming from perps, not genuine buyers
Coin-margined OI dropped from 7.58B → 7.29B during that breakout as shorts were closed out
It has now started to rise slightly again at current prices, meaning new coin-margined positions are opening near the highs, most likely shorts fading strength
2️⃣ Spot demand is still missing
Spot CVD moved from -18.38K → -16.44K (about +10.5%), while futures OI rose almost the same amount. That tells you everything: the breakout was driven by futures leverage, not real spot buying.
Everyone’s renting Ferraris (perp longs), but no one is actually buying one (spot BTC). Once the rental stops, the cars vanish and prices drop.
3️⃣ The long-short ratio collapse
On September 25, the aggregated long/short ratio (Binance + Bybit) was 2.05, meaning twice as many longs as shorts. Today it sits near 1.02, even though price is higher.
Early breakout longs have been closed or liquidated
New traders entering the market are mostly shorts
OI is still rising, showing new short positioning, not liquidation exits
Stablecoin-perp CVD is still climbing, meaning buyers are pushing price up but every uptick is met with new short liquidity
This is a classic case of perps pushing while smarter money fades.
4️⃣ Why I still think Bitcoin will bleed
This looks like distribution, not accumulation.
Perp traders are driving the move
Spot buyers still haven’t shown up
Shorts are building into the highs
That’s not a healthy uptrend. It’s a top-heavy market waiting for the bid to dry up. When it does, the unwind will likely be quick as leveraged positions are forced out.
Think of it like a rubber band. The more it’s stretched by leverage without real demand, the harder it snaps when buying power runs out.
⚖️ TL;DR
Stablecoin OI +10.9% → leverage driven
Coin OI fell, then rose slightly → shorts covered, new shorts forming near highs
Spot CVD flat → no real buyers
Long/Short ratio 2.05 → 1.02 → longs out, shorts in
The move up was built on leverage, not ownership.
Spot hasn’t confirmed, and shorts are stacking into strength.
🎯 Short-term note
There’s a chance we see one more push toward the 126K region during RTH to sweep the weekend highs before rolling over. If that happens with spot CVD still flat and OI climbing, it’ll likely be the final liquidity grab before a larger move down.
Until spot CVD turns positive and OI stabilizes, my view remains the same: Bitcoin will bleed.
Interested in the Order Flow data that I used for this Analysis? Check it out here => ibb.co
BITCOIN SIGNAL: PRICE DISCOVERY TARGET + When Altseason ? Yello Paradisers! Enjoy the video!
And Paradisers! Keep in mind to trade only with a proper professional trading strategy. Wait for confirmations. Play with tactics. This is the only way you can be long-term profitable.
Remember, don’t trade without confirmations. Wait for them before creating a trade. Be disciplined, patient, and emotionally controlled. Only trade the highest probability setups with the greatest risk to reward ratio. This will ensure that you become a long-term profitable professional trader.
Don't be a gambler. Don't try to get rich quick. Make sure that your trading is professionally based on proper strategies and trade tactics.

Analytics: Market Outlook and Forecasts
📈 WHAT HAPPENED?
Last week, Bitcoin surprised us with its dynamics: despite the US shutdown, the cryptocurrency showed explosive growth. On the one hand, the shutdown is negative for the global market, people have less trust in the government. On the other hand, Bitcoin acts as an independent ecosystem perceived by people as a hedge asset in relation to fiat.
As a result of the massive inflow of liquidity, almost all of the sell zones were broken, with only a few offering resistance. Moreover, the all-time high (ATH) was reached and updated, now standing at $125,700.
💼 WHAT WILL HAPPEN: OR NOT?
The bullish momentum has now slowed down, with a strong absorption of buys. The pricing remains inefficient, increasing the likelihood of a correction.
The key area of attention is $125,000 (cluster anomalies). If there is a reaction from this level, we expect a move towards $120,000, where the nearest buyer activity zone is located.
If there is no reaction and a confident breakout of the current local high, we shift our focus to finding entry points for long trades during corrections.
Buy Zones:
• $120,400–$119,400 (absorption of selling pressure)
• $116,700–$115,000 (pushing volumes, strong chart imbalance)
• $112,500–$111,500 (mirror zone, volume anomalies)
• $110,000–$108,800 (strong absorption of selling pressure)
📰 IMPORTANT DATES
Macroeconomic events this week:
• October 8, Wednesday, 1:00 (UTC) — announcement of the interest rate decision in New Zealand;
• October 8, Wednesday, 19:00 (UTC) — publication of the US FOMC minutes;
• October 9, Thursday, 12:30 (UTC) — speech by US Federal Reserve Chairman Jerome Powell, as well as publication of the number of initial jobless claims in the US;
• October 10, Friday, 12:30 (UTC) — publication of the average hourly wage, unemployment rate, and change in the number of non-agricultural workers in the United States for September.
*This post is not a financial recommendation. Make decisions based on your own experience.
#analytics
#Bitcoin $BTC price hits a new ATH over the weekend!Despite the excitement, there’s no sign of panic liquidations — around $200–400M per day, which is perfectly normal 👌
😬 The Fear & Greed Index now ranges between 71–74 — high, but not extreme.
Altcoins still look hesitant, which keeps both BTC.D and USDT.D in focus.
This setup closely resembles late April and June 2025, when both indexes started dropping — giving alts room to rally 🚀
📊 Order book ( OKX:BTCUSDT ) shows mixed sentiment:
Light resistance at $126K–130K
Strong bids near $118K
That suggests a sharp correction isn’t part of the plan — yet 👀
P.S:
This chart hasn’t been redrawn in years — it’s our “purity benchmark,” clearly showing the uptrend since late 2022 📆
🤔 What’s your take — will alts finally wake up, or will CRYPTOCAP:BTC keep stealing the show?
______________
◆ Follow us ❤️ for daily crypto insights & updates!
🚀 Don’t miss out on important market moves
🧠 DYOR | This is not financial advice, just thinking out loud

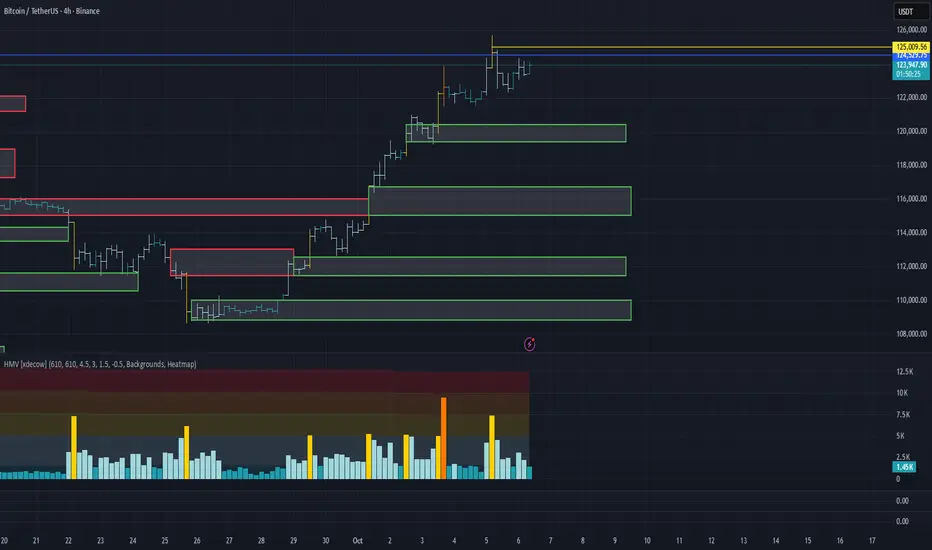
Bitcoin Range Analysis: 110k-124k Breakout WatchHello everyone, as we can see, Bitcoin has bounced off the last major support at 109-110k. Currently, the latest resistance is at 124k, so the range to play in at the moment is 110-124k. We are waiting to see if the range will be broken upwards or downwards.

Bitcoin Btc usdt daily analysis
Time frame daily
Btc reached my target
It reached new high price last night about 125.000 $
I think btc will play in yellow box that you can watch in the chart and let other assets to grow up
Alt party has started

bitcoinbtc usdt daily analyse
time frame 4 hours
risk rewards ratio > 5 woooow
target 123.000 $
btc is in the down side of my critical red box
here is good area to pump
LS is very tight to decrease my probably damage
so I open a long position to win

Bitcoin cashBcH usdt daily analysis
Time frame daily
Risk rewards ratio >2.3 👈👌
Target 920$
Double bottoms pattern created

Bitcoin Swing Trade Setup – Institutional Inflows Fuel Bulls🎭 BTC/USD – Money Heist Plan 🚀 (Swing + Scalping Strategy)
📊 BTC/USD Real-Time Market Data
Current Price: $111,156.01
24h Change: +$2,117.61 (+1.94%)
Day’s Range: $108,540.93 – $111,180.45
52-Week Range: $49,538.00 – $123,640.00
😰 Fear & Greed Index
Score: 49/100 → Neutral 😊
Trend: Shifted from “Fear” to “Neutral” in the last 24 hours.
🧠 Investor Sentiment Outlook
Retail Traders: Cautious (63% worry about crypto safety).
Institutional Traders: Bullish (💵 $3.7B net inflows in August).
🌍 Fundamental & Macro Score
Policy Uncertainty: High (U.S. tariffs, Fed policy shifts).
Fed Rate Cut Probability: High (expected September cut).
Key Event: Non-Farm Payrolls (Sept 5; forecast 45K jobs).
Gold Rally: $3,508/oz (+30% YTD, strong hedging demand).
🐂 Market Outlook
Short-Term: Neutral → Slightly Bearish (September volatility ahead).
Long-Term: Bullish (Institutional inflows + macro liquidity).
Bull/Bear Score: 55% Bullish vs 45% Bearish.
🎯 Thief’s Trading Plan (Layered Entry Strategy)
I’m setting up multiple limit orders (“Thief Layers”) instead of going all-in — this spreads risk, builds better entries, and keeps flexibility.
Entry (Layered Buys):
$109,000 → $109,500 → $110,000 → $110,500
(Add more layers as per your own strategy)
Stop Loss (Thief SL):
$107,500 (Adjust for your own risk appetite)
Target Zone (Profit Extraction):
$116,000 (Checkpoint before major resistance zone)
💡 Key Takeaways
BTC rebounded +1.94% but faces headwinds from whale profit-taking & policy risks.
Neutral sentiment (49/100) reflects a balanced investor mood.
Friday’s NFP jobs data could shape Fed rate expectations → big volatility catalyst.
🔍 Related Pairs to Watch
BITSTAMP:ETHUSD | COINBASE:SOLUSD | BITSTAMP:XRPUSD | BINANCE:BTCUSDT | CRYPTOCAP:BTC.D
#BTCUSD #Bitcoin #CryptoTrading #SwingTrade #Scalping #TradingStrategy #LayeredEntries #CryptoCommunity
✨ “If you find value in my analysis, a 👍 and 🚀 boost is much appreciated — it helps me share more setups with the community!”

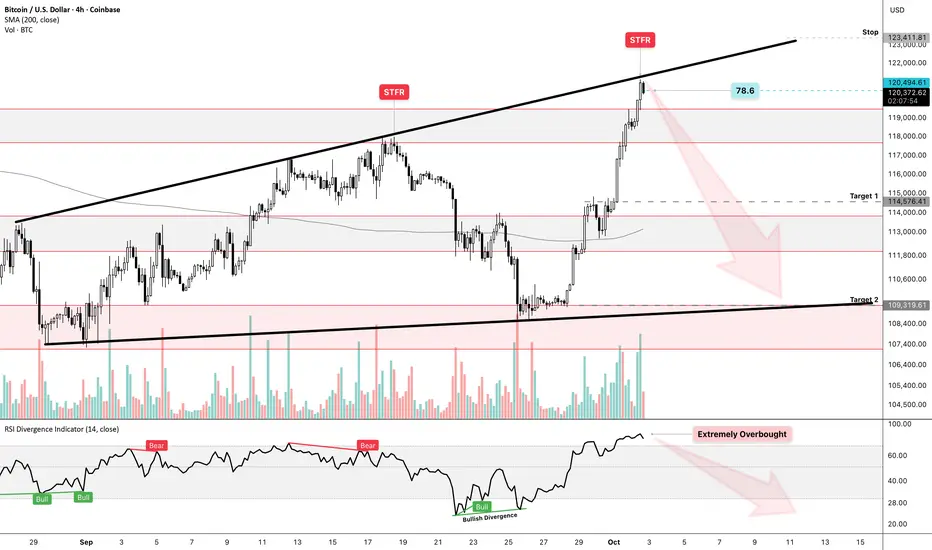
BTCUSD – Go Short or Go Broke | H4 Setup📝Thesis: Just entered a short on COINBASE:BTCUSD based on a confluence of technical and macro signals. This isn’t just about overbought RSI - it’s about asymmetric risk, deceptive bullish structure, and a broader bearish undertone most traders are ignoring.
📉 Setup Breakdown
RSI (H4): 85.12 – Extremely Overbought. Historically, this zone has triggered sharp pullbacks. Previous RSI peaks marked “Bear” on chart confirm the pattern(July, August 2025).
📊 Chart Structure: Rising wedge approaching STR resistance zone + 78.6 fib level. Price action looks exhausted, and volume is fading.
🌐 Macro Bias: Despite local bullish momentum, the broader trend remains bearish. Credit spreads are widening, and macro liquidity is tightening. Risk-off tone is creeping in.
⚖️ RR Profile: ATH is just ~$4K above. Downside targets offer cleaner reward zones with tighter invalidation. Stop placed just above STR zone.
🎯 Trade Parameters
✅ Entry: Near STR resistance zone
⛔️ Stop: Above upper trend line / STR zone
🟠 Target 1: Mid-channel support
🟢 Target 2: Lower fib confluence zone
🧠 Macro Overlay
U.S. credit spreads are widening (HY index at 2.75%, CDS spreads rising).
Government shutdown risk is escalating.
Fed is in risk-management mode - not panic yet, but tone is shifting.
October is historically volatile (see 2008 analogs) - watch for liquidity stress.
⚠️ TL;DR
Shorting INDEX:BTCUSD here isn’t just technical - it’s strategic. Overbought RSI + bearish wedge + macro stress = asymmetric setup.
Risk is capped, reward is clean. Let’s see how it plays out.
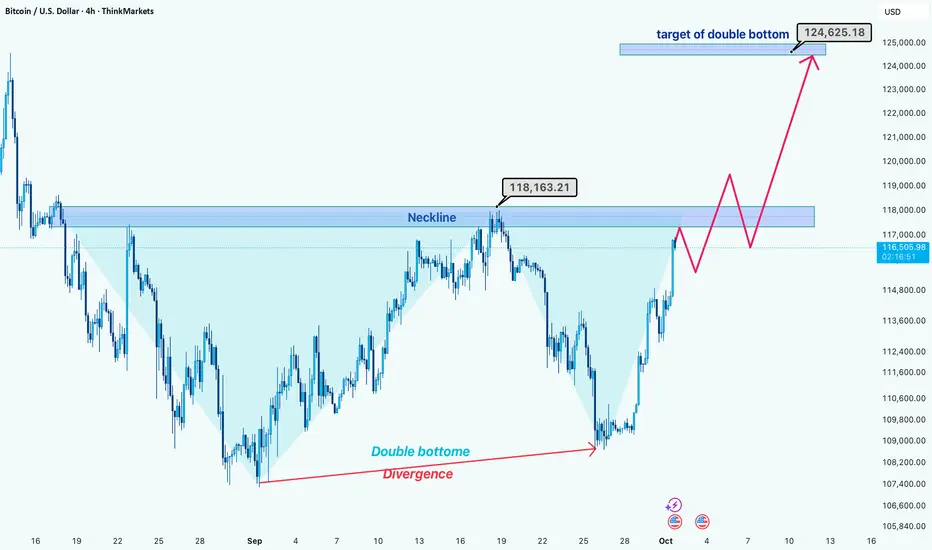
Bitcoin Technical: Double Bottom Setting Up for $124.6K?Hi guys!
Bullish Divergence
Bitcoin has recently formed a bullish divergence, which signals that selling pressure is weakening and buyers are stepping in.
Double Bottom Formation
A double bottom pattern is clearly visible, but the critical neckline resistance around $118,163 hasn’t been broken yet. This area is the key confirmation level.
Potential Breakout
Thanks to the bullish divergence, there’s a strong possibility that BTC will break above this neckline in the coming sessions.
Long Position Strategy
The safest long entry would be after the neckline breakout and a small pullback (correction) to confirm support. This reduces the risk of a false breakout.
Target Projection
If confirmed, the double bottom pattern projects a target around $124,600, offering a solid upside potential from the current levels.
Disclaimer: As part of ThinkMarkets’ Influencer Program, I am sponsored to share and publish their charts in my analysis.
We have a diamond.When a megaphone and a symmetrical triangle intersect, a diamond is formed — a 100% bullish pattern that completes the previous setup and should take us above 130K.

BITCOIN SIGNAL: LEVERAGE DRIVEN PUMP! (where it ends??!)Yello Paradisers! Enjoy the video!
And Paradisers! Keep in mind to trade only with a proper professional trading strategy. Wait for confirmations. Play with tactics. This is the only way you can be long-term profitable.
Remember, don’t trade without confirmations. Wait for them before creating a trade. Be disciplined, patient, and emotionally controlled. Only trade the highest probability setups with the greatest risk to reward ratio. This will ensure that you become a long-term profitable professional trader.
Don't be a gambler. Don't try to get rich quick. Make sure that your trading is professionally based on proper strategies and trade tactics.
