Bitcoins future...Been playing around and we could be in trouble here if the bottom line of the rising wedge ends up broken.
We could see price levels as low as 1500-2k in worst case scenarios!
Most likely we will go down and test 60k area based on trendlines and resists.
The circles shows a zone/area we can go up and fill to complete the rising wedge.
These times are so exciting so much money can be made if you're watching it closely!
Bitcoinprediction

BITCOIN HIGH PROBABILITY SETUP SOON!!!🚨 BTC HIGH PROBABILITY BUY SETUP 🚨
* Here We Can See Clearly The Next Potential Moves For BTCUSD Coming Hours/Days.
* Keep Your Eyes Close On Your Trading Positions.
* Happy PIP Hunting Traders.
FXKILLA.

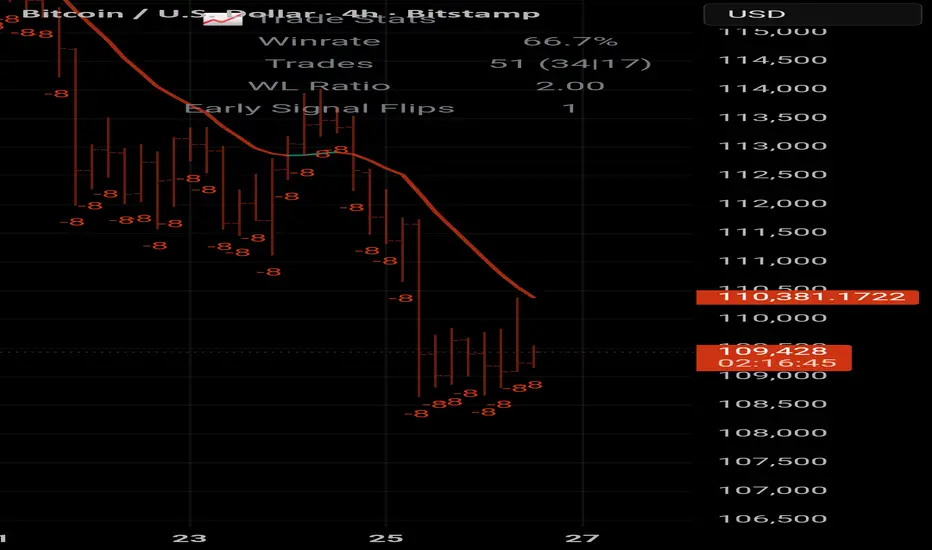
Bitcoin : Stay heavy on positionsBitcoin : Stay heavy on positions (2x~3x)
Maintaining the same outlook as before.
A signal for catching a bounce has emerged.
** This analysis is based solely on the quantification of crowd psychology.
It does not incorporate price action, trading volume, or macroeconomic indicators.

#Bitcoin SELL SIGNAL Hello group. As of today we have a target at $105,000.00. We hit the last target of $109,00 to $108,009.
Just updating from our AI system model. Please use this as a guideline.
It one heck of a game to play. Please be very careful as Institutionals are also involved.
BITCOIN SIGNAL: PROBABILITIES SHOWING THIS NOW!! (careful) Yello Paradisers! Enjoy the video!
And Paradisers! Keep in mind to trade only with a proper professional trading strategy. Wait for confirmations. Play with tactics. This is the only way you can be long-term profitable.
Remember, don’t trade without confirmations. Wait for them before creating a trade. Be disciplined, patient, and emotionally controlled. Only trade the highest probability setups with the greatest risk to reward ratio. This will ensure that you become a long-term profitable professional trader.
Don't be a gambler. Don't try to get rich quick. Make sure that your trading is professionally based on proper strategies and trade tactics.

BTC/USDT Analysis. Buyers Lost Momentum
Hello everyone! This is CryptoRobotics trader-analyst with your daily market update.
Yesterday, Bitcoin followed the less favorable scenario: after testing the $111,300-$112,000 local zone, the price failed to consolidate above it and broke the local low.
Just ~$300 short of the ~$108,400 zone (cluster anomalies), the market entered a sideways range, where clear buyer defense was recorded near the lows.
At the moment, we expect a test of ~$108,400 and a possible recovery toward $110,000. If sellers return from that level, we anticipate a move toward the daily buyer zone, with the first target at $107,000.
Buy Zones:
• ~$108,400 (cluster anomalies)
• $107,000–$102,500 (accumulated volumes)
Sell Zones:
• ~$105,000 (initiative selling volumes)
• $111,500-$113,000 (accumulated volumes)
• $115,000-$116,000 (accumulated volumes)
• $118,000–$119,000 (accumulated volumes)
• $121,200–$122,200 (buy absorption)
This publication is not financial advice.

Bitcoin Roadmap: Can BTC Hold the $108K Before Next Big move!?Bitcoin( BINANCE:BTCUSDT ) managed to break the Support zone($110,920-$109,900) and Support lines yesterday with the help of a Bearish Marubozu Candle(the Marubozu candle volume was acceptable).
Bitcoin is still moving in the Heavy Support zone($112,000-$105,800) and near the important Support line, Potential Reversal Zone(PRZ) , Cumulative Long Liquidation Leverage($108,165-$107,000).
In terms of Elliott Wave theory, Bitcoin appears to be completing microwave 5 of the main wave 3. Microwave 4 of the main wave 3 is of the Contracting Triangle type, and the main wave 3 is of the extended type.
I expect Bitcoin to start rising and attack the Resistance lines after completing the main wave 3 from the Potential Reversal Zone(PRZ) , Support zone($108,200-$107,240), and Important Support line.
Cumulative Short Liquidation Leverage: $110,624-$109,836
Note: If Bitcoin touches $106,800, we can expect a break of the Heavy Support zone($112,000-$105,800).
Note: If Bitcoin goes above $111,000, we can expect a renewed rise in Bitcoin.
---------------------------------------------
One of the indices that helps the Roadmap of Bitcoin and other tokens is the USDT.D%.
USDT.D% currently seems to have managed to break the heavy resistance zone and this is NOT good news for Bitcoin and other tokens, and perhaps a further correction in the crypto market is on the way.
USDT.D%’s roadmap for me is that it is almost in line with today’s analysis of Bitcoin.
---------------------------------------------
Please respect each other's ideas and express them politely if you agree or disagree.
Bitcoin Analysis (BTCUSDT), 1-hour time frame.
Be sure to follow the updated ideas.
Do not forget to put a Stop loss for your positions (For every position you want to open).
Please follow your strategy and updates; this is just my Idea, and I will gladly see your ideas in this post.
Please do not forget the ✅' like '✅ button 🙏😊 & Share it with your friends; thanks, and Trade safe.

Solana coin up another 60% Whats next In this video I recap our previous video calling for a pullback into $150 with a target of $240 which has now been fulfilled .
The question is whats next from $240, we are top heavy and despite market structure still bullish I anticipate a move up to fill the single prints at $245/250 before a healthy pull back into $200 zone .
I also recap Bitcoin and the ETH /BTC pair
Take the trades level by level and plan ahead . Enjoy

Bitcoin Shows Weakness at Daily SupportHello traders!
Bitcoin is on a daily supply/resistance zone and is showing signs of weakening.
The break of the upward trendline and its retest provide additional confirmation and a solid reason to enter a short position.
The target for this position is around 110,000.
Manage your risk and trade safe!

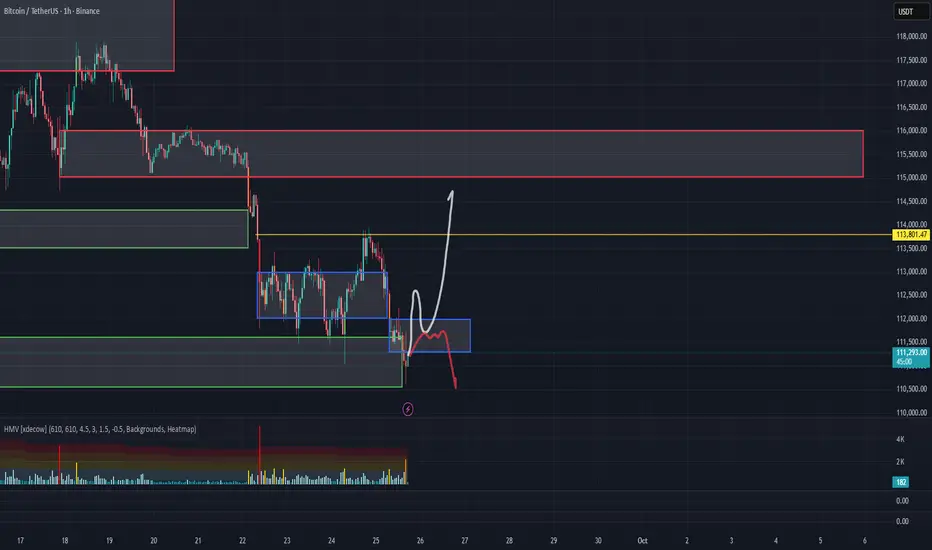
BTC Breakdown: Watching 112.6K-113.5K for Rejection Toward 109kHello guys!
Trend Structure:
The price was moving in a clear ascending channel, but recently broke down below the lower boundary with strong bearish momentum. This confirms a structural shift from bullish to bearish sentiment.
Current Price Action:
After the breakdown, BTC attempted a relief rally but is now struggling around the 112,682 – 113,581 resistance zone (marked in blue). This area was previously support inside the channel and is now acting as resistance (role reversal).
Scenarios (Entries):
Rejection at 112,682 zone:
If BTC fails to break above this resistance, sellers could step in and push the price lower. A clean rejection here would open the way toward 109,884 (next major support).
Deeper pullback to 113,581:
If bulls manage to push higher, the 113,581 level becomes the last line of resistance. A rejection here would be a high-probability short entry, also targeting 109,884.
Target Zone:
Both rejection scenarios point to 109,884 as the key downside target. A break below that level would increase bearish momentum toward 108,000 and possibly lower.

BTCUSDT H4 OUTLOOK Lets Goo
We Are Considering Buy Btcusdt Setup On Demand Zone
Liquidity Sweep
Demand Zone
High Probability Setup
Good Luck Guys

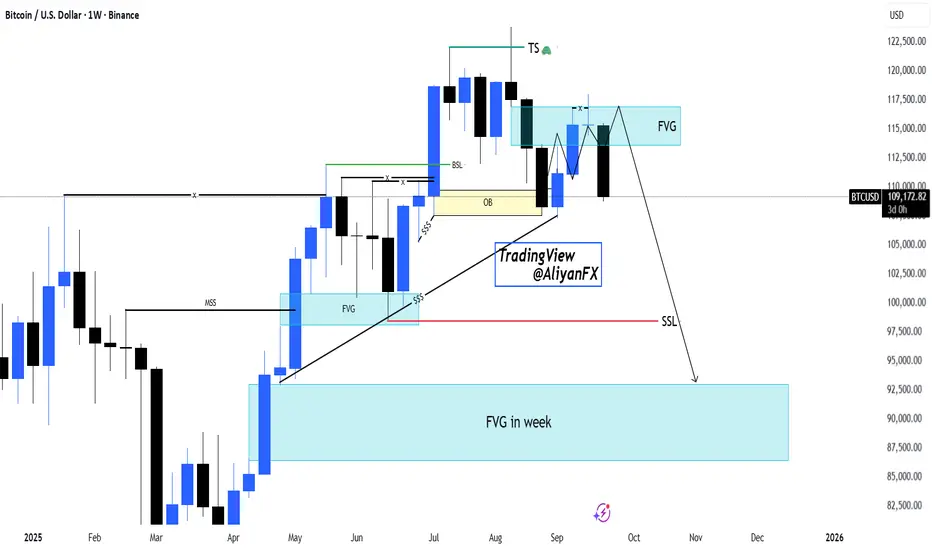
BTCUSD | Weekly FVG Rejection – Bearish Outlook Targeting SSLHello Billionaires!!
We All know that Bitcoin has tapped into a weekly Fair Value Gap (FVG) after sweeping Buy-Side Liquidity (BSL) and reacting from the Order Block (OB). Current price action shows rejection, suggesting bearish continuation.
🔹 Key Points:
BSL swept, confirming liquidity grab.
Price rejected from FVG + OB zone.
Short-term structure break hints at downside momentum.
Targeting Sell-Side Liquidity (SSL) and the weekly FVG demand zone around 90,000 – 92,000.
Outlook remains bearish unless price reclaims and sustains above the FVG rejection zone.
#BTC/USDT THE ONLY BITCOIN CHART YOU NEED!BTC : Almost There!
BTC is currently following the trajectory shown in my last chart. It took some time, but it’s playing out exactly as expected. Sooner or later, a bounce is coming — there’s no reason to panic unless we break below $103.5K, which is the key support level.
You need to understand that only when money moves out of BTC and big-cap alts will THE MID AND THE SMALL CAPS will have their time to shine. And sooner or later, you'll realise all this happened for good if you played it right. Even if not, many opportunities are coming ahead.
You’ll see this happen soon.
MY MESSAGE TO YOU ALL:
If you've been in crypto for a few years, you know this moment: it’s when the market is on the brink of a big move.
Be patient, it won’t happen overnight, but sooner or later, it will.
If you're currently in the red, take it as a lesson. It happens to the best of us. I've had four positions stopped out, too. It could have been worse if I hadn’t had a STOP LOSS in place.
The silver lining? I can re-enter at a better price.
A lesson I’ve learned over the years: STOP LOSS is a life-saver.
Stay strong and don’t give up right before the big opportunity we’ve all been waiting for.
Opportunities are ahead, manage your risks and remember to take a break, touch some grass. I’m with you.
I'll drop more charts shortly.
Stay strong, folks.
WAGMI!
Do hit the like button, and if you have any doubts, questions, or chart requests, drop them in the comments.
Thank you
#PEACE

BTC/USDT Analysis. Moving Within the Expected Scenario
Hello everyone! This is CryptoRobotics trader-analyst with your daily market update.
Yesterday, as expected, Bitcoin made a false breakout to the upside, testing the ~$113,800 zone (market imbalance, mirror level) and then quickly reversed downward. When testing the $113,000-$112,000 area, there was no significant reaction, and the price moved lower to test the more important $111,600-$110,500 zone (accumulated volumes).
At the moment, the primary scenario remains a resumption of buying. A local volume zone has formed above the current price at $112,000-$111,300 — breaking and consolidating above it would significantly increase the probability of moving toward the next major resistance. We are considering a long position either after consolidation above this zone or upon a retest with a clear buying reaction, which would be a more conservative entry.
If this level is rejected, we may see further downside movement toward $108,000.
Buy Zones:
• $112,000-$111,300 (potential local support)
• ~$108,400 (cluster anomalies)
• $108,000–$102,500 (accumulated volumes)
Sell Zones:
• $115,000-$116,000 (accumulated volumes)
• $118,000–$119,000 (accumulated volumes)
• $121,200–$122,200 (buy absorption)
This publication is not financial advice.
Bitcoin Breaks Through Key Support Band — Price May Crash SoonAt the time of writing, Bitcoin trades at $111,542, reflecting a 4.7% weekly decline. The crypto king remains stuck below the $112,500 resistance, unable to attract enough momentum to flip the level into support.
If bearish pressure persists, Bitcoin could break through $110,000 support, opening a path to $108,000. Continued selling could extend the drawdown further, dragging BTC to $105,000 in the near term.
However, if investors step in to stabilize price action, Bitcoin could reclaim $112,500 as support. A successful bounce from that level would challenge the prevailing bearish narrative, potentially setting the stage for recovery and invalidating the downside outlook.

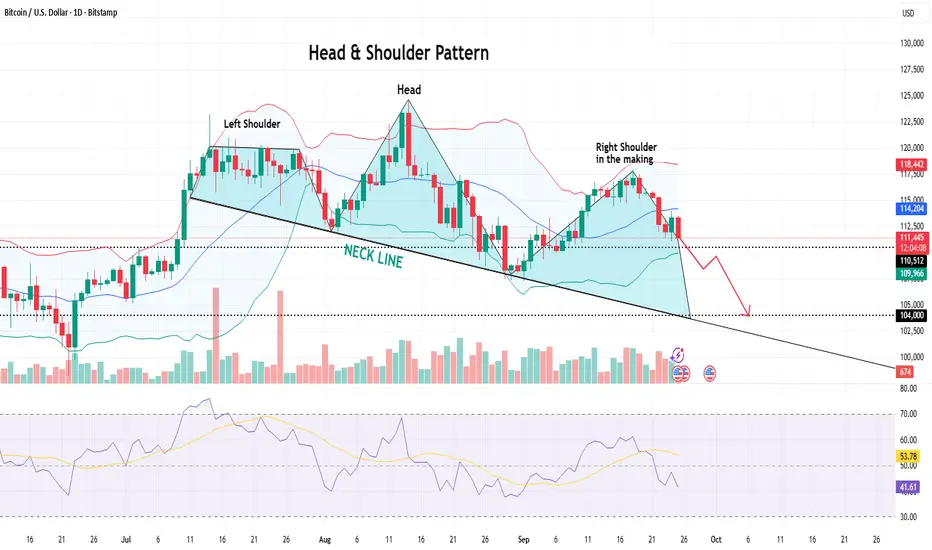
Bitcoin Creating a Classic Bearish Reversal SignalBitcoin is forming a Head & Shoulder pattern, a classic bearish reversal setup.
The right shoulder is in the making, and for that price might fall towards the neckline support around near 104000 level, a crucial zone to watch.
The immediate support exists near 110500, if breached successfully, the probabilities of reaching the 104000 zone will rise.
A confirmed break below the neckline could accelerate downside momentum toward $100,000–$98,000.
RSI is trending lower, showing weakening momentum and supporting the bearish outlook.
If neckline holds, a short-term bounce is possible, but overall structure favors sellers.
Also on the weekly chart, a clear Evening Star pattern has been creating (while writing this analysis)
Hence, taking double confirmation from the daily & weekly chart, Bitcoin prices are expected to fall.
BTC/USD – Critical Night Ahead; Set Your Stop-Loss!🚨 Warning to Traders 🚨
Bitcoin has completed its pullback within the long-term ascending channel and is now testing the heavy resistance zone at 120K–124K. Tonight could be one of the most critical nights for the market. If negative news hits, we may witness a bloody drop of 18–19%, pushing price action down toward 93K.
🔻 Key Levels
Major Resistance: 120K–124K
Support 1: 109K–105K
Support 2: 101K–97K
Critical Demand: 93K
Deep Liquidity: 80K–74K
📉 Likely Scenario
A breakdown below 109K could trigger a multi-leg decline: first targeting 101K–97K, then extending toward 93K. With increased fear, even the 80K–74K liquidity zone could come into play.
⚠️ Revolutionary Advice
Always set your stop-loss
Protect your capital
Tonight could define the next major Bitcoin trend
💡 Save your money – the market never jokes!

BAD NEWS for Bitcoin :(. BE CAREFUL!My last Prediction was PERFECT . i know this will UPSET many bulls, but this is how the MARKETS WORK. After a strong uptrend and extreme greed environment, its time for Bitcoin to CORRECT and have strong PULLBACK. Look at the channel and trendlines, I expect bitcoin to reach a price of 100k/96k in the coming weeks. That will be a GOOD BUY opportunity. BE CAREFUL AND STAY WISE.
See My Previous PERFECT prediction:
BINANCE:BTCUSD COINBASE:BTCUSD CRYPTO:BTCUSD OKX:BTCUSD

BITCOIN SIGNAL: IS IT ABOUT TO GET WORSE??!! (scary) Yello Paradisers!
Together, we go through multiple timeframes. We are going through an ultra-long timeframe, breaking of the channel. How proper reclaims look, what the preceded price action is that is going to happen next and what preceded before that, and what the cycles are. We are taking a look at the bearish divergence, a shooting star which increased the truncation probability on lower timeframes.And that we are in the first motive mode wave of a higher-degree impulse.
On a high time frame chart, we are going through the secondary wave, the bearish divergence, resistances, and with the highest probability, the secondary wave is not yet finished. We are looking for confirmations from a high time frame perspective.
On a medium timeframe, we are deeply calculating the sub-waves. I'm sharing with you the fourth wave that, with the highest probability, is finishing, and we are about to have a fifth corrective mode wave because we are in an ending diagonal.
On a low timeframe chart, I'm sharing with you the expanding triangle and the upcoming price action with the highest probability.
Paradisers! Keep in mind to trade only with a proper professional trading strategy. Wait for confirmations. Play with tactics. This is the only way you can be long-term profitable.
Remember, don’t trade without confirmations. Wait for them before creating a trade. Be disciplined, patient, and emotionally controlled. Only trade the highest probability setups with the greatest risk to reward ratio. This will ensure that you become a long-term profitable professional trader.
Don't be a gambler. Don't try to get rich quick. Make sure that your trading is professionally based on proper strategies and trade tactics.

BITCOIN SIGNAL: ANOTHER PERFECT PREDICTION (warning) Yello Paradisers! As always, as professional traders in this video, once again, we will go through multi-timeframe analysis. We are using Elliot Wave, indicators, advanced technical tools, and price action reading. Enjoy it. I love you.
Paradisers! Keep in mind to trade only with a proper professional trading strategy. Wait for confirmations. Play with tactics. This is the only way you can be long-term profitable.
Remember, don’t trade without confirmations. Wait for them before creating a trade. Be disciplined, patient, and emotionally controlled. Only trade the highest probability setups with the greatest risk to reward ratio. This will ensure that you become a long-term profitable professional trader.
Don't be a gambler. Don't try to get rich quick. Make sure that your trading is professionally based on proper strategies and trade tactics.

BTC/USDT Analysis – Rotation Continues
Hello everyone! This is the CryptoRobotics trader-analyst with your daily market review.
Yesterday we expected rotation within two key zones with a priority on grabbing upper liquidity, but instead, price moved for lower liquidity and tested the $111,600–$110,500 buy zone (accumulated volumes), from which we again saw a strong reaction.
Our current focus remains on capturing the upper liquidity and testing the market imbalance near ~$113,800. After that, we expect another selling wave into the $113,000–$112,000 zone. If we see a strong reaction there, we will consider long setups targeting the higher sell zone at $115,000–$116,000.
Buy Zones:
• $111,600–$110,500 (accumulated volumes)
• ~$108,400 (cluster anomalies)
• $108,000–$102,500 (accumulated volumes)
Sell Zones:
• ~$113,800 (market imbalance, mirror zone)
• $115,000–$116,000 (accumulated volumes)
• $118,000–$119,000 (accumulated volumes)
• $121,200–$122,200 (buy absorption)
⚠️ This publication is not financial advice.

BTCUSDT- 250924 - LONG - Bitstamp - Cycle Top - 1WBTCUSDT- 250924 - LONG - Bitstamp - Cycle Top - 1W
Market Cycle Top: 134k
Look to take profits around 134k

BTC/USDT Analysis – Is the Bullish Cycle Over?
Hello everyone! This is CryptoRobotics trader-analyst with your daily market review.
Yesterday we considered two possible scenarios, and the second one played out — price tested the $111,600–$110,500 support zone (accumulated volumes) and then returned back into the current value area.
At the moment, we are seeing clear selling pressure on the spot market (based on delta), but it is not leading to further downside. The volume positioning and the quick reaction from the mentioned support zone point to at least a short-term bullish bias.
We expect rotation within two key areas:
$111,600–$110,500 (accumulated volumes) and $113,000–$112,400 (volume anomalies, liquidations).
A liquidity grab near ~$113,800 (market imbalance, mirror zone) is likely. If price returns into the $113,000–$112,400 range, we will look for potential long setups targeting the upper sell zones.
Buy Zones:
• $111,600–$110,500 (accumulated volumes)
• ~$108,400 (cluster anomalies)
• $108,000–$102,500 (accumulated volumes)
Sell Zones:
• ~$113,800 (market imbalance, mirror zone)
• $115,000–$116,000 (accumulated volumes)
• $118,000–$119,000 (accumulated volumes)
• $121,200–$122,200 (buy absorption)
This publication is not financial advice.
