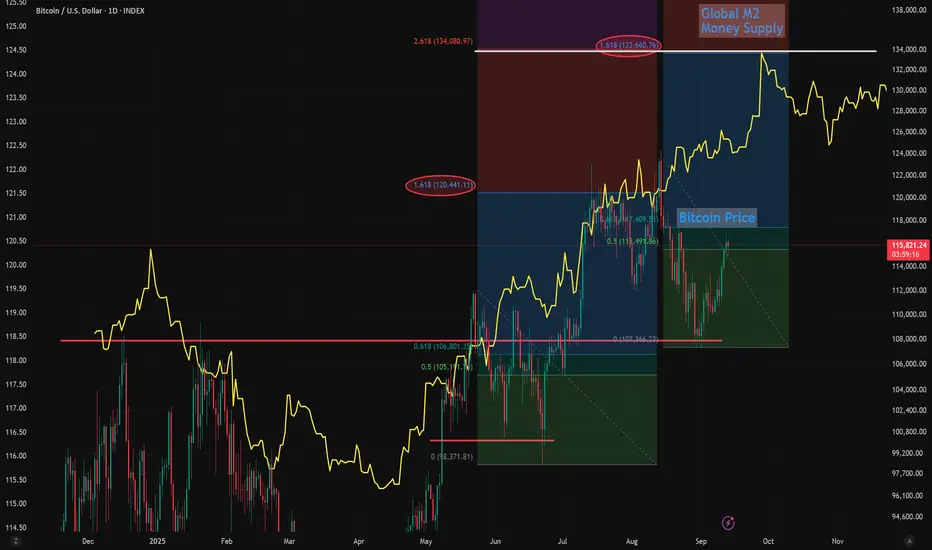
Global M2 and Bitcoin Fib Bounce Targets Point to $134K Next Global M2 has been leading Bitcoin which has been diverging, mostly due to an economic slowdown and waiting for interest rates to start dropping as a catalyst.
Since we're pricing in and high probability of 3 rate cuts starting in September, I expect Bitcoin to start pushing higher and several studies point toward $134k - $135k from here.
These Fibs studies aren't exactly correct, b/c I drew the high / low using the wiicks vs the real bocy, but still interesting.
The first Fib swing high/low correction forecast the pump to the 1.618 target.
So using the most recent high/low swing, points toward around $134k on the 1.618 which is coincidentally the 2.618 extension from the first Fibonacci.
My bull-flag targets on Bitcoin also point to a measured move of $134k-$135k as the next likely profit target, before another pullback and ultimately on the way to $150k this year I think.
Let me know your thoughts below.
- Brett
Bitcoinprediction
Bitcoin Road to September 17Good morning, this is my first time here.
Today we’ll take a detailed look at Bitcoin’s path leading up to the main Fed meeting later this month.
A small “impulsive” move up to 117K is still possible while the market remains weak. Weekends are always weak, and market makers take advantage of this for their manipulations.
Right now, their goal is to gather as much liquidity as possible before the next upward move. Market sentiment is not in their favor, but the weekend is helping them.
Next, there are two major liquidity clusters at 112K and 110K. By luring traders into a trap with a fake rally, the price can safely head lower. It’s hard to move down against strong bullish sentiment, but there’s no other option—otherwise, during a rally without corrections, long positions will lock in profits as the price rises, each “pulling” liquidity to themselves.
This doesn’t necessarily mean the drop will reach those exact levels. You always need to watch the market in real time, not just “guess with daisies.”
Please subscribe and support, and I’ll continue to analyze the market live as the moves unfold.
Wishing you a great weekend and all the best!

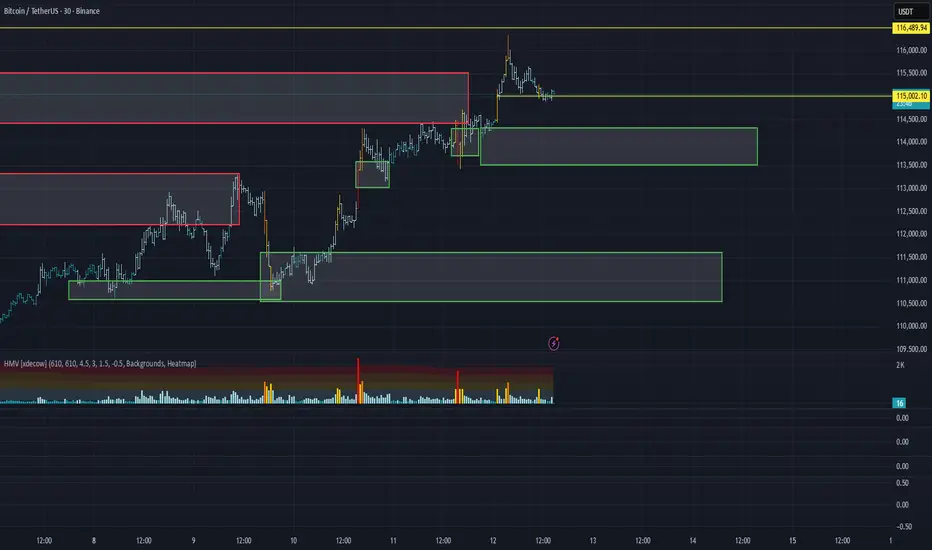
BTC/USDT Analysis. Buyers Remain in Control
Hello everyone! This is a trader-analyst from CryptoRobotics, and here’s the daily analysis.
Yesterday, Bitcoin tested the $114,300–$113,700 zone (market sell absorption) and continued its upward move.
At the moment, we have broken through the $114,400–$115,500 sell zone (volume zone) and are now testing buyer liquidity around $115,000. The current selling wave shows weakness, so the overall context remains bullish.
We expect further upside movement towards the next sell zones, either from the current price or after a potential retest of the new volume zone at $114,300–$113,500.
Buy Zones:
$114,300–$113,500 (volume zone)
$111,600–$110,500 (accumulated volumes)
~$108,400 (cluster anomalies)
$108,000–$102,500 (accumulated volumes)
Sell Zones:
~$116,500 (volume anomaly)
$117,200–$119,000 (accumulated volumes)
$121,200–$122,200 (buy absorption)
This publication does not constitute financial advice.
PPI Shock Pushes Bitcoin Higher – Fake Pump Before Drop?Bitcoin ( BINANCE:BTCUSDT ) has been making high momentum Sharpe moves over the last few days , which has made it a little difficult to trade, which is why I am still sticking to my previous analysis , and this analysis is an update of targets and even new entry points .
Bitcoin is currently moving near the Resistance zone($114,720-$113,580) , Reversal Zone(PRZ) , Cumulative Short Liquidation Leverage($114,510-$113,771) , Monthly Pivot Point , and Resistance lines = a set of Resistances
A few minutes ago, the US Core PPI m/m and PPI m/m data were released, which triggered a pump in Bitcoin . In my view, we should wait for Bitcoin to digest this shock and then continue its real trend .
Do you agree with me?
In terms of Elliott Wave theory , it seems that Bitcoin has completed microwave 5 of microwave C of the main wave Y , and we can expect a downtrend .
I expect Bitcoin to drop again to at least $111,600(First Target) .
Second Target: $110,883
Third Target: $110,000 and more dumps.
Stop Loss(SL): $114,923(Worst)
CME Gap: $117,235-$113,800
Cumulative Long Liquidation Leverage: $110,822-$109,752
Note: Be sure to follow capital management and do not take risks.
Please respect each other's ideas and express them politely if you agree or disagree.
Bitcoin Analysis (BTCUSDT), 1-hour time frame.
Be sure to follow the updated ideas.
Do not forget to put a Stop loss for your positions (For every position you want to open).
Please follow your strategy and updates; this is just my Idea, and I will gladly see your ideas in this post.
Please do not forget the ✅' like '✅ button 🙏😊 & Share it with your friends; thanks, and Trade safe.

BTC/USDT Analysis. Approaching Resistance
Hello everyone! This is a trader-analyst from CryptoRobotics, and here’s the daily analysis.
Yesterday, Bitcoin tested the pushing volumes zone at $113,700–$113,000, showed a reaction, and then fully reached the resistance area at $114,400–$115,500 (volume zone).
The first wave of selling was rather weak. Trading volumes increased at the moment, with buyers holding the upper hand. The newly formed volume zone at $114,300–$113,700 was absorbed by market buyers, which locally suggests the potential for further upward movement.
However, the fact that price is currently within a sell zone, combined with weak updates of local highs, points to a high probability of a notable correction. Thus, even this absorption could turn out to be another bull trap.
Buy Zones:
$114,300–$113,700 (market sell absorption)
$111,600–$110,500 (accumulated volumes)
~$108,400 (cluster anomalies)
$108,000–$102,500 (accumulated volumes)
Sell Zones:
$114,400–$115,500 (volume zone)
~$116,500 (volume anomaly)
$117,200–$119,000 (accumulated volumes)
$121,200–$122,200 (buy absorption)
This publication does not constitute financial advice.

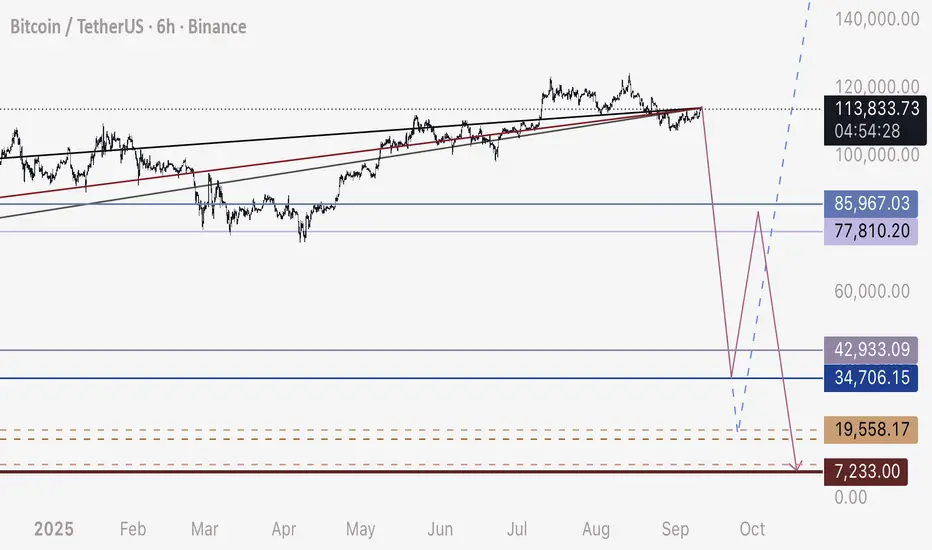
BTC - Crash Path PossibilitiesI expect Bitcoin to crash hard today, and here is a zoomed in look at my potential pathways.
NOTE - See linked related idea on DXY to make sense of this more
Beginning with most likely in my own opinion, to least likely:
Option 1:
114,200 to 35,000 - Short
35,000 to 85,000-86,000 - Long
85,000 to 8,000 - Short
8,000 - Long Entry
Option 2:
114,000-115,000 to 18,000-19,500 - Short
20,000 - Long Entry
Option 3:
114,200 to 43,000 - Short
43,000 to 77,000 - Long
77,000 to 8,000 - Short
8,000 - Long Entry
Strategy:
- Regardless of option I am short Bitcoin
- I will watch for a sudden crash initiate today
- I will first watch for a hold and bounce at 35,000 - closing 75% of my short at 45,000 (I expect wick to be very fast and hard to trade exact numbers)
- If we see a bounce at 35,000 - I will open a hedge long at that level
- Repeat first four steps if we drop below 30,000, looking for the correct bottom and closing short accordingly
- Safest option is low leverage short and spot buys at the bottom levels
Thanks to those who have been following me and supporting my ideas. I know I’m the only one speaking about this.
Happy trading.
Bitcoin Price Eyes Breakout as ETF Inflows Mirror ATH TrendBitcoin’s price is trading at $114,192 at the time of writing, facing resistance at $115,000. Sustained buying interest at this level will be crucial to trigger the next stage of upward movement.
If ETF inflows remain strong, BTC could flip $115,000 into support and rally toward $117,261 before targeting $120,000. This level would represent a critical milestone in Bitcoin’s ongoing bull cycle.
However, if the breakout attempt fails, Bitcoin may consolidate between $112,500 and $110,000. Such a pullback would invalidate the immediate bullish thesis but still keep BTC within its broader uptrend channel.

BTCUSDT - What next ?? We can see a retest of 111k7 level, but bitcoin was not successful in closing above it.
111K7 continues to remain as our area of interest for now. Closing above which we will change bias.
For now bitcoin is still bearish....
Happy Trading!!!

BITCOIN SETUP ALERT ! Bitcoin Zones Where Sell
SELL NOW ACTIVE ZONE FVG : 114.00
SELL PENDING ORDER FVG + OB : 117.00
Good Luck With Your Trading 🤞

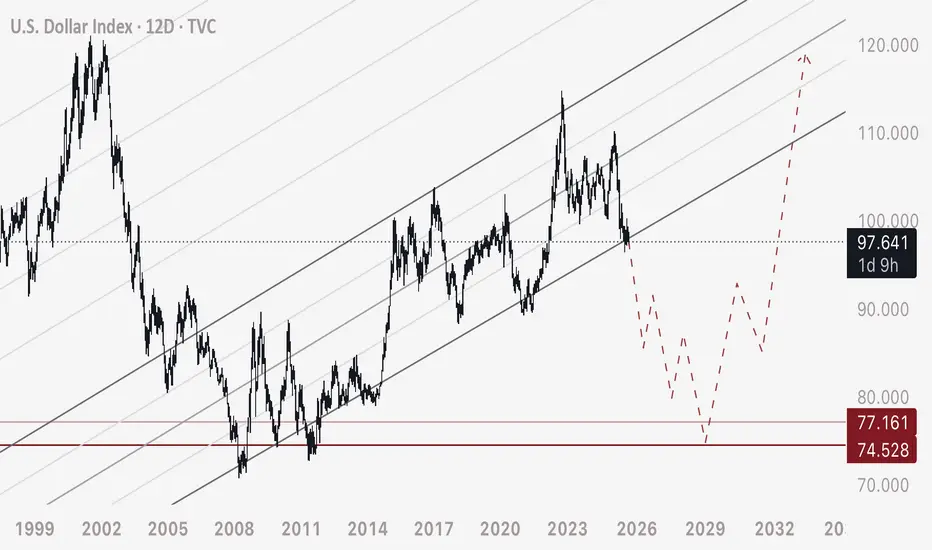
DXY - Major Breakdown of bearish StructureDXY has broken down and is currently retesting a breakdown of this major ascending channel on the weekly - monthly time frame.
Applying this to equities and Bitcoin - we can anticipate a bull run spanning 3-6 years approximately.
Due to the major event of this retest here - I expect that Bitcoin and manipulated markets will see a flash crash of severe magnitude, popping the balloon of the over- leveraged market caps.
No black swan is needed to see this take place on Bitcoin. The charts been rising steadily and holding since 2023 - this attracts long leveraged positions and consequently their stop loss orders. Sell orders are cascading in the chart all the way down to 10,000 - and only fill when price crosses.
This is the event that will pop the bubble before we see stability in the bull run. I don’t expect the equities markets to drop substantially at all - rather I believe we will continue to rise for 3-6 years coinciding with DXY breakdown.
BTC – Bullish Head & Shoulders Pattern!Bitcoin is currently showing signs of a bullish inverse head & shoulders pattern on the 4H chart. This setup is typically a reversal signal, suggesting potential upside if the neckline resistance is broken.
Key Highlights:
- Left Shoulder, Head, Right Shoulder formation is clearly visible.
- Neckline Resistance: Around $113,500 – a breakout above this level could confirm the pattern.
- Potential Upside: If confirmed, BTC could see a strong move toward higher resistance zones.
- Volume Watch: A breakout backed by strong volume would add conviction.
Cheers
Hexa
CRYPTOCAP:BTC BITSTAMP:BTCUSD BINANCE:BTCUSDT

BTC/USDT Analysis. Breakout of the Local High
Hello everyone! This is a trader-analyst from CryptoRobotics, and here’s the daily market analysis.
Yesterday, Bitcoin failed to immediately update the high: the $112,600–$112,000 support did not hold as expected and was broken downward.
After reaching the $111,000–$110,600 volume zone, we saw a strong buyer reaction, which eventually pushed the price to break the local high.
Currently, the price is approaching resistance, while a new support has formed just below at $113,700–$113,000 based on pushing volumes. We’ll be watching the reaction here to make decisions based on the context.
Buy Zones:
$113,700–$113,000 (pushing volumes)
$108,000–$102,500 (accumulated volumes)
Sell Zones:
$114,400–$115,500 (volume area)
~$116,500 (volume anomaly)
$117,200–$119,000 (accumulated volumes)
$121,200–$122,200 (buying absorption)
This publication does not constitute financial advice.

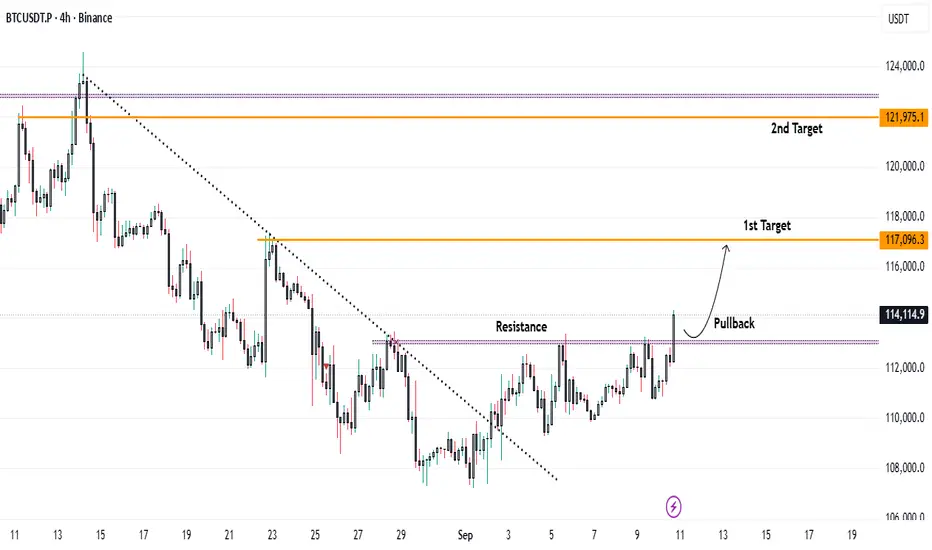
Bitcoin Breaks Key Resistance – Upside Targets in Focus...Bitcoin has been consolidating below the $113,000 resistance level over the past few sessions. On the hourly timeframe, price has now successfully broken above this barrier and is sustaining the breakout.
📈 Trading Outlook:
* A pullback towards $113,000 could offer a favorable long entry opportunity.
* Upside Targets:
* First target: $117,000
* Second target: $122,000
The breakout and successful close above resistance suggest strong bullish momentum, provided price holds above the $113,000 zone.
BITCOIN PREDICTION: IS USA MANIPULATING THE MARKET?! (big move) Yello Paradisers! We have been taking a look at what's going on with the new data release from USA. We have been taking a look at the CME futures gap. We have been taking a look at the multi-timeframe analysis on the ultra-high timeframe chart. We have been going through the moving average touch channel possible reclaim and the Elliott Wave Theory on multiple timeframes. I've shared with you where, with the highest probability, the next move will happen and what kind of confirmations we are waiting for.
Paradisers! Keep in mind to trade only with a proper professional trading strategy. Wait for confirmations. Play with tactics. This is the only way you can be long-term profitable.
Remember, don’t trade without confirmations. Wait for them before creating a trade. Be disciplined, patient, and emotionally controlled. Only trade the highest probability setups with the greatest risk to reward ratio. This will ensure that you become a long-term profitable professional trader.
Don't be a gambler. Don't try to get rich quick. Make sure that your trading is professionally based on proper strategies and trade tactics.

Bitcoin BTC is at a Critical Level: Equal Highs Trade Plan💰 Bitcoin (BTC) Update 💰
BTC is currently trending upward 🟢📈 on the 30M timeframe ⏰ and has reached a critical level ⚖️. We’re seeing a shift in structure 🔄, but there are equal highs forming 📍, leaving the question: will price break higher and continue bullish 🚀, or reject and move lower 🔽?
📊 My trade plan is simple:
✅ Wait for a break above the current range/equal highs 📈
✅ Look for a retrace + retest 🔄
✅ Enter long on confirmation 🎯
If this setup fails to play out, then the idea is invalidated ❌ and we stand aside.
⚠️ This analysis is for educational purposes only and not financial advice. 📚

BTC weak consolidation....could drop hardTechnicals are not looking good for BTC. Massive drop from 124k and really struggling to make headway above 110k. SMA lines show weakness and moving towards 200SMA, which if broken could lead to the next support line of around 70k.

BTC/USDT Analysis. Expecting a Breakout of the Local High
Hello everyone! This is a trader-analyst from CryptoRobotics, and here’s the daily market analysis.
Yesterday, Bitcoin tested the previously marked sell zone at $112,200–$113,200 (volume area), where we saw only a minor reaction.
The overall context, along with the large cluster of stop orders above $113,500, suggests a high probability of continued upward movement toward the next resistance zones: $114,400–$115,500 (volume area) and ~$116,500 (volume anomaly). At those levels, it will be important to watch for selling pressure, as another significant correction may occur.
Currently, the price is holding above local support at $112,600–$112,000. If buyers manage to protect this zone, we can expect another upward impulse. A breakdown and consolidation below it, however, may extend the decline at least toward the next support.
Buy Zones:
$111,000–$110,600 (volume area)
$108,000–$102,500 (accumulated volumes)
Sell Zones:
$114,400–$115,500 (volume area)
~$116,500 (volume anomaly)
$117,200–$119,000 (accumulated volumes)
$121,200–$122,200 (buying absorption)
This publication does not constitute financial advice.
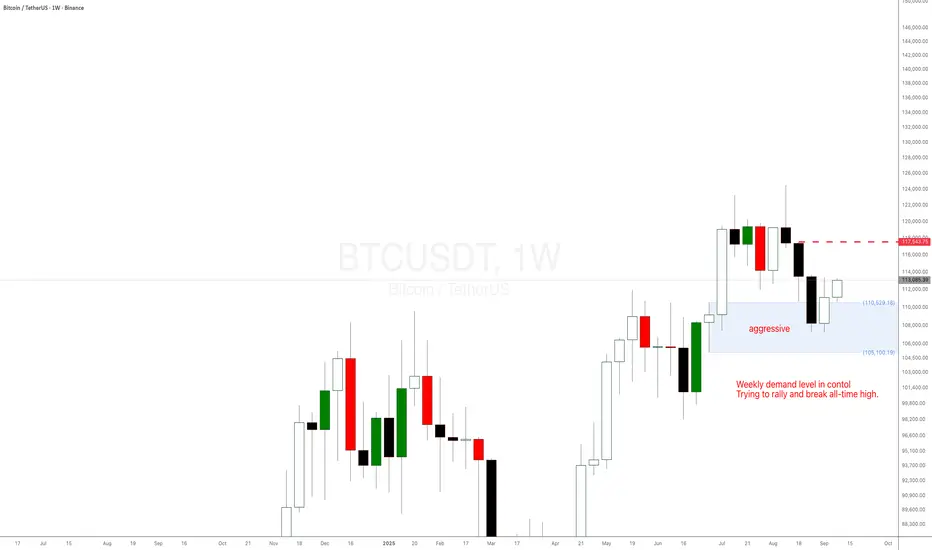
BitCoin BTC is trying to break all-time high with weekly demandBitCoin BTC is trying to break all-time high with the help of the aggressive weekly demand level at $110,500. Trying to rally and break all-time high again.
Bitcoin : Stay heavy on positionsBitcoin : Stay heavy on positions (2x~3x)
Maintaining the same outlook as before.
** This analysis is based solely on the quantification of crowd psychology.
It does not incorporate price action, trading volume, or macroeconomic indicators.

BITCOIN PREDICTION: MASSIVE MOVE INCOMING!!! (Guard UP NOW) Yello Paradisers! In this video, we are professionally analyzing Bitcoin. We are doing multi-time frame analysis as professional traders. First, we are starting on an ultra-high time frame chart where I'm sharing with you the magical moving average trend line, how it's perfectly working as a support, and the possible channel retest and the bearish cross.
On the high timeframe chart, we are looking at a zigzag that has finished with the highest probability. The first wave of an impulse has started—that is the question. We have a bullish divergence plus a shooting star, and we are waiting for the daily candle to close and reclaim that resistance to confirm some nice long positions.
On the medium timeframe, I'm sharing with you the bearish divergence we are waiting for across and the possibility of finishing the first wave.
On the low timeframe chart, we are going through the ending diagonal. Watch the fourth high; it cannot be reclaimed. Until it gets reclaimed, we are actively looking for short positions. We are anticipating a huge move, and we are going to be positioning ourselves aggressively very soon.
Paradisers! Keep in mind to trade only with a proper professional trading strategy. Wait for confirmations. Play with tactics. This is the only way you can be long-term profitable.
Remember, don’t trade without confirmations. Wait for them before creating a trade. Be disciplined, patient, and emotionally controlled. Only trade the highest probability setups with the greatest risk to reward ratio. This will ensure that you become a long-term profitable professional trader.
Don't be a gambler. Don't try to get rich quick. Make sure that your trading is professionally based on proper strategies and trade tactics.

Bitcoin Price History Says BTC Needs To Crash 8% To Form New ATHAt the time of writing, Bitcoin trades at $112,221, holding firm above the $110,000 support. This resilience reinforces the four-month uptrend line and signals potential short-term gains. The momentum is intact, with BTC eyeing higher levels.
If sustained, Bitcoin could climb past $112,500 and head toward $115,000. Yet to reach a new ATH, history suggests BTC might need to drop to $101,634 first, setting the stage for a stronger breakout.
On the flip side, if profit-taking escalates, BTC could slip toward the retracement level sooner. But should fear-driven selling dominate, the price risks falling below $100,000, which would invalidate the bullish outlook and extend the correction phase.

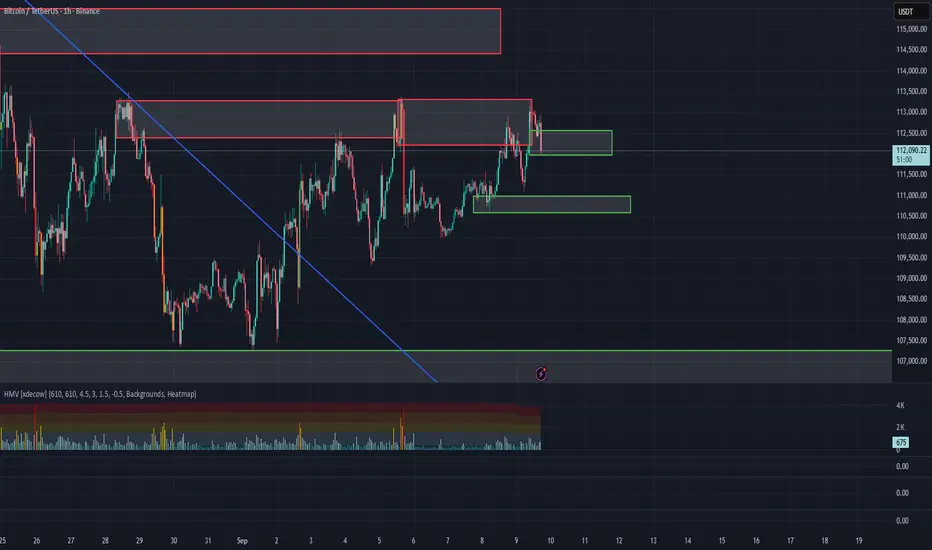
Bitcoin Quick Buy Opportunity for Quick TradersBTC,
Currently, Bitcoin is trading within a tight consolidation range, caught between a descending trendline and an ascending trendline on the 1-hour chart.
The price is forming a potential compression pattern, which often precedes a breakout.
while volume spikes indicate active demand around the green zone.
Additionally, there are visible whale buy orders and volume confirmation near the ascending trendline shown in the chart, strong enough to potentially push the price higher.
These orders are clustered around 110,650.
I will follow a strategy and enter from the same level.
My plan is as follows:
✅ Entry: Buy if price retraces to green line 110,650
🎯 Target 1: 111,250
🎯 Target 2: 111,600
Please keep monitoring this setup, as I use strategies based on observing supply and demand flows.
I will update you with any changes in entry points, targets, or shifts in order book dynamics.
Important Note:
This is not financial advice.
I am only sharing my own trades and personal analysis, which reflect my individual perspective.
Please always do your own research.
Good luck in your trades.
Best Regards 🌹

Analytics: Market outlook and forecasts
📈 WHAT HAPPENED?
Last week, Bitcoin reached the first sell zone at $112,400-$113,300 (local volume zone), from which we’ve already received a reaction twice.
During the last test of this zone, a large volume was formed, which was positioned in short. This indicates the potential for a decline to the level of $108,000. On the other hand, the untested liquidity beyond the $113,500 level suggests the opposite and acts as a "magnet" for the price.
Currently, we’re trading within a local range where market sales are being absorbed.
💼 WHAT WILL HAPPEN: OR NOT?
We anticipate a move towards the new zone of $112,200-$113,200 (volume zone), from which a short-term movement is likely to develop if there is a reaction.
The opposite scenario is a strong breakout of this zone during buyer activity. In this case, a test of the $114,400-$115,500 zone (volume zone) and the ~$116,500 level (volume anomaly) is likely.
In this scenario, the $112,200-$113,200 marks will become a mirror volume support zone, and the global long trend will resume.
Buy Zones:
$108,000–$102,500 (accumulated volumes)
Sell Zones:
$112,200–$113,200 (volume zone)
$114,400–$115,500 (volume zone)
~$116,500 (volume anomaly)
$117,200–$119,000 (accumulated volumes)
$121,200–$122,200 (buy absorption)
📰 IMPORTANT DATES
Macroeconomic events this week:
• September 10, Wednesday, 12:30 (UTC) - publication of the US Producer Price Index (PPI) for August;
• September 11, Thursday, 12:15 (UTC) - announcement of the Eurozone deposit rate for September and the Eurozone interest rate decision;
• September 11, Thursday, 12:30 (UTC) — publication of the US basic consumer price index and the number of initial jobless claims for August;
• September 11, Thursday, 12:45 (UTC) — press conference of the European Central Bank (ECB);
• September 12, Friday, 6:00 (UTC) — publication of the UK GDP for July and the German consumer price index for August.
*This post is not a financial recommendation. Make decisions based on your own experience.
#analytics
