Bitcoin Targets $116K or $104K Post-CPIMy main bias is to the upside, expecting more upward movement, contingent on holding $104,770. The upcoming CPI data is the key catalyst. On the 4-hour chart, a break above $111,721 targets $116,722, while a break below $109,464 targets the key support zone at $104,777.
Bitcoinprediction

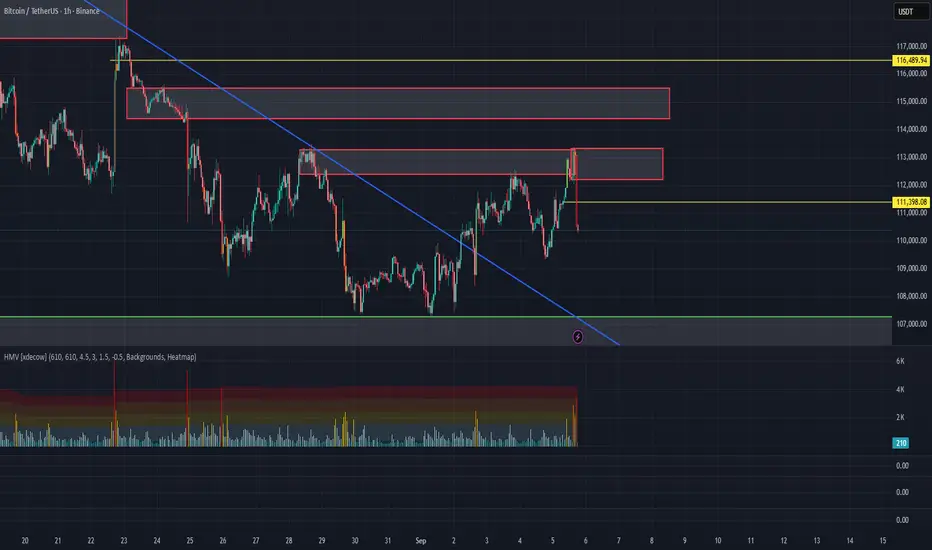
BTCUSD H1 | Pullback resistance triggering bearish reversalBitcoin (BTC/USD) is rising towards the sell entry of 112,278.38, which is a pullback resistance that aligns with the 61.8% Fibonacci retracement and could reverse from this level to the downside.
Stop loss is at 114,720/58, which is a pullback resistance that aligns with the 138.2% Fibonacci extension.
Take profit is at 109,371.71, which is a pullback support.
High Risk Investment Warning
Trading Forex/CFDs on margin carries a high level of risk and may not be suitable for all investors. Leverage can work against you.
Stratos Markets Limited (tradu.com ):
CFDs are complex instruments and come with a high risk of losing money rapidly due to leverage. 65% of retail investor accounts lose money when trading CFDs with this provider. You should consider whether you understand how CFDs work and whether you can afford to take the high risk of losing your money.
Stratos Europe Ltd (tradu.com ):
CFDs are complex instruments and come with a high risk of losing money rapidly due to leverage. 66% of retail investor accounts lose money when trading CFDs with this provider. You should consider whether you understand how CFDs work and whether you can afford to take the high risk of losing your money.
Stratos Global LLC (tradu.com ):
Losses can exceed deposits.
Please be advised that the information presented on TradingView is provided to Tradu (‘Company’, ‘we’) by a third-party provider (‘TFA Global Pte Ltd’). Please be reminded that you are solely responsible for the trading decisions on your account. There is a very high degree of risk involved in trading. Any information and/or content is intended entirely for research, educational and informational purposes only and does not constitute investment or consultation advice or investment strategy. The information is not tailored to the investment needs of any specific person and therefore does not involve a consideration of any of the investment objectives, financial situation or needs of any viewer that may receive it. Kindly also note that past performance is not a reliable indicator of future results. Actual results may differ materially from those anticipated in forward-looking or past performance statements. We assume no liability as to the accuracy or completeness of any of the information and/or content provided herein and the Company cannot be held responsible for any omission, mistake nor for any loss or damage including without limitation to any loss of profit which may arise from reliance on any information supplied by TFA Global Pte Ltd.
The speaker(s) is neither an employee, agent nor representative of Tradu and is therefore acting independently. The opinions given are their own, constitute general market commentary, and do not constitute the opinion or advice of Tradu or any form of personal or investment advice. Tradu neither endorses nor guarantees offerings of third-party speakers, nor is Tradu responsible for the content, veracity or opinions of third-party speakers, presenters or participants.

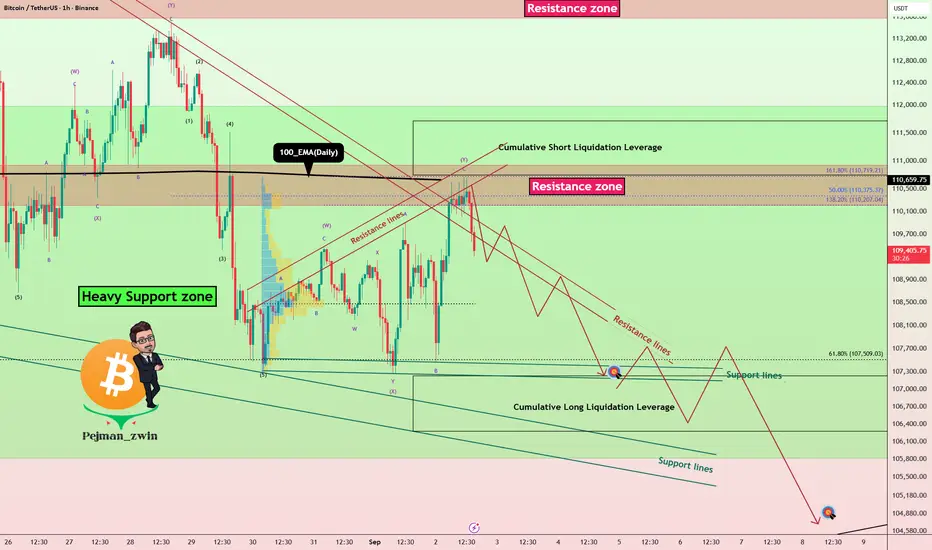
Bitcoin Roadmap – Breakdown Toward $107K or Bounce?Bitcoin ( BINANCE:BTCUSDT ) has been moving with high momentum this week , with the US indexes and Gold ( OANDA:XAUUSD ) bullish .
Bitcoin is currently trying to break the Support lines , Support zone($110,920-$110,200) and 100_EMA(Daily) .
In terms of Elliott Wave theory , it seems that the waves that Bitcoin has made this week have been in the form of a Triple Three Correction(WXYXZ) .
I expect Bitcoin to decline to at least $109,133(First Target) AFTER the Supports are broken.
Second Target: $107,740
Third Target: $106,660
Stop Loss(SL): $114,108(Worst)
Note: As I said at the beginning of this analysis, the financial markets have been a bit emotional and sudden with their movements this week, so always be prepared for any scenario and pay more attention to capital management.
Note: Generally, trading volume is low on Saturdays and Sundays. Perhaps it is a bit far-fetched to expect a break of the Heavy Support zone($111,980-$105,820) during the weekend. What do you think?
Cumulative Short Liquidation Leverage: $114,976-$113,440
Cumulative Short Liquidation Leverage: $111,907-$111,607
Cumulative Long Liquidation Leverage: $109,346-$108,259
Cumulative Long Liquidation Leverage: $107,181-$106,479
CME Gap: $117,235-$113,800
Please respect each other's ideas and express them politely if you agree or disagree.
Bitcoin Analysis (BTCUSDT), 1-hour time frame.
Be sure to follow the updated ideas.
Do not forget to put a Stop loss for your positions (For every position you want to open).
Please follow your strategy and updates; this is just my Idea, and I will gladly see your ideas in this post.
Please do not forget the ✅' like '✅ button 🙏😊 & Share it with your friends; thanks, and Trade safe.
BITCOIN IDEA FOR NEXT FEW YEARS Based on technical analysis CRYPTOCAP:BTC can go back to 50-70k zones, to sweep the liquidity.
That would be very healthy movement from CRYPTOCAP:BTC , if we want to expect future big moves up to 200-250k per coin.
Bitcoin is too hyped to broke down to lower price than 50k, many institution and companies are getting into crypto and using it as a payment method. Not only Bitcoin, but CRYPTOCAP:XRP , CRYPTOCAP:ETH and CRYPTOCAP:SOL as well.
So priority is to put focus on Bitcoin, because other cryptos are following Bitcoin's movement.
Let's see what the future bring us and let's not miss this opportunity to get advantage.

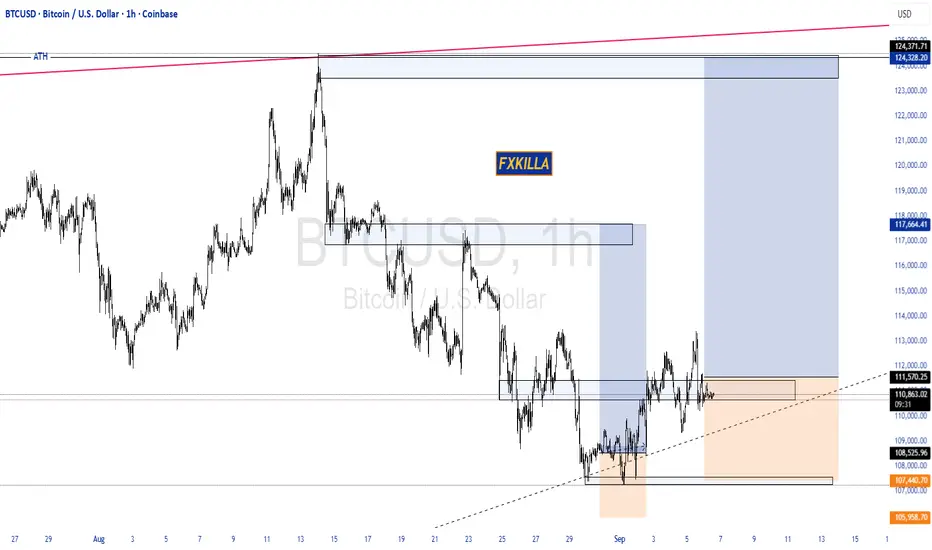
BITCOIN HIGH PROBABILITY SETUP SOON!!!🚨 BITCOIN HIGH PROBABILITY BUY SETUP 🚨
* Here We Can See The Next Potential Move For BTC Coming Hours/Days.
* Keep Your Eyes Close On Your Trading Positions.
* Happy PIP Hunting Traders.
FXKILLA.
Lets Predict BTC on 13th Sept 2025On 13th Sept 2025
BTC should touch 106000
As the Trend is downwards and the mid of the down channel will meet 106000 on 13th sept 2025.

Bitcoin: Edges HigherToday, Bitcoin is once again trading slightly higher than it was at the time of our update yesterday. As a result, it remains possible that price could soon make another move into the upper blue Target Zone ($117,553 – $130,891), so green wave B can form its final high. The subsequent wave C is then expected to drive BTC down significantly—ultimately completing the larger wave a and thus the first phase of the three-part wave (ii) correction in the lower blue zone ($62,395 – $51,323). Additionally, our alternative bullish scenario remains relevant. We currently estimate a 32% chance that Bitcoin is still advancing within blue wave alt.(i) and will climb into the orange alternative Target Zone ($148,363 – $168,443) to complete this move.

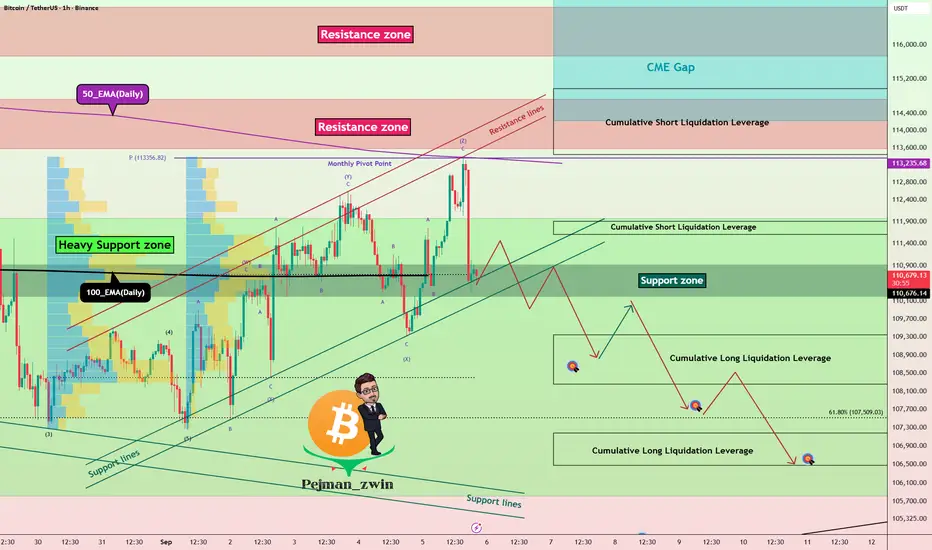
Bitcoin’s Heavy Support Zone Under Attack–Will It Finally Break?Bitcoin ( BINANCE:BTCUSDT ) currently appears to have completed its pullback to the 100_EMA(Daily) , and Bitcoin has failed to break the Resistance lines with high momentum. The Resistance zone($110,920-$110,200) , Resistance lines , and Cumulative Short Liquidation Leverage($111,711-$110,745) could prevent Bitcoin from rising.
In terms of Elliott Wave theory , Bitcoin appears to have completed the wave Y of the Double Three Correction(WXY) .
I expect Bitcoin to decline at least to the Support lines and Cumulative Long Liquidation Leverage($107,230-$106,277) . And there is a possibility that Bitcoin will eventually break the Heavy Support zone($111,980-$105,820) in this attack .
Do you think Bitcoin can finally break the Heavy Support zone($111,980-$105,820)?
CME Gap: $117,235-$113,800
Stop Loss(SL): $111,880(Worst)
Please respect each other's ideas and express them politely if you agree or disagree.
Bitcoin Analyze (BTCUSDT), 1-hour time frame.
Be sure to follow the updated ideas.
Do not forget to put a Stop loss for your positions (For every position you want to open).
Please follow your strategy and updates; this is just my Idea, and I will gladly see your ideas in this post.
Please do not forget the ✅' like '✅ button 🙏😊 & Share it with your friends; thanks, and Trade safe.
BTC/USDT Analysis. Manipulation During Macro Data Release
Hello everyone! This is the CryptoRobotics trader-analyst, and here is the daily market analysis.
Yesterday, Bitcoin reached the support level of $110,000. Just below this mark, we observed unusually strong buyer activity for this local downtrend wave, which was clearly visible in the delta. As a result, the price quickly moved back toward the local high.
Previously, we had left the resistance zone at $112,400–$113,300 (local volume zone) untouched, since liquidity above the high remained untested. As of now, this zone has been fully filled. During the release of U.S. macroeconomic data, large volumes entered Bitcoin and positioned themselves to the short side.
Trading priorities have shifted once again — at the moment, it is more favorable to look for short opportunities on pullbacks. The nearest downside potential is toward $108,000 and a possible retest of the recent low.
The zone $112,400–$113,300 remains relevant, but has shifted slightly to $112,200–$113,200.
Buy Zones:
$108,000–$102,500 (accumulated volumes)
Sell Zones:
$112,200–$113,200 (volume zone)
$114,400–$115,500 (volume zone)
~$116,500 (volume anomaly)
$117,200–$119,000 (accumulated volumes)
$121,200–$122,200 (buy absorption)
This publication is not financial advice.
History Suggests Bitcoin Price Is Fated To ConsolidateBitcoin crossing the $112,500 resistance is encouraging, providing a path toward $115,000. This level is crucial for attracting new capital inflows, which would validate the recovery and increase the likelihood of sustained upward momentum.
However, historical patterns suggest consolidation remains likely. Bitcoin may settle under $115,000 or slip below $112,500, with sideways price action dominating the short term as the market absorbs recent volatility.
If profit-taking accelerates, Bitcoin could face sharper declines. A drop back to $110,000, or even a loss of this support, would weaken sentiment and invalidate the bullish thesis, leaving BTC vulnerable to extended consolidation or further downside.

BTC Triangle Squeeze: Next Stop $116K?Bitcoin is currently consolidating inside a symmetrical triangle, a classic squeeze that often precedes a strong breakout 💥. Price is building pressure with higher lows and lower highs, waiting for confirmation.
✅ Bullish Confluences:
Price is respecting triangle support and holding the structure.
Fibonacci retracement shows potential upside continuation.
Momentum is shifting after a prolonged corrective move.
🎯 Fibonacci Upside Targets:
🌟38.2% – $112,876
🌟61.8% – $114,195
🌟100% – $116,329
⚠️ Invalidation / Stop-Loss Zone:
If price breaks below $107,000 – $105,000, the bullish setup is invalidated ❌.
As long as BTC stays inside the triangle and above key support, the squeeze favors a bullish breakout

BTC - TP4 hit - Road to 115,700$ - 116,000$ BTC - TP4 ✅
All target hit ✅
Following the plan ==> 110,000$ tested as support, then 115,700 - 116,000$ 📈
#ALTS market might remain green if we hold above this support.

Bitcoin Going down down?
No fuss.
Weekly Chart.
Bearish Fair Value gap created.
Last Bullish Fair Value Gap closed out.
Unmitigated Bullish FVG around the 90k area.
Same price drop as last retrace to 50% of the FVG.
Could go there, maybe, who knows.
Keep it simple though.
Indicator used for FVG's

NFP Jobs Data Could Trigger $116K or $105K Bitcoin MoveBitcoin is testing a critical breakout above $112,168 as markets prepare for tomorrow’s Non-Farm Payrolls report. The 4-hour chart has shown positive momentum, with BTC clearing resistance at $110,918 and pushing toward $112,856. If bulls can hold above $112K, the roadmap opens to $114,189 and $116,072. But if Bitcoin loses momentum, supports sit at $110,918, $108,592, and the deeper zone near $105,320.
The jobs report could be the catalyst that decides Bitcoin’s next big move. Consensus is around 75,000 jobs, just above last month’s 73,000. A weaker report could boost risk assets like Bitcoin as traders price in more Fed cuts. But a stronger print could cool risk sentiment and pressure BTC back into support. Either way, volatility is coming, and these levels will be key.

BTC/USDT Analysis. Moving Within the Scenario
Hello everyone! This is the CryptoRobotics trader-analyst, and here is the daily market analysis.
Yesterday, Bitcoin reached the resistance zone of $112,400–$113,300 (local volume zone) and, after consolidating briefly, entered a natural correction.
At the moment, the price has approached the support level of ~$110,000 (market sell absorption), where we already see increased trading activity. This level is becoming a key point of the current structure. If buyers defend this zone and sellers remain weak, we can expect a continuation of the long trend with the next target at $114,400–$115,500.
However, if buyers lose this local battle, the price will likely head back toward the recent local low.
Buy Zones:
~$110,000 (market sell absorption)
$108,000–$102,500 (accumulated volumes)
Sell Zones:
$112,400–$113,300 (local volume zone)
$114,400–$115,500 (volume zone)
~$116,500 (volume anomaly)
$117,200–$119,000 (accumulated volumes)
$121,200–$122,200 (buy absorption)
This publication is not financial advice.

Bitcoin All Time Highs Forecasted DateWas just working on a new study showing the number of months and days between prior ATH's for Bitcoin has typically been between 46-49 months or 1400 to 1492 days as shown in the Green boxes.
Based on the 2017 cycle, that puts this cycle ATH around November 1st 2025.
So we don't have much time if this cycle is going to play out like prior ones.
Also global liquidity is slowing down, and BTC is deviating from following M2 Money Supply.
However, the daily cycle low is signaling a local bottom is in here.
What do you think?

Analysis BTC/USDT. Will the growth continue?
Hello everyone! This is a trader-analyst from CryptoRobotics, and here is the daily analysis.
Yesterday, Bitcoin updated its local high and continues to move according to our planned scenario.
Currently, the price is consolidating in a sideways range, where we notice absorption of market selling. The potential remains bullish — toward the next selling zones.
During this upward move, a new support point has formed with strong seller absorption around ~$110,000. If tested, we may expect buyer activity.
Buy Zones:
~$110,000 (market sell absorption)
$108,000–$102,500 (accumulated volumes)
Sell Zones:
$112,400–$113,300 (local volume zone)
$114,400–$115,500 (volume zone)
~$116,500 (volume anomaly)
$117,200–$119,000 (accumulated volumes)
$121,200–$122,200 (buying absorption)
This publication is not financial advice.

BTCUSD Bircoin drop, sell your minning farm, but just for nowThis Diagonal is still valid for me, selll @ 113.400
Targets 105.000 / 102.000 and 99.000
GG

133K still thereBitcoin is forming the same structure it did on April 7, the conclusion of a megaphone pattern pointing to 133K. The new micro-megaphone is in its final phase, which indicates it’s a good time to take positions.

Analysis BTC/USDT. Local Long Trend
Hello everyone! This is a trader-analyst from CryptoRobotics, bringing you the daily market review.
Yesterday, buyers dominated in Bitcoin, and by now the price has broken through the descending trendline. A sustainable long trend has not yet been established — the price retested the POC zone of the lower range. However, the buyer’s reaction was strong enough, which increases the probability of a move towards the selling zones.
It is important to note: even if the price rises further, this cannot yet be considered a completed reversal. From the resistance levels above, strong selling pressure may resume. If buyers fail to show sufficient strength, the market could update the current low.
Buy Zones:
$108,000–$102,500 (accumulated volumes)
Sell Zones:
$112,400–$113,300 (local volume zone)
$114,400–$115,500 (volume zone)
~$116,500 (volume anomaly)
$117,200–$119,000 (accumulated volumes)
$121,200–$122,200 (buying absorption)
This publication is not financial advice.

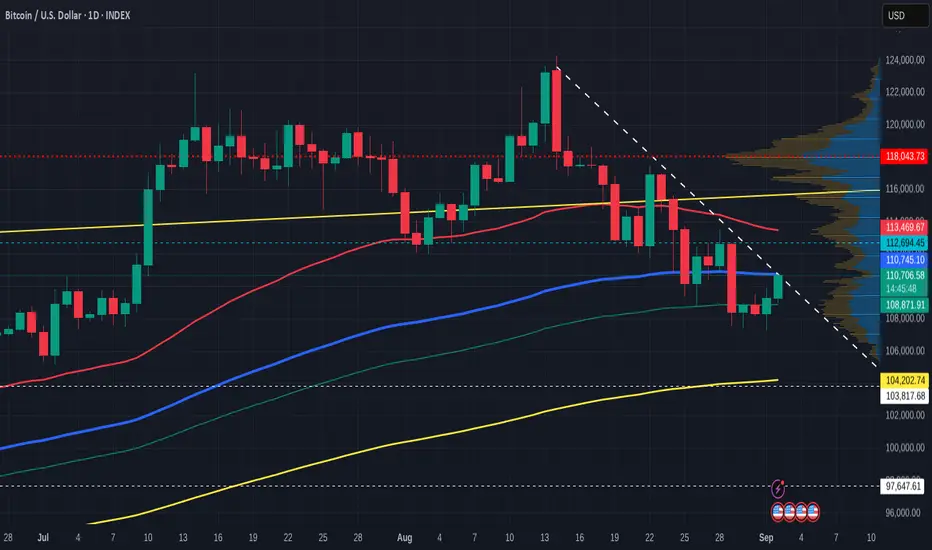
Bitcoin Daily on Lower Low Lower high again -till ?
This chart uses the SMA. Red - 50, Blue - 100, Green - 128 and 200 - Yellow
PA is absolutely in a descending channel with repeated Lower Low Lower high on a daily chart
Today, we will see if we break that or not as PA reaches resistance on a Trend line.
The 50 SMA is descending as potential resistance when the day comes were PA breaks out and reaches higher.
This will happen as I do not believe we are entering a Deep Bear..This is a Local "Cool off" but we may hit a tough one at that 50 SMA at around 113K
Till then, we are hitting the 100 as resistance and the 128 as support.
This may break today as we hit that line of resistance with the 128 SMA not far below.
The DAILY MACD offers some hope of strength as we see it bouncing off oversold
We will have to watch today close to see where we go
If we get rejected today, Next stop down could be the 200 SMA at around 103K low
This line needs to hold to show use confidence in the Bulls.
My line of concern will be reached if e go to 95K and fall through.
This daily chart below shows a number of things to support what is written above.
On this , we see the 2.618 Fib extension around the same area as the 200 day SMA @ 103900 usd
The circle highlights a point where a 236 Fib circle crosses over a rising line of support.
This is around 97K and just below this is another line of support around 95K
People that follow me will know that I often highlight 236 Fib circles as lines of strong resistance and on this occasion, this maybe Exactly why we see PA dropping now.
The intersection is near the end of September, a usually slow month that has a majority of RED Candle Closes on a month chart ( 9 red to 5 Green since 2013)
I am not saying we will get to this level but the potential does exist while we remain in a down trend....
I would hope that PA bounces off the Fib extension on that 200 SMA if we get near that 104K line.
On a longer term, we should take note of the WEEKLY MACD
Should this continue down the line drawn, that takes us to Late October before a bounce ur a more sustained push higher.
We should keep this in mind
I welcome any comments ( Sensible ones..)
Analytics: market outlook and forecasts
📈WHAT HAPPENED?
Last week was marked by an update of the local minimum again. However, the breakdown turned out to be uncertain and weak, accompanied by delta absorption.
We've rebuilt the global buying zone on the daily chart: now it's in the range of $108,000-$102,500. Until the price is fixed below these levels, the global trend can be considered upwards.
In the short term, bitcoin is still in a downward trend. It's extremely risky to open long positions before the breakdown of the inclined line. The seller's activity remains limited, but the buyer doesn't take the initiative either.
💼 WHAT WILL HAPPEN: OR NOT?
The main scenario for the current week is the expansion of the range to collect liquidity in both directions.
The minimum is most likely not formed yet. For a more confident decline, the market needs more activity. This requires two conditions: an increase in open interest from the buyer and liquidity in the form of stop orders.
For now, it's better to refrain from trading the first cryptocurrency or, in anticipation of the resumption of the global long trend, consider grid spot strategies.
Buy Zones:
• $108,000–$102,500 (accumulated volumes)
Sell Zones:
• $112,400–$113,300 (local volume zone)
• $114,400–$115,500 (volume zone)
• ~$116,500 (volume anomaly)
• $117,200–$119,000 (accumulated volumes)
• $121,200–$122,200 (buy absorption)
📰 IMPORTANT DATES
The following macroeconomic events are expected this week:
• Tuesday, September 2, 09:00 (UTC) — publication of the consumer price index in the Eurozone for August;
• Tuesday, September 2, 13:45 (UTC) — publication of the index of business activity in the manufacturing sector (PMI) USA for August;
• Wednesday, September 3, 14:00 (UTC) — publication of the number of open vacancies in the labor market (JOLTS) USA for July;
• Thursday, September 4, 12:15 (UTC) — publication of changes in the number of people employed in the US non-agricultural sector in August;
• Thursday, September 4, 12:30 (UTC) — publication of the number of initial applications for unemployment benefits in the United States for August;
• Thursday, September 4, 13:45 (UTC) — publication of the business activity index (PMI) in the US services sector for August;
• Thursday, September 4, 14:00 (UTC) — publication of the Purchasing Managers' Index for the non-manufacturing sector (ISM) USA for August;
• Friday, September 5, 12:30 (UTC) — publication of the average hourly wage, changes in the number of people employed in the non-agricultural sector and the unemployment rate in the United States for August.
*This post is not a financial recommendation. Make decisions based on your own experience.
#analytics

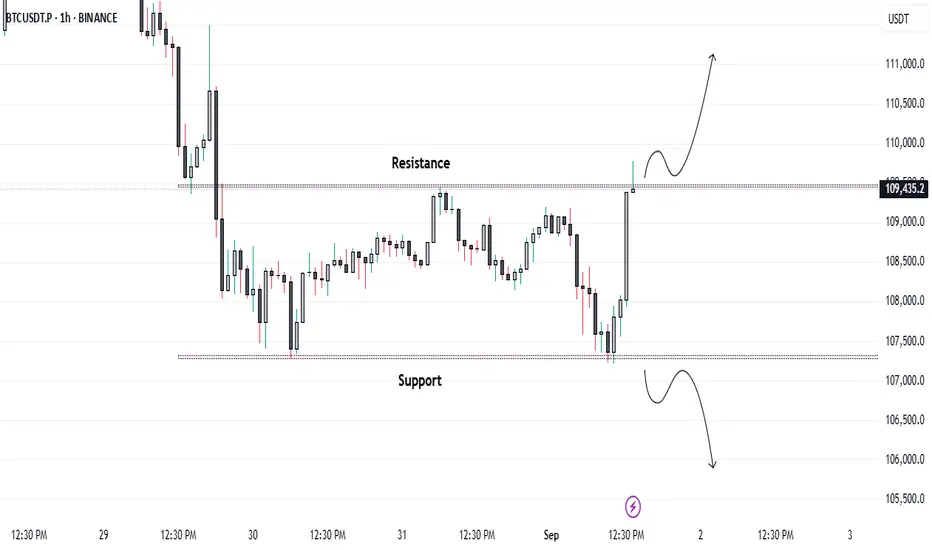
Bitcoin Breakout Watch: Key Levels Ahead...Bitcoin is consolidating in a tight range on the 1-hour timeframe and is showing strong momentum as it tests the $109,500 resistance zone. A decisive breakout and sustained close above this level could trigger a move toward the $112,000 mark, signaling bullish momentum building in the market.
Keep a close watch on volume confirmation for a stronger breakout signal. 📈