BTC on the beat :))))everything has gone according to analysis. I hope you have enjoyed the sell positions. Make sure to save profit and manage your positions or make them risk free.
Bitcoinprediction

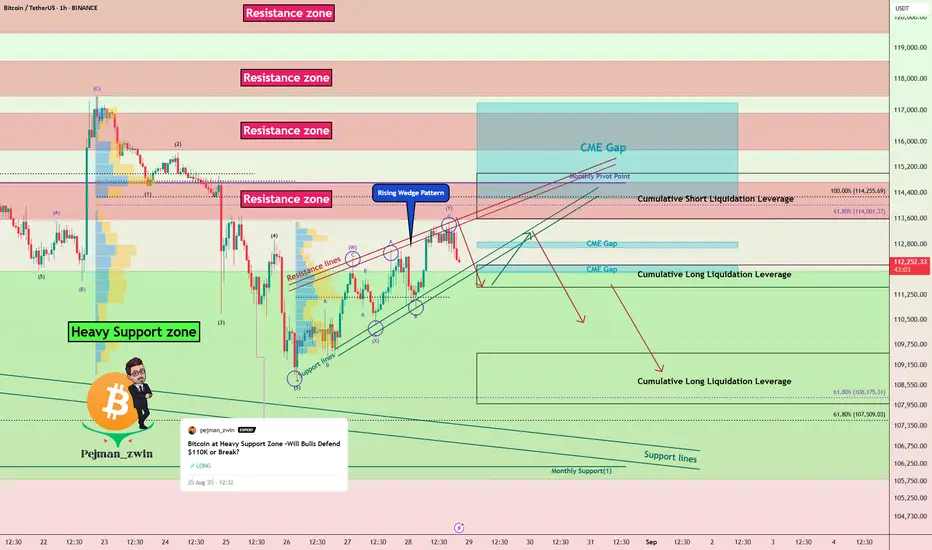
Bitcoin at Make-or-Break: Will BTC Fill the CME Gap?Bitcoin ( BINANCE:BTCUSDT ) increased to $113,500 as I expected in my previous idea .
Do you think Bitcoin can fill the upper CME Gap($117,235-$113,800) !?
Bitcoin is currently moving near the Resistance zone($114,720-$113,580) , Cumulative Short Liquidation Leverage($115,000-$113,588) , Resistance lines , and Monthly Pivot Point .
In terms of Elliott Wave theory , Bitcoin’s movement over the past 2 days has been in the form of corrective waves and has had low momentum . The corrective wave structure is a Double Three Correction(WXY) .
From a Classic Technical Analysis perspective, Bitcoin appears to be completing a Rising Wedge pattern .
I expect Bitcoin to move towards Cumulative Long Liquidation Leverage($109,500-$108,000) after volatile movements over the next two days .
CME Gap: $112,870-$112,700
CME Gap: $112,155-$111,940
Stop Loss(SL): $115,510(Worst)
Please respect each other's ideas and express them politely if you agree or disagree.
Bitcoin Analyze (BTCUSDT), 1-hour time frame.
Be sure to follow the updated ideas.
Do not forget to put a Stop loss for your positions (For every position you want to open).
Please follow your strategy and updates; this is just my Idea, and I will gladly see your ideas in this post.
Please do not forget the ✅' like '✅ button 🙏😊 & Share it with your friends; thanks, and Trade safe.
A Question many people don't know the answer to.In this post we’ll answer a question many people don't know the answer to, and provide an in-depth explanation of why the crypto market is bound to a 4-year cycle.
🔸The answer:
-The market is tied to a key event — the Bitcoin Halving . This is when the block reward for mining Bitcoin is cut in half every 4 years. Mining is the lifeline that brings Bitcoin into circulation. Without it, there would be no supply entering the market.
But is this still effective now, given that most of Bitcoin’s supply is already mined?
The total supply of Bitcoin is fixed at 21 million, and so far, around 19.9 million have already been mined. That leaves only about 1.1 million Bitcoin still to be mined — scheduled, with halvings, until the year 2140.
I know what you’re thinking … Why does the halving still impact market behavior if the remaining supply is so small and its effect seems limited?
-History shows that after every halving, the market tends to rise for about a year and a half. This proves that investors wait for the halving to take place, monitor the network’s smooth performance during the event, and once they confirm no issues exist, they begin injecting liquidity into the market.
------------------------------------------
Is there a scenario where the 4-year cycle could change?
It’s difficult, but yes …
Why? Because since Bitcoin’s inception, its price cycle has been tied to the halving. This pattern has been consistent since 2011, across three full cycles, and now we are in the fourth.
However, the halving itself has become a symbol of trust and security for investors. Every successful halving event reinforces confidence in Bitcoin’s scarcity and strength. That’s why the 4-year rhythm will only change if another factor emerges strong enough to rival the influence of the halving.
Signs of such a new factor already appeared in 2025 — with the U.S. President’s support for Bitcoin and the growing trend of corporations and financial institutions purchasing it, alongside increased transparency in declaring holdings and reserves.
This shift is crucial. When supply moves from scattered hands (individuals) to stronger hands (corporations) , and holdings are publicly disclosed, it strengthens trust in the Bitcoin network and reduces the wild volatility that individuals once caused.
Conclusion : The 4-year cycle could evolve in the future, especially if supportive policies accelerate and corporations continue to accumulate Bitcoin in massive quantities starting from the next cycle.
Best regards
Cecilione🎯


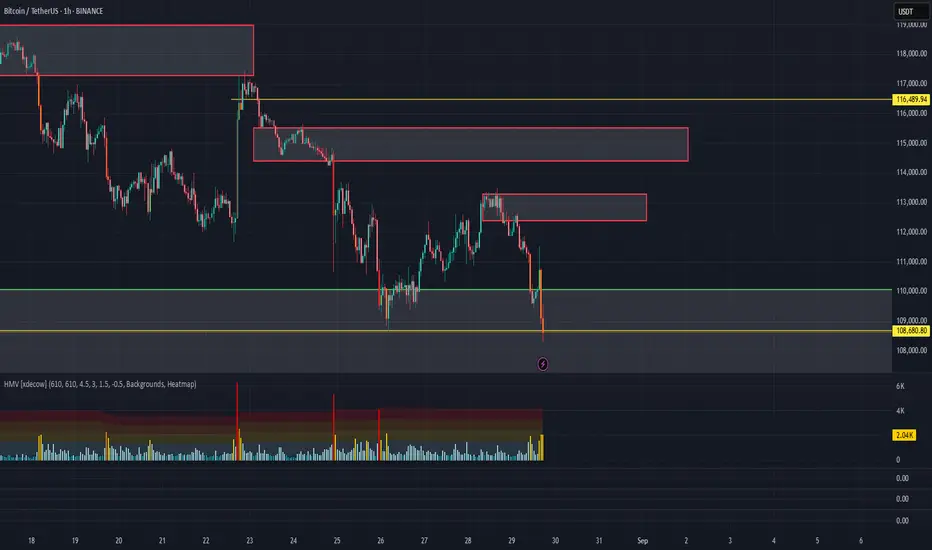
BTCUSD Faces Mid-Band Rejection: Deeper Retracement incoming Price is showing rejection around the mid-range of its volatility bands after failing to sustain above the $112,800 zone, suggesting a potential continuation lower. The setup aligns with multiple bearish signals favoring downside momentum.
✅ Bearish Confluences:
Fibonacci Resistance: Price rejected just below the 38.2% retracement level at $114,619, failing to reclaim higher ground.
Lower High Structure: Market continues to print lower highs, reinforcing the short-term bearish trend.
Volatility Band Pressure: Rejection from the mid-band area highlights weakening buy-side momentum and strengthens the case for further downside.
🎯 Fibonacci-Based Targets:
TP1 – $111,016 (38.2%): First support test within the lower range.
TP2 – $109,903 (61.8%): Deeper retracement target in line with bearish continuation.
TP3 – $108,102 (100%): Full measured move completion toward the lower volatility band.
SL: Placed above $114,620 to invalidate the short thesis in case of bullish breakout.

BTC/USDT Analysis. Testing a key low
Hello everyone! This is CryptoRobotics trader-analyst with the daily market analysis.
Yesterday, a strong market seller emerged in Bitcoin, pushing the price lower. The local zone at ~$112,000 (abnormal cluster) provided only minimal reaction.
At the moment, we have already tested the local low. Now we need to wait for a buyer’s response. If strong activity appears, the main upside potential is towards $114,400–$115,500 (volume zone). If there is no reaction, the first downside target is around $107,000.
We have updated the global buying zone on the daily chart, now defined as $108,000–$102,500. As long as the price does not consolidate below this range, the broader trend can still be considered bullish.
Buy zones:
$108,000–$102,500 (accumulated volumes).
Sell zones:
$112,400–$113,300 (local volume zone),
$114,400–$115,500 (volume zone),
~$116,500 (volume anomaly),
$117,200–$119,000 (accumulated volumes),
$121,200–$122,200 (buying absorption).
This publication does not constitute financial advice.
Bitcoin – Next Buying Area in Focus📊 Zooming out to the daily chart, CRYPTO:BTCUSD is currently correcting against the April low, following the completion of that bullish cycle. The 38.2% Fibonacci retracement near $105K stands out as a key technical zone where a higher low could form heading into September.
Structure remains intact, and patience here could unlock a cleaner entry with better risk-reward.
⚠️ Reminder: The daily buying zone spans a wide range from $105K to $97K—this isn’t a pinpoint level for random entries.
If you're a trader, you need a clear plan: defined entry levels, stop-loss, and exit strategy.
No guesswork. No chasing. Let price come to you and act with precision.

BITCOIN Bearish Breakout!
HI,Traders !
#BITCOIN made an epic
Bearish breakout of a very
Strong key horizontal level
Of 112340.5which is now a
Resistance and the breakout
Is confirmed so we are
Bearish biased and we will
Be expecting a further
Bearish move down !
Comment and subscribe to help us grow !

Bitcoin Daily update - will the 100SMA hold this time?
So, PA lost momentum and is falling abck to support on the 100 Daily SMA ( blue )
Last time we fell through the 100 we reached down to teh 128 Daily SMA ( green ) and found support
We need to watch closely and se if this happens again if the 100 fails
It is worth remembering that should the 128 fail, the 200 Daily SMA ( Yellow ) is down around 100K
After this, support lays around 94K

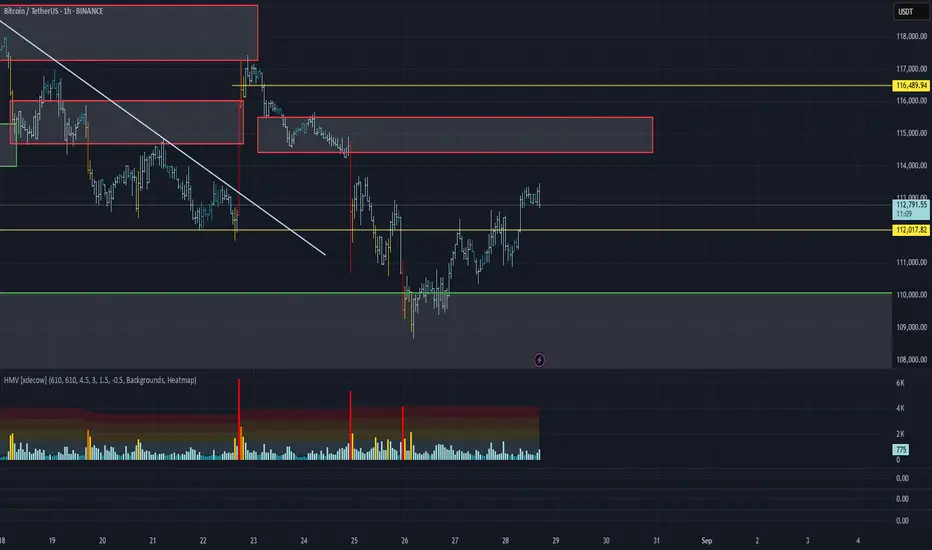
Bitcoin Reclaims Support Zone – Potential Move Toward $117KBITSTAMP:BTCUSD is rebounding from a key dynamic support zone within its descending channel, with price action now testing the mid-range of the EMA cloud structure. This bounce suggests potential short-term upside continuation if momentum holds.
✅ Bullish Confluences:
Fibonacci Retracement Support: Price respected the 38.2%–61.8% retracement zone between ~$111,330 and ~$110,218, confirming strong demand.
EMA Cloud Reclaim: Current price action is attempting to reclaim the EMA cluster, signaling improving bullish pressure.
Trend Structure: Short-term higher low forming after the recent sell-off, keeping the possibility of a reversal alive.
Candlestick Reaction: Strong rejection wicks from support levels indicate buyers stepping back in.
🎯 Fibonacci-Based Targets:
TP1 – ~$114,442 (38.2% retracement resistance).
TP2 – ~$115,555 (61.8% retracement / mid-supply zone).
TP3 – ~$117,356 (full retracement / key resistance).
🛡️ Stop-Loss: Just below $110,800 (61.8% support breakdown), invalidating the bullish scenario.

BTC update $another dip before the rally
Entering Buy from zone 111200 - 110900 keeping target as 113500$
3rd wave completed
4th is the dip
Buy at 5th

BTC/USDT Analysis. Continuation of the local uptrend
Hello everyone! This is CryptoRobotics trader-analyst with the daily market analysis.
Yesterday, the market followed our scenario, continuing the local uptrend and breaking the previous high. At the moment, there are no strong signs of profit-taking that could trigger a reversal, nor major resistance zones nearby. The main expectation remains further growth towards the $114,400–$115,500 (volume zone), where a reversal pattern may start to form.
For intraday traders, the key level to watch is around $112,000. An abnormally high volume cluster was recorded there, which positioned buyers earlier. If the price dips into this zone and shows a reaction, a local long setup may be considered.
Buy zones:
~$112,000 (local zone, abnormal cluster),
$110,000–$105,000 (accumulated volumes).
Sell zones:
$114,400–$115,500 (volume zone),
~$116,500 (volume anomaly),
$117,200–$119,000 (accumulated volumes),
$121,200–$122,200 (buying absorption).
This publication does not constitute financial advice.
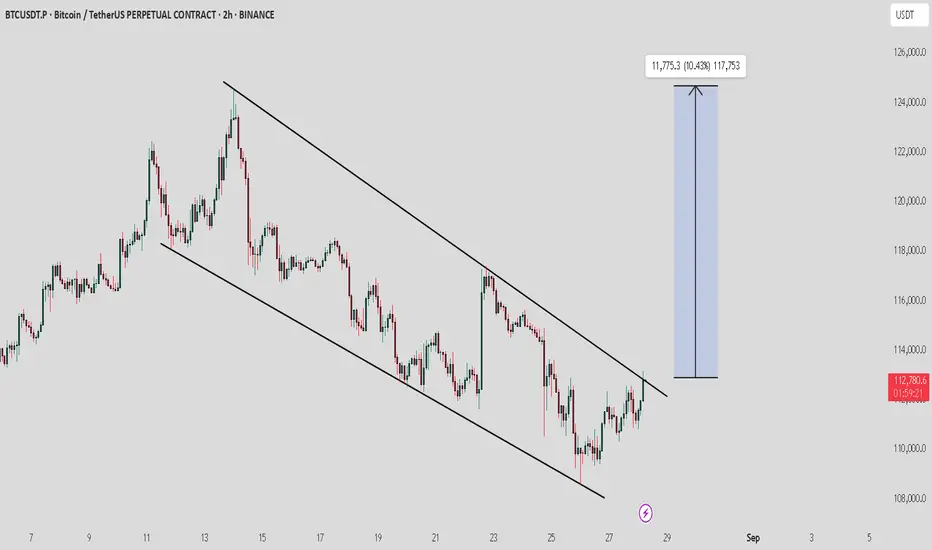
BTC / USDT : Trying to breakout from descending channelBTC/USDT is breaking out of the descending channel on the 2H timeframe. If this breakout holds, we could see a bullish rally of around +10%, targeting the $124,000 zone.
Trade Setup:
Entry: After breakout confirmation / retest hold above $113,000
Targets: $118,000 – $124,000
Stop-Loss: Below $111,000 (channel support invalidation)
As always, wait for confirmation to avoid fake breakouts and manage risk properly.
BTC Bearish Signal. 1D Double-Top Break with RetestMy last post was about how I was hoping to catch the retest of the 1D Double Top bullish wave to 112.3K, well now that position is DONE! . It has hit my target TP.
To continue, I have entered a Short at 112.1K with a Stop Loss at 113K , which is right above the short order block. I was able to enter at a good position this morning because i caught a 15m Reversal Candle with a declining volume during the push up. Not long after that, the 15m timeframe shows a Head and Shoulders Pattern with agreement with its volume. and lucky for me I entered at the head! In the hopes of having a TP at 106.9K (or even more!). This TP is based on the minimum objective of the Reverse Cup and Handle formation in 4H.
In this position, the first challenge would be breaking the Support Line at around 109.5K , which is quite significant as it was touched a handful of times.
When the price reaches 107K i will monitor the momentum to see if I should take the TP at 106.9K or extend my TP to 99.8K . Because right now there is a Double-Top minimum objective of 99.8K . I also did a Fibonacci Analysis that shows it actually might go lower than 99.8K. However, to me, it all depends on the price action then. I don't wanna be greedy and we can always set up new positions later on.
Happy Trading!

BTC/USDT Analysis. Buying Resumes
Hello everyone! This is CryptoRobotics trader-analyst with the daily market review.
Yesterday, as expected, Bitcoin buying activity resumed. The price reached the resistance area around ~$112,000 (absorption of market buys) and showed an initial reaction. The seller’s response was relatively weak, so if the local high is broken, we may see a move towards the next supply zone at $114,400–$115,500 (volume zone).
On the broader picture, demand remains weak, so a retest of the local low is still likely in the near term. For now, we remain out of positions and consider shorts from the next supply zone.
Buy Zones:
$110,000–$105,000 (accumulated volumes)
Sell Zones:
$114,400–$115,500 (volume zone)
~$116,500 (volume anomaly)
$117,200–$119,000 (accumulated volumes)
$121,200–$122,200 (absorption of buys)
This publication does not constitute financial advice.


Bearish BTC is coming; Candle confirmation at 110k is neededAfter falling below 110k, I believe BTC is going to have the ''Last Kiss'' scenario to confirm its bearish momentum. While it has come up again towards 110k, I believe it's going to confirm the bearish scenario and goes for 107k, 105k and 103k in a short period. But for a long overview, 95k is probable.

Bitcoin buy Soon as soon possibleBitcoin buy Soon as soon possible
The live Bitcoin price today is $111497.14 USD with a 24-hour trading volume of $64109128491.21 USD. We update our BTC to USD price in real-time.

BTC Professional Market Movement Analysis🏗️ How Market Moves
Liquidity Grab at Support 🟢
Price dips into the 112K zone to collect liquidity (stop-hunts + institutional buys).
Market shows wick rejections & volume absorption.
This is where smart money positions for the next leg higher.
Expansion Phase 🚀
After liquidity grab → market expands upward.
Price pushes aggressively toward the 124K resistance.
This movement is fueled by trapped sellers covering shorts + buyers entering late.
Resistance Reaction 🔴
At 124K zone, market faces supply.
Either:
Rejects and falls back toward support (range continues).
Breaks through → signals strong bullish continuation (trend shift).
📉 If Support Fails
If BTC closes below 111K, it means liquidity is not enough.
Market will seek the next major demand zone (100K) where bigger orders sit.
This creates a stop-hunt + deeper accumulation before a new push higher.
🧠 Pro Definition
Market does not move randomly — it moves from liquidity pool to liquidity pool.
BTC is currently collecting orders at 112K support.
Expect a bounce → expansion → test of 124K supply.
If 112K fails, price will seek deeper liquidity near 100K before rebounding.
⚡ In simple terms:
👉 Market first hunts liquidity at support 🟢,
👉 then expands upward toward resistance 🔴,
👉 and finally decides — either reject back into the range or break higher for continuation.

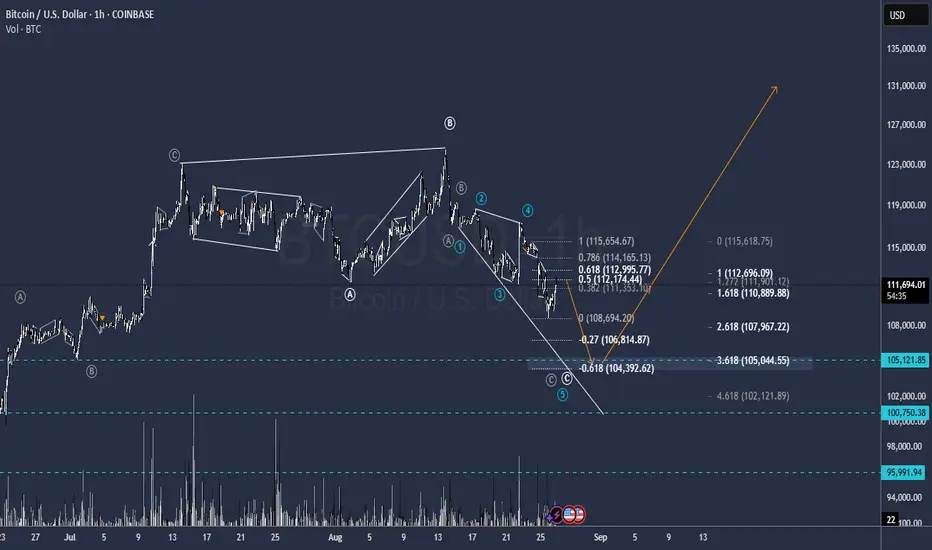
BTC Leading Diagonal for C last Corrective waveTicky one but it is about to make the last wave of the Diagonal that finish the Correction
Buy Level is 105.150 Targets unknown, starts at 127.500 / 133.000 and further
It can Go a little Lower 101.000, possible but not needed.
For now its a Sell from 112.000 to 105.150
GG
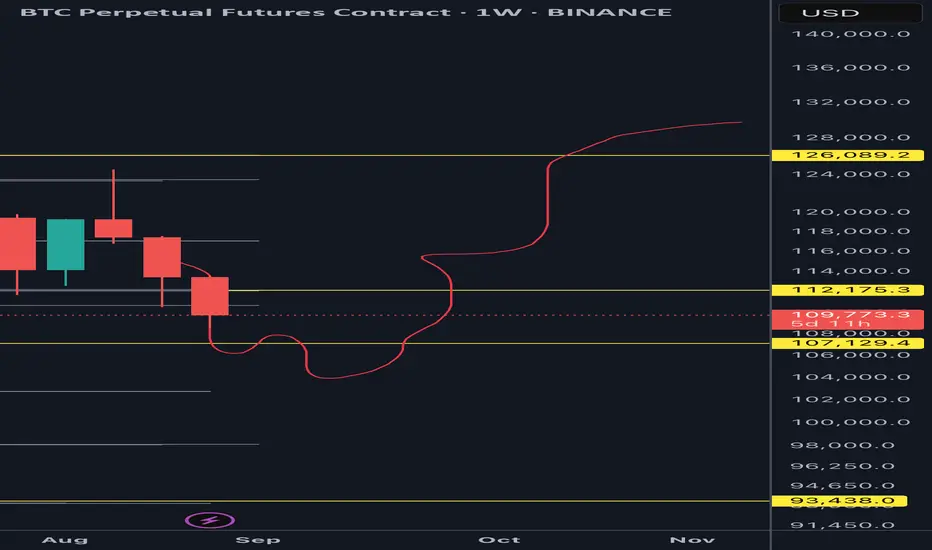
Very Possible Bitcoin Scenario BTC lost momentum and it will possibly go to July opening level sweep below and continue upwards.
This is just my opinion, I don’t see huge distribution in price to go down further than that 👍
Bitcoin - Looking To Sell Pullbacks In The Short TermH4 - Strong bearish move.
No opposite signs.
Expecting bearish continuation until the two Fibonacci resistance zones hold.
If you enjoy this idea, don’t forget to LIKE 👍, FOLLOW ✅, SHARE 🙌, and COMMENT ✍! Drop your thoughts and charts below to keep the discussion going. Your support helps keep this content free and reach more people! 🚀

BITCOINBTC is showing signs of weakness after breaking structure on the daily timeframe. I’m watching for price to retrace into the 4H FVG before continuing lower
This is just my personal view — not financial advice. What do you think? will BTC respect the FVG and drop, or push higher? 🚀📉
