Bitcoin - The classic bullrun top creation!🗿Bitcoin ( CRYPTO:BTCUSD ) created the bullrun top:
🔎Analysis summary:
A couple of weeks ago, Bitcoin retested a major decade long resistance curve. Since Bitcoin then already created bearish confirmation, we are currently seeing an expected crackdown. Considering all the underlying trends, this bearish cycle is still not over yet.
📝Levels to watch:
$70,000 and $50,000
SwingTraderPhil
SwingTrading.Simplified. | Investing.Simplified. | #LONGTERMVISION
Bitcoinprediction

Fear Creates Winners — BTC 84.8K Swing to 132K?BTC Technical Outlook (2D Chart)
I always prefer using the 2-Day timeframe (2D) when analyzing Bitcoin because it helps minimize noise, reduce false signals, and highlight the true macro trend. When you zoom out, the market becomes more honest.
Right now, Bitcoin is testing the lower boundary of its ascending channel, a level that has historically generated strong bullish reversals.
Sentiment is heavily bearish, liquidity is building under 85K, and RSI is approaching oversold — all aligning for a high-probability swing setup.
Swing Trade Plan (Macro Structure)
Entry Zone: Around 84,800 USD
Take Profit: 132,000 USD
Stop Loss:
A confirmed 2-Day CLOSE below 74,400 USD
The idea is simple:
The structure remains bullish as long as BTC stays above the lower channel line. A 2-day close below 74,400 would mean the channel is broken — and the setup is invalidated.
"When everyone becomes bearish, be the fool who buys —
because the fool who buys support becomes the genius at the target."
Entry around 84,800, TP 132K, SL only on a 2-Day close below 74,400.
Risk-to-Reward ≈ 1:4.5

BITCOIN - Time To Buy BTCUSD nowBITCOIN (BTC/USD) has recently been stuck inside a triangle channel pattern and has struggled to break out for a few weeks. However, the price has recently broken a strong resistance level (the white trend line shown on the chart) - The price is currently above the trend line which acted as a strong resistance level and is now very likely to hit the next resistance zone which is labeled as the take profit level. time to buy BTCUSD now!

Bitcoin change of character!!Markets don’t steal money by accident.
Strong narratives are built patiently over years - only to be broken at the perfect moment, shaking out believers and allowing smart money to accumulate valuable assets at extreme discounts.
What is the strongest Bitcoin narrative to date?
Bitcoin is destined to rise forever - digital gold, limited supply, future global reserve.
How is capital taken from weak hands?
Through violent sell-offs, loooong and paaainful corrective phases, and an overwhelming wave of negative sentiment that destroys conviction.
Protect your deposits and keep dry powder.
You’ll likely need it around 2032.

Analytics: market outlook and forecasts
WHAT HAPPENED?
At the beginning of last week, as expected, we tested a local maximum for bitcoin. In the sales area of $94,000-$97,500, an obvious protection was formed, and buys were absorbed. As a result, over the course of the week, we considered the decline scenario, which was realized. At the moment, a sideways range has formed between $94,600 and $87,600.
Now we’re seeing a reaction from the technical level and the buyer's zone of $87,800-$86,400 (volume zone). However, the volume has decreased significantly compared to last week. At the same time, the delta on the spot and futures remains negative.
WHAT WILL HAPPEN: OR NOT?
The nearest local sales area is located around $90,300, from where we should expect a reaction. The main expectations for the week are the formation of a wider sideways movement in the range of $94,600-$84,000 and a test of more significant support. An alternative scenario is to continue trading within the current range.
So far, there is no clear advantage in favor of the buyer. It’s worth waiting for the formation of volume anomalies or more confident buys in the delta. Until this happens, the best strategy is to trade from the technical levels inside the designated sideways.
Buy Zones
$87,800–$86,400 (volume zone)
$84,000–$82,000 (volume anomalies)
Sell Zones
~$92,400 (local sell zone)
~$90,300 (local sell zone)
$92,000–$93,000 (local volume zone)
$94,000–$97,500 (volume zone)
$101,000–$104,000 (accumulated volumes)
IMPORTANT DATES
Macroeconomic developments this week:
• Tuesday, December 16, 13:30 (UTC) — publication of the average hourly wage, changes in the number of people employed in the non-agricultural sector and the unemployment rate in the United States for November, as well as the base index and the volume of retail sales in the United States for October;
• Tuesday, December 16, 14:45 (UTC) — publication of the index of business activity in the US services and manufacturing sector for December;
• Wednesday, December 17, 7:00 a.m. (UTC) — publication of the UK Consumer Price Index for November;
• Thursday, December 18, 12:00 (UTC) — announcement of the UK interest rate decision for December, as well as the publication of the Bank of England's letter on inflation;
• Thursday, December 18, 13:30 (UTC) — publication of the US consumer price index for November, the index of US manufacturing activity from the Federal Reserve Bank of Philadelphia for December and the number of initial applications for unemployment benefits in the United States;
• Friday, December 19, 3:00 (UTC) — announcement of Japan's interest rate decision;
• Friday, December 19, 13:30 (UTC) — publication of the basic price index of US personal consumption expenditures for October;
• Friday, December 19, 15:00 (UTC) — publication of data on sales in the US secondary housing market for November.
*This post is not financial recommendation. Make decisions based on your own experience.
#analytics

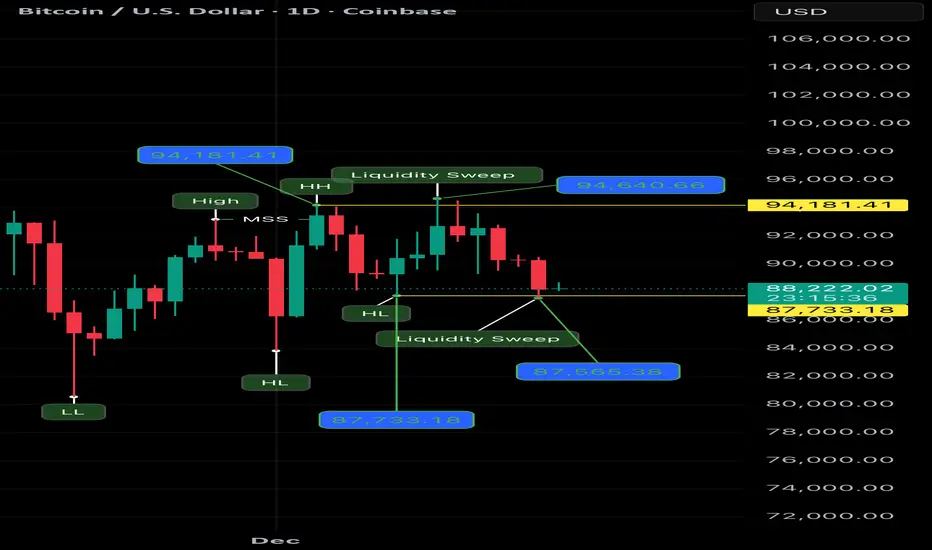
Daily Timeframe | Structure & Liquidity BehaviorCOINBASE:BTCUSD
This daily Bitcoin chart shows a clear sequence of price behavior driven by liquidity interaction, not randomness.
Let’s go step by step.
⸻
1️⃣ Market Structure Shift (MSS)
Price breaks above a previous daily high, creating a temporary bullish shift in structure.
This move changes short-term bias and pulls attention to higher prices, but structure alone does not confirm continuation.
⸻
2️⃣ Higher High Formation
After the shift, price extends higher and prints a Higher High around 94,181 – 94,640.
This area becomes a natural reaction zone, where:
• Stops accumulate
• Breakout activity increases
• Participation expands
Price now has clear overhead liquidity.
⸻
3️⃣ Liquidity Sweep Above Highs
Price pushes above the highs with long upper wicks, taking liquidity, but fails to hold above the level.
Key observations:
• No sustained closes above highs
• Immediate rejection
• Weak follow-through
This indicates exhaustion, not strength.
⸻
4️⃣ Loss of Upward Momentum
Following the sweep, price struggles to progress higher and begins to rotate lower.
This signals that the move up completed its objective and that the market is no longer accepting higher prices.
⸻
5️⃣ Downside Rotation Toward Higher Lows
As price moves down, attention shifts to the daily Higher Lows (HLs) that supported the prior structure.
These lows represent protected liquidity beneath the market.
⸻
6️⃣ First Sell-Side Liquidity Sweep (≈ 87,733)
Price drops sharply and sweeps a daily Higher Low, triggering stops and accelerating movement.
This move is clean and direct, showing clear intent.
⸻
7️⃣ Second Sell-Side Liquidity Sweep (≈ 87,565)
A deeper wick follows, confirming:
• Downside liquidity was actively targeted
• The move was deliberate and measured
Multiple sweeps reinforce the idea of liquidity completion, not panic.
⸻
8️⃣ Current Price State
At the current level (~88,340):
• Liquidity has been taken on both sides
• Price is transitioning into a balance / evaluation phase
From here, the next move will depend on:
• Acceptance above the swept lows
• Or continuation below with new structure development
⸻
Final Takeaway
This chart demonstrates a pure cause-and-effect sequence:
✔️ Structure shift
✔️ Highs taken
✔️ Rejection
✔️ Lows taken
✔️ Reset
No assumptions.
No narratives.
Just price responding to liquidity.
Not a financial advice.
Ai Generated.
BTCUSD – Range-Bound Distribution | Liquidity-Driven Enviro🔍 Market Structure:-
HTF Range High / Sell-Side Resting Above:
94,500 – 95,200
HTF Range Low / Buy-Side Resting Below:
84,500 – 85,000
Mid-Range (Equilibrium):
~89,500 – 90,000 (current price area)
Price is currently hovering around equilibrium, which is typically low-probability for directional bias.
⚠️ Risk Disclaimer (TradingView-Friendly)
This analysis is for educational purposes only and does not constitute financial advice.
Market behavior is probabilistic and subject to change at any time.
Always apply proper risk management and use your own confirmation before executing trades.

BTCUSD on 4H PerpectiveMarket Structure
Bitcoin is currently maintaining a bullish market structure on the 4H timeframe, characterized by consistent higher lows and higher highs since the rebound from the 82K–84K region.
The ascending channel remains valid, indicating a healthy uptrend rather than an impulsive spike.
Key Price Levels
Resistance Zone
98,900 – 100,000
-
Major psychological level
Previous strong resistance now being tested
Short-term consolidation around this zone is technically normal
Support Zones
92,000 – 93,000 → Primary structural support
88,500 – 89,000 → Lower channel support (secondary)
84,000 – 85,000 → Trend invalidation zone
As long as price holds above 92K, the bullish structure remains intact.
Momentum Analysis
Stochastic RSI has rebounded from lower levels and is not yet in extreme overbought territory.
This suggests bullish momentum still has room to expand, even if a minor pullback occurs.
Momentum behavior aligns with a continuation trend rather than exhaustion.
Volume Observation
Volume remains controlled with no significant spike.
This indicates no strong distribution and suggests that smart money is still holding positions rather than exiting aggressively.
Market Context
Price action reflects a controlled accumulation and expansion phase, not emotional FOMO-driven movement.
This type of structure often precedes continuation rather than reversal.
Scenarios
- Bullish Continuation (Primary Scenario)
Price consolidates above or slightly below 100K
Clean breakout opens targets at: 103K, 106K,
110K (psychological extension)
Preferred approach: wait for pullbacks instead of chasing breakouts.
- Healthy Pullback Scenario
Rejection near 100K
Retracement toward 95K – 93K
Followed by bullish continuation
This would be considered a normal corrective move, not a trend reversal.
- Invalidation Scenario
A 4H close below 88K would weaken the current bullish structure and require reassessment.
Conclusion
BTCUSD remains structurally bullish on the 4H timeframe.
Momentum, structure, and volume all support the case for continuation, with pullbacks viewed as opportunities rather than threats.
Disclaimer
This analysis is for educational and informational purposes only and does not constitute financial advice.
Always manage risk properly and make independent trading decisions based on your own research and risk tolerance.

Expected reversal of BTC from here to fill fvgExpected reversal of BTC from here to fill fvg, after this level again bearish.. keep an eye on the level
This is only for educational purposes

BTC/USD Liquidity Blueprint – Are You Reading the Flow Right?🎯 BTC/USD: The Great Heist Setup | Swing Trade Blueprint 💰
📊 Market Overview
Asset: BTC/USD (BITCOIN/US DOLLAR)
Market: Cryptocurrency
Trade Type: Swing Trade
Strategy Style: The Thief Method™ (Layered Entry System)
🎨 Technical Setup
📈 Market Structure: BULLISH CONFIRMED
The Simple Moving Average is showing strong accumulation patterns with a healthy pullback structure. Bulls are loading up their bags like thieves preparing for the ultimate vault heist! 🏃♂️💨
Key Technical Indicators:
✅ SMA showing strong bullish accumulation
✅ Pullback phase completed
✅ Higher lows formation intact
✅ Volume supporting upside momentum
🎯 The Heist Plan: Entry Strategy
💎 The Thief Layered Entry System
Instead of going all-in at one price (that's how amateurs get caught! 👮), we're using a professional layered approach with multiple buy limit orders:
Entry Layers:
🔹 Layer 1: $108,000
🔹 Layer 2: $109,000
🔹 Layer 3: $110,000
🔹 Layer 4: $111,000
🔹 Layer 5: $112,000
💡 Pro Tip: You can add more layers or adjust based on your bag size and risk appetite. The beauty of this strategy? You average into position like a pro! 🎭
🛡️ Risk Management
⛔ Stop Loss: $106,000
⚠️ Important Note: Dear Thief OG's (Ladies & Gentlemen),
This is MY stop loss based on MY risk tolerance. You're the captain of your own ship! 🚢 Set your SL according to YOUR risk management rules. Remember: Take profits at your own risk, protect capital like it's your treasure!
🎯 Target Zone: The Great Escape
🚨 Target: $124,000
Why this target?
The "Police Barricade" (strong resistance zone) sits right here with multiple confluence factors:
🔴 Major resistance level
🔴 Overbought conditions expected
🔴 Bull trap zone activated
🔴 Historical rejection area
🏃♂️ Exit Strategy: When we hit this zone, it's time to take your loot and run! Don't get greedy and caught in the trap!
⚠️ Important Note: Dear Thief OG's (Ladies & Gentlemen),
This is MY take profit target. You're free to take profits whenever YOU feel comfortable. Your money, your rules, your timeline! 💰
🔗 Correlated Pairs to Watch
Keep your eyes on these related assets for confirmation:
💱 Major Correlations:
BITSTAMP:ETHUSD - Typically follows BTC momentum; watch for similar accumulation
BINANCE:BTCUSDT - Alternative pairing for liquidity confirmation
TVC:DXY (US Dollar Index) - Inverse correlation; weakness in DXY = strength in BTC
$SPX/SPY (S&P 500) - Risk-on sentiment indicator
GOLD ( OANDA:XAUUSD ) - Alternative store of value; competitive correlation
📍 Key Correlation Points:
When DXY weakens, crypto typically strengthens
Traditional market risk-on flows support Bitcoin upside
ETH/BTC ratio helps confirm alt-season vs BTC dominance
Gold movements indicate macro hedging flows
⚙️ Why The Thief Strategy Works
✨ Dollar-Cost Averaging (DCA) on steroids
✨ Reduces emotional decision-making
✨ Better average entry price
✨ Lower risk per order
✨ Professional money management
Think like a thief planning the perfect heist: multiple entry points, calculated risks, clear escape route! 🎭
🎬 Final Thoughts
This isn't financial advice—it's a strategic blueprint for those who trade with discipline and style! The market is our playground, but only the smart thieves get to keep their loot. 🏆
Remember:
📊 Stick to your plan
🎯 Manage your risk
💰 Take profits systematically
🧠 Trade with logic, not emotion
🎭 Execute like a professional
📣 Support This Analysis
✨ If you find value in my analysis, a 👍 and 🚀 boost is much appreciated — it helps me share more setups with the community!
#Bitcoin #BTCUSD #CryptoTrading #SwingTrade #TradingStrategy #TechnicalAnalysis #CryptoAnalysis #BTC #LayeredEntry #RiskManagement #ThiefStrategy #CryptoSignals #BitcoinAnalysis #PriceAction #TradingSetup #CryptoTA #BTCSetup #SwingTrading
🎯 Stay sharp, trade smart, and may the profits be with you! 🚀

145,000 to 30,000 the Great Resetit explain itself be ready for the next buying opportinity between Juni-Sep.2026 for every know trading market.
April.2026 is a dengerous Zone and the best selling opportinity for all Markets and all Coins

Breaking: Bitcoin Might Dip to $70k Support Point The price of Bitcoin is poised to dip to the $70k support to shake off weak hands before picking liquidity up albeit the market is generally bearish.
The $70k support is feasible or nearest support zone for bitcoin to consolidate before going back up. In similar context, as per data from crypto quant the open interest of Bitcoin on all exchanges is down 0.45% losing roughly $29 billion.
This data further solidifies our bearish thesis on $BTC.

My idea on how Bitcoin can move the coming months!I will let the chart tell the story!
If we break the rising wedge top line we are set to visit the "bubble could fill zone"
Fingers crossed we break up instead of down, because that looks terrible if we do!

BTC - MY PERSONNAL SETUP FOR THE COMING HOURSYou know what, guys? I'm taking a long position here on #BTC 📈
I believe this scenario could play out well as long as #BITCOIN price hasn't broken under the LL (88,000) and lower support at 84,000. And it still holding above the weekly Uptrend.
Despite the fact I'm bearish for the medium term, I believe that whales and market makers will trigger higher liquidation heatmaps 🚨 & revisit the 98,000− 100,000 previous key support.
After that, if the setup plays out well, bearish continuation will likely occur, depending on the bearish rejection 📉🔴
Taking my chance here. I'll cut if we break under $ 87,500. ⚠️
Personal setup only. Not financial advice.
Share if you believe in it. 🎇

This Bitcoin Pattern Usually Ends One Way₿ BTC/USD – Bearish Continuation After Breakdown
Bitcoin remains in a clear downtrend, trading inside a well-defined descending channel. The market structure continues to print lower highs and lower lows, confirming that sellers are still in control.
⸻
🔹 Descending Channel
• Price has been respecting the upper and lower bounds of the channel very cleanly.
• Multiple rejections from the channel top confirm strong overhead resistance.
• As long as BTC stays inside this channel, the trend bias remains bearish.
⸻
🔹 Triangle Consolidation
• BTC is now forming a triangle inside the downtrend, indicating consolidation, not reversal.
• This type of triangle is typically a bearish continuation pattern.
• A breakdown below the triangle support would likely trigger the next impulsive leg down.
⸻
🔹 Moving Averages
• Price is trading below the 50, 100, and 200 SMAs, reinforcing bearish pressure.
• The 200 SMA (~108.6K) remains far above price and acts as major resistance.
• Any bounce into these averages is likely to be sold into.
⸻
🔹 RSI Confirmation
• RSI is below 50, showing weak momentum and lack of bullish strength.
• No bullish divergence is present, supporting the continuation downside scenario.
⸻
🔹 Key Levels
• Resistance: 96K → 105K → 108K
• Support: 88K → 84K → 80K → low-70Ks (channel extension)
A confirmed breakdown could open the door toward the mid- to low-70K area.
⸻
🔹 Conclusion
This looks like bearish consolidation before continuation, not accumulation.
Until BTC breaks above the channel and key moving averages, the path of least resistance remains down.
⸻
🧠 “In a downtrend, consolidation is usually a pause — not a bottom.”
📜 Disclaimer : This is general information only and not financial advice.

BTC/USDT Analysis. Bearish Bias Remains in Play
Hello everyone! CryptoRobotics trader-analyst here, and this is the daily market analysis.
Due to a technical issue on TradingView, yesterday’s update could not be published. However, Bitcoin has already begun to play out the short setup we outlined earlier.
As a reminder: on Wednesday at 22:00 (GMT+3), the U.S. Federal Reserve announced a rate cut, which triggered a sharp short squeeze toward ~$93,500 — the level where previously the largest absorbed buying volume was concentrated. Buyers failed to break the high, and Bitcoin dropped 5% overnight. This is exactly the scenario we described in advance.
During yesterday’s decline, the price reacted to a technical level where selling pressure weakened and buyers showed initial signs of activity.
We are now trading inside the local volume zone at $92,000–$93,000.
Despite these local reactions, the broader bias remains bearish. We expect a move toward the nearest support.
The bearish scenario would be invalidated only by a strong breakout above the $94,000–$97,500 sell zone.
Buy Zones
• $87,800–$86,400 (volume zone)
• $84,000–$82,000 (volume anomalies)
Sell Zones
• $92,000–$93,000 (local volume zone)
• $94,000–$97,500 (volume zone)
• $101,000–$104,000 (accumulated volume)
• $105,800–$106,600 (local resistance)
This publication is not financial advice.

BITCOIN - Buy BTCUSD nowBITCOIN (BTC/USD) has recently been stuck inside a triangle channel pattern and has struggled to break out for a few weeks. However, the price has recently broken a strong resistance level (the white trend line shown on the chart) - The price is currently above the trend line which acted as a strong resistance level and is now very likely to hit the next resistance zone which is labeled as the take profit level. buy BTCUSD now!

GET READY FOR BITCOIN HIGH PROBABILITY LONG SETUP SOON!!!🚨BTC HIGH PROBABILITY BUY SETUP 🚨
* Here We Can See Clearly The Next Potential Moves For BTCUSD Coming Hours/Days.
* Keep Your Eyes Close On Your Trading Positions.
* Happy PIP Hunting Traders.
FXKILLA.

Bitcoin at Critical Resistance — Bull Trap!?Over the past couple of hours, Bitcoin ( BINANCE:BTCUSDT ) has surprised many traders—including myself—with its sharp movements. The potential reason behind this could be an anticipated interest rate cut tomorrow. However, the recent JOLTS Job Openings did not fully align with that expectation.
With our technical analysis tools, we can delve deeper into Bitcoin’s next moves. The key question is whether Bitcoin will maintain its recent bullish momentum or if a reversal is imminent.
It’s important to note that in the next 24 to 48 hours, we may see increased volatility in the financial markets, particularly in crypto. Therefore, it’s wise to practice good risk management—or even consider staying on the sidelines until the market settles.
At the moment, Bitcoin has managed to break through resistance lines, but the volume of this breakout hasn’t been particularly high. Bitcoin is also near a resistance zone($94,850-$93,000), monthly pivot points, and significant levels of Cumulative Short Liquidation Leverage($98,260-$94,600), all of which add to the complexity.
High sell orders: $96,000-$94,800
From a classical technical standpoint, there’s potential for a bearish flag pattern forming. As long as Bitcoin remains below $100,000, this scenario remains plausible.
From an Elliott Wave perspective, it seems that the main Wave B has completed, and we’re likely looking at a ZigZag correction(ABC/5-3-5). This correction might complete either at the resistance zone($94,850-$93,000) or near the daily 50_SMA(Daily).
Considering that the S&P 500 index ( SP:SPX ) is also showing a bearish trend, it’s more likely that Bitcoin’s main corrective Wave C will complete within these resistance levels.
Also, the USDT.D% ( CRYPTOCAP:USDT.D ) remains a crucial factor. Until it hits around 5.49%, the overall crypto market is likely to remain bearish.
In conclusion, I expect that Bitcoin will continue its downward movement, potentially testing $89,000 and even dropping below $85,000. This could represent a significant bearish phase for Bitcoin.
What are your thoughts? Do you think Bitcoin will maintain this bullish momentum, or are we headed for more downside?
Cumulative Long Liquidation Leverage: $89,430-$88,750
Cumulative Long Liquidation Leverage: $83,900-$82,400
First Target: $90,300
Second Target: $87,503
Stop Loss(SL): $100,020(Worst)
Points may shift as the market evolves
💡 Please respect each other's opinions and express agreement or disagreement politely.
📌Bitcoin Analysis (BTCUSDT), 4-hour time frame.
🛑 Always set a Stop Loss(SL) for every position you open.
✅ This is just my idea; I’d love to see your thoughts too!
🔥 If you find it helpful, please BOOST this post and share it with your friends.

BTC (Daily)- Bear Flag pattern is forming.
- Take note of the support zone below if price breaks down from the Flag.

BITCOIN SIGNAL: FOMC MEETING WILL PUSH BTC TO HERE!!!? (warning)Yello Paradisers! Enjoy the video!
We are discussing a lot of technical stuff—Elliott Wave theory. We are going through multiple time frames, and I'm updating you about the price action, development structure, and important levels, as well as what the highest probability next move is.
And Paradisers! Keep in mind to trade only with a proper professional trading strategy. Wait for confirmations. Play with tactics. This is the only way you can be long-term profitable.
Remember, don’t trade without confirmations. Wait for them before creating a trade. Be disciplined, patient, and emotionally controlled. Only trade the highest probability setups with the greatest risk to reward ratio. This will ensure that you become a long-term profitable professional trader.
Don't be a gambler. Don't try to get rich quick. Make sure that your trading is professionally based on proper strategies and trade tactics.

Bitcoin at a Crossroads!Downtrend overall
The general trajectory has been lower — lower highs and lower lows over the past several weeks.
🔹 Possible consolidation / base forming
Price has leveled out a bit instead of accelerating down; that can sometimes mean sellers are losing momentum and the market is consolidating.
🔹 Uncertain direction short-term
Because it’s range-bound right now, there isn’t a clear breakout direction yet. Bulls vs bears are in a tug-of-war around this level.
Key Levels to Watch
📌 Support zone: ~~$84,000–$87,000
📌 Resistance zone: ~~$92,000–$96,000
Break above or below those could signal the next big move.

GBTC is hinting a major bottom soon on BTC!AMEX:GBTC
– Elliott Wave Update (1H Chart)
The decline from the Wave B high continues to follow a clean 5-wave impulse. Current price action suggests we are inside Wave (iv) before the final flush.
🧩 Structure so far:
🔻 Wave (i)
• Initial sharp drop
• Set the tone for the entire downtrend
🔻 Wave (ii)
• Reactive bounce into the mid-channel
• Perfect retracement behaviour for an impulse
🔻 Wave (iii)
• Long, persistent decline
• Strongest momentum segment
• Clean subdivisions visible on lower timeframes
🔵 Wave (iv) now forming:
• Grinding upward inside the corrective channel
• Should remain below upper channel resistance
• Likely forming a flat / zigzag corrective before rollover
🔻 Wave (v) expected next:
• Final leg down to complete C
• Target = lower channel + 60–62 region
• Completion of the larger corrective cycle
🟢 After Wave C completes:
• Expect a medium-term trend reversal
• First target = reclaiming broken channel lines
• Bigger target = recovery toward prior structure above 90+
📌 Summary:
Wave (iv) = corrective bounce.
Wave (v) = final drop → then macro reversal likely. ⚡
I am overall bullish on CRYPTOCAP:BTC after this drop. Please check my
BTC update here.
