Will Bitcoin Able to Breakdown Below $111,950?On the daily timeframe, Bitcoin CRYPTOCAP:BTC is showing signs of potentially forming a Double Top reversal pattern , indicating a possible trend shift from bullish to bearish. Should the price break below $111,950, Bitcoin could decline toward the $104,320 range, which also coincides with a fair value gap area.
Although the liquidation map from Coinglass highlights liquidation clusters between $110,841 and $111,905, traders and investors are advised to remain cautious in anticipating Bitcoin’s volatile price movements.
Bitcoinprediction

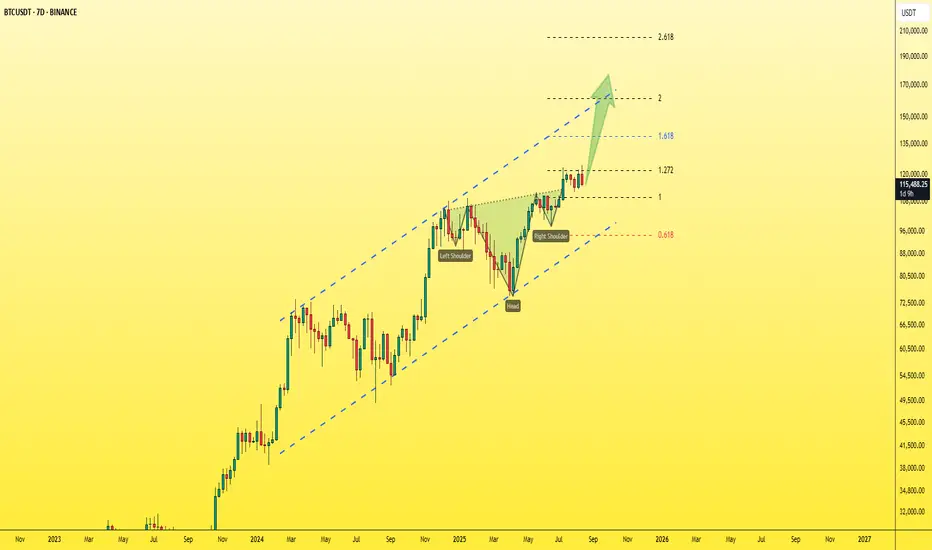
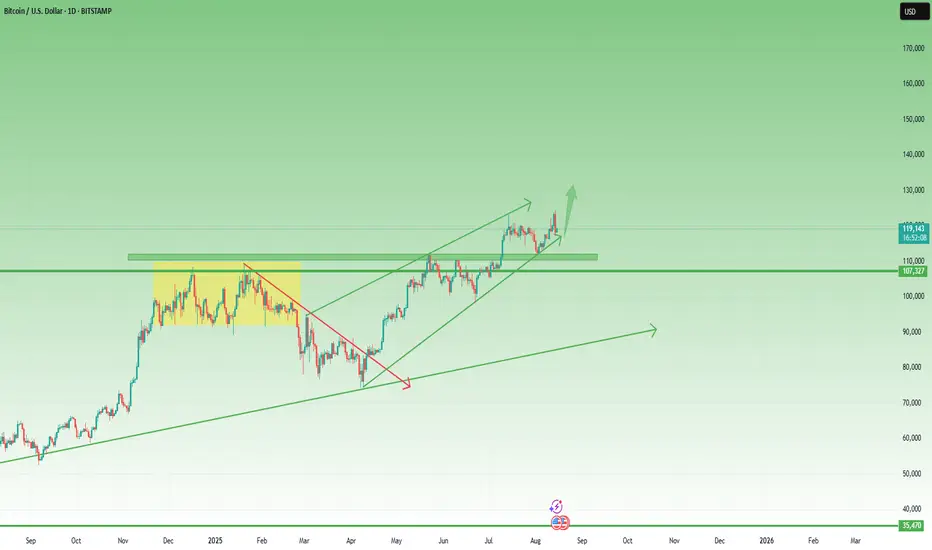
Bitcoin - Clean chart that outlines the next leg up seamlessly!The Bitcoin chart is crystal clear, simple, and very bullish.
We’ve talked about it over and over, and we’ve always said that 120K is a confirmed target — and now that it’s been hit, I’m telling you the next stop is 150K.
We’ve got a reverse Head & Shoulders pattern, the neckline has been broken, and price is now retesting it.
BTC also broke its previous ATH at 109,500 and is on its way to retest it right now.
All of this on the weekly chart are strong bullish signals that will at least push price to the upper side of the Ascending Channel that we’ve been tracking. Plus, the projection target of the reversal H&S perfectly aligns with this outlook — no coincidence here.
👉 150K is the next station. 🚀
Best regards:
Ceciliones🎯
Bitcoin on the Edge! Will $114K Hold or Break?Bitcoin ( BINANCE:BTCUSDT ) started to decline from the Potential Reversal Zone(PRZ) as I expected in the previous idea .
Bitcoin currently appears to have managed to break the Support zone($116,900-$115,730) and is currently trading near the Support zone($114,720-$113,570) , 50_EMA(Daily) , Monthly Pivot Point , and Cumulative Long Liquidation Leverage($114,300-$113,841) .
In terms of Elliott Wave theory , it appears that Bitcoin is completing microwave 4 of the main wave 3 (probably), and we should expect a re-attack on the Support zone($114,720-$113,570) in the coming hours .
I expect Bitcoin to attack the Support zone($114,720-$113,570) at least once more after completing the pullback to the Support zone($116,900-$115,730) from Cumulative Short Liquidation Leverage($116,411-$115,760) and if it breaks , we should expect a drop to the Heavy Support zone($111,980-$105,820) .
Cumulative Short Liquidation Leverage: $120,115-$118,751
Note: Stop Loss(SL): $117,320
Please respect each other's ideas and express them politely if you agree or disagree.
Bitcoin Analyze (BTCUSDT), 1-hour time frame.
Be sure to follow the updated ideas.
Do not forget to put a Stop loss for your positions (For every position you want to open).
Please follow your strategy and updates; this is just my Idea, and I will gladly see your ideas in this post.
Please do not forget the ✅' like '✅ button 🙏😊 & Share it with your friends; thanks, and Trade safe.

BTC/USDT Analysis. Absorption of Selling Pressure
Hello everyone! This is CryptoRobotics trader-analyst with your daily market update.
As expected, yesterday Bitcoin showed an initial reaction from buyers with a local rebound. After that, the price once again tested the ~$115,000 level, where the strongest absorption of selling had previously taken place. Despite renewed activity from limit buyers, we still do not see consistent market buying.
Only if the price consolidates above $116,000 can we expect an upward extension toward the next selling zone at $117,200–$119,000 (accumulated volumes). However, even in this case, opening long positions would be impractical due to the limited potential and elevated risks. For now, it is more reasonable to wait for a confirmed reversal or a stronger presence of market buyers.
Buy Zones:
$115,300–$114,000 (accumulated volumes)
$110,000–$105,000 (accumulated volumes)
Sell Zones:
$117,200–$119,000 (accumulated volumes)
$121,200–$122,200 (buying absorption)
This publication is not financial advice.

Bitcoin ManiaAt these price levels we sit at and the fundamentals, I have to be bullish overall. Although, I have an issue with wanting to call a top/be a contrarian. I see the possibility of a bitcoin top at the 120k and have a tighter band of 115 to 118k to guide me in the short term and at a larger level the 120k to 110k.
Ironically in my view it would be contrarian to be in a long right now, but could be the best trade of the day being at the lower 115k support and possibility of a strong reversal up to 120k.
At the moment, I am out of my "riskier" ETH and ADA longs to see what the market does at this price level. Ready to jump back in for some fun if we can setup with a nice structure.
not financial advice

BTCUSDT SHORT SETUPBitcoin H4 TF Trade Mapping Update
Selling Now On Fair Value Gap Price 115.400
Next Zone Selling CISD PRICE 117.00
Next Selling BTC Zone Order Block 118.00 / 119,300
Manage Trades Properly And Follow For More Charts And Trades

Bitcoin 15-Minute Trade SetupAfter a sharp sell-off from the high of 124,571.2, Bitcoin has been consistently forming a series of lower lows and lower highs, indicating sustained bearish pressure.
Recently, we observed a break of structure (BoS) at 116,72, followed by a corrective pullback on the 15-minute timeframe. This pullback presents a short-term trading opportunity.
Entry: 115,310.9
Stop Loss (SL): 115,000
Target (1:4 RR): 116,551
Interestingly, the 116,551 level also aligns with a potential rejection zone on the 4-hour point of interest (POI), which could reinforce this setup.
Trade Idea:
Looking to take advantage of the pullback for a risk-defined entry with a favorable risk-to-reward ratio. Monitoring how price reacts around the 4H POI will be key in managing this trade.

BTC 1DBitcoin is at the bottom of the range at the $115,500 , keep an eye on the $113,800 and $12,000 zones.

BTC Crashing To 110kAfter taking out ATH last week, BTC broke structure to the downside on the 8h with a quick retest of the FVG. Price is now trending towards the next major support level at 111,930. If price breaks this level, we could see a retest and accumulation of new buy orders at 110k level.
Do you see price breaking below 110k?
#btc #short #analysis #smartmoney

Analytics: market outlook and forecasts📈 WHAT HAPPENED?
After a positive start to the week and the ATH update on Thursday, bitcoin went into a rapid correction. This happened against the background of negative macroeconomic data from the United States, which increased pressure on the market.
In the daily analysis we noted weak protection from buyers and recommended to refrain from opening long positions.
After testing local resistance around $118,480, the decline continued, and the price reached the next support zone — $115,300–$114,000 (accumulated volumes).
💼 WHAT WILL HAPPEN: OR NOT?
Currently, there's a limit absorption of market sales inside the resistance zone. When a market buyer becomes active, an initial rebound is possible.
However, there are no reversal formations for buys in the medium-term structure: even with a strong buy-back, we should expect a second wave of sales from the $117,200-$119,000 zone (accumulated volumes). It's worth going long only with obvious signs of sellers' weakness — as long as the structure remains favorable for shorts.
If the market buyer doesn't show itself in the current zone, the next reduction target will be the $112,000 level.
Buy Zones:
• $115,300–$114,000 (accumulated volumes)
• $110,000–$105,000 (accumulated volumes)
Sell Zones:
• $117,200–$119,000 (accumulated volumes)
• $121,200–$122,200 (buy absorption)
IMPORTANT DATES
We're following these macroeconomic developments this week:
• Wednesday, August 20, 2:00 (UTC) — announcement of the New Zealand interest rate decision for August;
• Wednesday, August 20, 6:00 (UTC) — publication of the UK Consumer Price Index (CPI) for July;
• Wednesday, August 20, 9:00 (UTC) — publication of the Eurozone Consumer Price Index (CPI) for July;
• Wednesday, August 20, 18:00 (UTC) — publication of FOMC minutes;
• Thursday, August 21, 12:30 (UTC) — publication of the number of initial applications for unemployment benefits in the United States for August and the index of US manufacturing activity for August from the Federal Reserve Bank of Philadelphia;
• Thursday, August 21, 13:45 (UTC) — publication of business activity indices (PMI) in the manufacturing and services sectors of the United States for August;
• Thursday, August 21, 14:00 (UTC) — publication of data on sales in the US secondary housing market for July;
• Friday, August 22, 6:00 (UTC) — publication of German GDP for the second quarter of 2025;
Friday, August 22, 14:00 (UTC) — speech by Federal Reserve Chairman Jerome Powell.
*This post is not financial recommendation. Make decisions based on your own experience.
#analytics

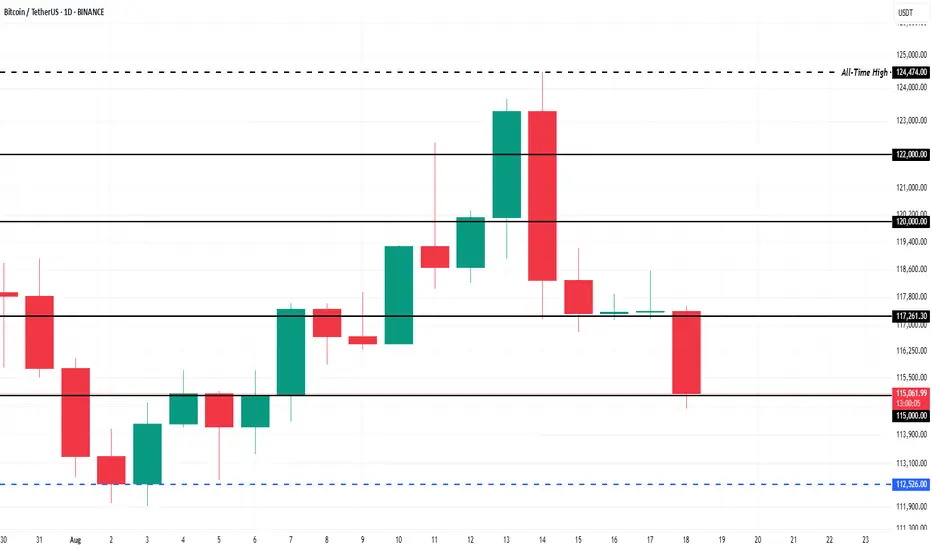
Bitcoin Price Forecast: Indicators Suggest $127,000 TargetAt the time of writing, BINANCE:BTCUSDT trades at $115,061, holding firmly above the $115,000 support. The models suggest that selling by STHs will remain limited until BTC approaches $127,000, which sits above the previous all-time high of $124,474 and marks the next major profit-taking level.
For BINANCE:BTCUSDT to reach this target, broader market support will be necessary. Geopolitical tensions remain a drag on sentiment, but renewed investor confidence could aid momentum. Reclaiming $117,261 as support and pushing to $120,000 would set the stage for a potential new all-time high in the near term.
If conditions worsen, BINANCE:BTCUSDT risks losing $115,000 support, with a possible decline to $112,526 or lower. Such a move would invalidate the bullish thesis and highlight the vulnerability of BTC to external pressures, reinforcing caution among traders while the market reassesses its trajectory.
BTC Deep Pullback Could Offer Strategic Long Opportunity Bitcoin📊 Bitcoin remains in a strong bullish trend on the higher timeframes 📈, which is clear on the weekly chart. However, we’ve recently seen an aggressive BTC selloff on both the daily and 4H charts 🔻. Price is now moving into key support zones, trading through a prior accumulation range visible on both the daily and 4H 🏦. This zone represents a significant liquidity pool, where Bitcoin may potentially find support. I’ll be watching closely for a bullish break of market structure on the 1H ⏰ — that would be my trigger for a potential long setup 🚀. This could present an opportunity to capitalize on a deep pullback within a bullish trend 💡 (not financial advice).

Bitcoin & STRONG SUPPORTBitcoin has reached a strong support area:
1. 78% Fibonacci level
2. August's pivot
3. Former resistance line (yellow)
4. Bullish divergence on 4H RSI
I expect a strong bounce to around 120k.

BTC Back to 100.000You know the way market is beahaving the expanding Flat scenario looks more and more uncertain, zooming out and looking at the bigger picture I can count the rally up as 3 waves wich means it is part of the correction and not a new impulse, so 100.000 should be hitted once more time before a further up move

BITCOIN Rebound Ahead!
HI,Traders !
#BITCOIN made a retest
Of the wide horizontal support
Level again at 117102.1 and we
Are already seeing a bullish
Reaction so a local bullish
Rebound can be expected !
Comment and subscribe to help us grow !

BTCUSDT H1 MARKET UPDATE A Clear Setup Bearish Signal
Bitcoin Sell From Bearish FVG Box
Bitcoin Sell From Bearish Order Block
Bitcoin Sell From Bearish FVG Box
Bitcoin Sell From Bearish Engulfing
Manage Your Trade Properly Follow Us For More trades

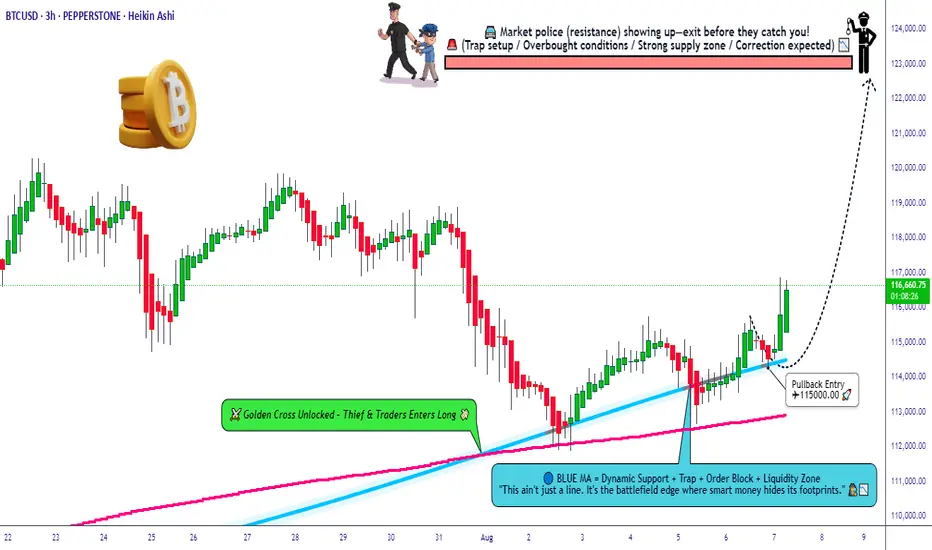
Can the Thief Rob BTC Pullback Before the Police Arrive?🚨 BTC/USD 💰 Bitcoin Breakout Heist Plan – Robbers in Action 🚀 🚨
Asset: BTC/USD “Bitcoin vs U.S. Dollar” — Crypto King Market
📊 Plan: BULLISH BREAKOUT RAID
🎯 Target: 123,000.00 🎯 — Police Barricade Resistance + Overbought Trap Zone
🔒 Entry: ANY PRICE LEVEL — Thief avg pullback entry at 115,000.00
🛑 Stop Loss: 113,000.00 — Below the Laser Tripwire
🎩 Thief Entry Blueprint 🕵️♂️
The vault’s trembling. The thief’s not waiting.
Layered limit orders are being deployed like smoke bombs — we strike anywhere, anytime, with stealthy precision. No begging for dip, we rob it raw. 💣🧨
📉 Risk Protocol Setup 🛡️
SL: Under local support – cut fast if alarms trigger.
Risk light, rob heavy. Use tight stops or trailing guards to escape with the loot.
📈 Why Rob Long?
Bullish momentum building like a pressure cooker 💥
Resistance zones turning into trapdoors for late bears 🐻
Liquidity pools above — ripe for raid
Sentiment flips, on-chain signals, and macro tailwinds align ⚡
📌 Robbery Reminders:
NO SHORTING — This is a one-way heist 🚷
Avoid news-time chaos ⛔
Use multiple entries (layer style) and escape plans.
Overbought ≠ exit — it’s the bait for the next raid 🧠
💖 LIKE = SUPPORT THE CREW
Every like boosts the Thief Trader movement — more heat, more setups, more wins.
Smash Boost. Share the Heist. Stay Robbing. 🐱👤📈🔥
🔔 Stay tuned. Next breakout blueprint dropping soon.
Bitcoin Key Holders Turn Neutral Ahead Of Volatility ExplosionBINANCE:BTCUSDT price had shown an upward trend throughout the month, but this momentum faltered in the last 24 hours, with BTC falling to $117,305 . This decline occurred as the price slipped below the established uptrend line, signaling a shift in market sentiment.
If investors maintain their positions during the expected volatility surge, BINANCE:BTCUSDT could stabilize above $117,000. This would open the door for a potential push toward $120,000, turning it into support and allowing further upside movement.
However, if investor sentiment turns bearish and selling increases in response to volatility, BINANCE:BTCUSDT could face a significant drop . In this case, the price may fall through the $115,000 support level, potentially reaching as low as $112,526 . This would wipe out the gains seen in August, invalidating the bullish outlook.
Why are Whales Moving Bitcoin to Binance? Weekly Whale WatchBINANCE:BTCUSDT price is currently trading at $116,830 after slipping below the key $120,000 level. The price fell from the recent ATH of $124,474 , showing some volatility. Despite this decline, Bitcoin is maintaining support above $119,000, suggesting that the recent dip could be a short-term correction.
In the past 24 hours, Binance has seen a massive increase in BINANCE:BTCUSDT deposits, with 6,060 BTC, worth approximately $722 million , added to the exchange’s balance. This surge primarily comes from whales
Given the mixed market sentiment, BINANCE:BTCUSDT could potentially reclaim $120,000 as a solid support level. If the bulls manage to maintain this level, Bitcoin might be able to recover from the recent dip and push towards $122,000.
However, if selling pressure intensifies, BINANCE:BTCUSDT price may fall through the $117,261 support level . A deeper drop could take the price to $115,000 or lower, which would invalidate the bullish outlook and indicate further market weakness.
BTC/USDT Analysis — Market Buyer Still Absent
Hello everyone! This is the CryptoRobotics trader-analyst with your daily market review.
Yesterday, Bitcoin finally tested the $117,500–$116,000 buy zone (accumulated volumes), triggering a weak wave of buying. Currently, trading is taking place within a new volume zone, where sellers still dominate. Inside the current sideways range, the $118,480 level acts as a local sell zone (area of aggressive selling).
At the moment, we expect a continuation of the local decline with another test of the $117,200 low. Buying positions are not advisable right now — despite being in a support zone, there’s still no sign of active buyers. This increases the likelihood of a drop to the next liquidity zone.
Buy Zones:
$117,500–$116,000 (accumulated volumes)
$115,300–$114,000 (accumulated volumes)
Sell Zones:
$118,480 (local zone, aggressive seller activity)
$121,200–$122,200 (buy absorption)
This publication is not financial advice.

Bitcoin : Stay heavy on positionsSame view as before. No change.
Bitcoin : Stay heavy on positions (2x)
For new Bitcoin entries, now is the time.
If you're using leverage, I’d wait for a scale-in signal before jumping in.
** This analysis is based solely on the quantification of crowd psychology.
It does not incorporate price action, trading volume, or macroeconomic indicators.

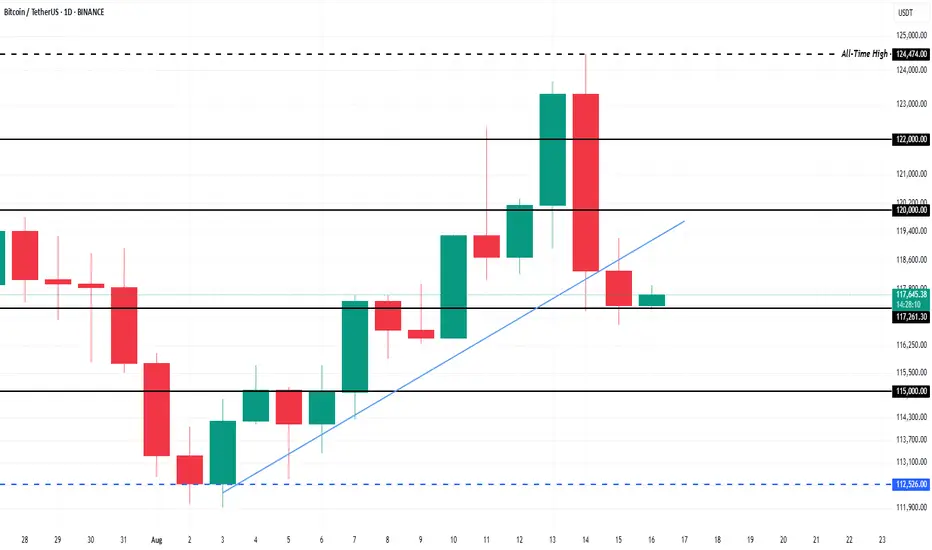
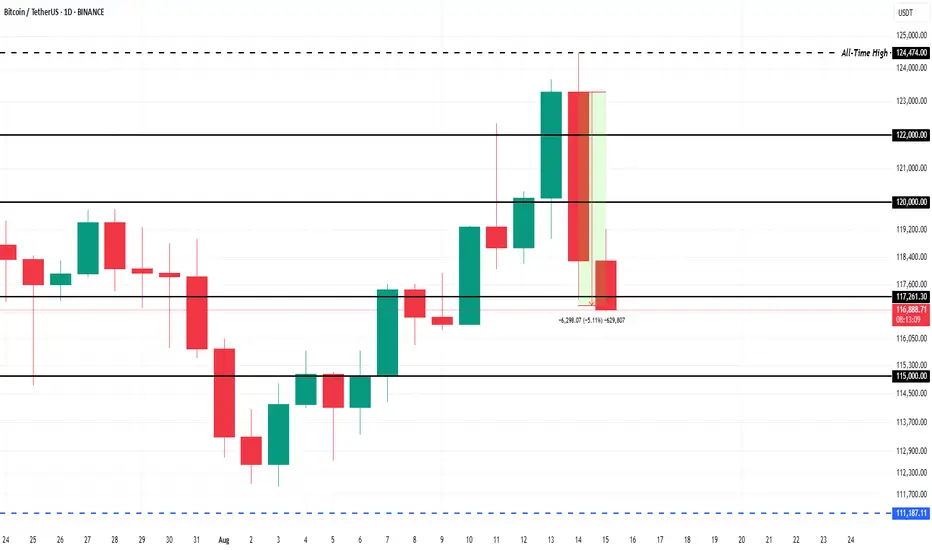
This BTC Pullback Doesn’t Break the Bullish StructureYesterday, BTC dropped around 5% from its freshly printed intraday ATH, reaching a low of 117,300. Should bulls be worried?
In my view, this drop can’t be seen as more than just a correction — while it was indeed quite deep, the overall structure remains fully intact.
Price is still comfortably above the ascending trendline that started in April, and even higher than the nearest horizontal support.
Bottom line: As long as BTC stays above the 110–112k zone, there’s no real reason for concern.
For short-term traders, this dip could even be seen as a buying opportunity — anticipating a push towards a new ATH above 125k. 🚀
Bitcoin Market Loot Plan Activated — Watch It Climb!🔥🚨 THIEF TRADER’S ULTIMATE BTC/USD HEIST PLAN! 🚨🔥
Asset: BTC/USD "Bitcoin vs U.S. Dollar" – Crypto Market Robbery in Progress!
Plan: BULLISH HEIST – LAYERED ENTRY MASTERMINDED!
🎯 THIEF’S ENTRY STRATEGY (LAYERED LIMIT ORDERS):
"The vault is unlocked! Swipe the loot at ANY PRICE! But for elite thieves, use LAYERED LIMITS like a PRO!"
Buy Limits (Example):
🔹 122,000.00 (First Dip Grab!)
🔹 120,500.00 (Second Layer – More Stealth!)
🔹 121,500.00 (Third Strike – Smooth Criminal!)
🔸 121,000.00 (Final Trap – Max Loot!)
👉 Adjust layers based on YOUR risk appetite! More layers = More escape routes!
🛑 THIEF STOP LOSS (OG STYLE):
"SL? Yeah, we have one… but REAL THIEVES adjust on the fly!"
🔪 SL @ 117,500.00 (If Bitcoin snitches, CUT & RUN!)
⚠️ Pro Tip: Tighten SL if market flips bearish! Don’t get caught!
💰 TARGET: ESCAPE BEFORE THE COPS ARRIVE! 🚔
🎯 130,000.00 (Final Heist Zone – Police Barricade!)
🏃♂️ 129,000.00 (Early Exit? Smart Thieves Take Profit & DISAPPEAR!)
⚡ THIEF TRADER’S GOLDEN RULES:
✔ SCALPERS: Only LONG side! Quick in, Quick out!
✔ SWING THIEVES: Hold & Trailing SL for MAX LOOT!
✔ RISK? Your wallet, Your rules! Don’t blame the plan!
📢 THIEF ALERT! NEWS = VOLATILITY TRAP!
🚨 Avoid new trades during high-impact news!
🚨 Lock profits with TRAILING SL!
💥 BOOST THIS HEIST PLAN! (More boosts = More stolen money!💰)
🔥 LIKE, SHARE, & FOLLOW FOR NEXT HEIST! Stay stealthy, thieves! 🏴☠️🚀
🚀 SEE YOU AT THE NEXT CRYPTO ROBBERY! 🚀
#ThiefTrader #BitcoinHeist #LayeredEntries #CryptoGang
