BTC/USDT Analysis. Local Weakness in Selling Pressure
Hello everyone! This is your CryptoRobotics trading analyst, bringing you the daily market review.
Yesterday, Bitcoin reached the $103,700–$106,700 (pushing volume) resistance zone and resumed its decline. The move both toward this area and away from it occurred mostly by inertia, with low volume and weak price action.
At the moment, BTC is testing the previously mentioned support around ~$101,000. We can now refine this level to $102,300–$100,500 . If a strong reaction appears here, we can expect a short-term long setup toward $106,000, where untested seller volumes remain.
If no reaction occurs, the decline is likely to deepen toward the next medium-term support at $97,000–$93,000 (high-volume zone).
Buy Zones:
$102,300–$100,500 (volume anomalies)
$97,000–$93,000 (high-volume zone)
Sell Zones:
$105,800–$107,400 (pushing volumes)
$109,500–$110,700 (accumulated volumes)
$112,400–$113,300 (accumulated volumes)
$114,700–$115,700 (accumulated volumes)
$120,900–$124,000 (high-volume zone)
This publication does not constitute financial advice.
Bitcoinprediction

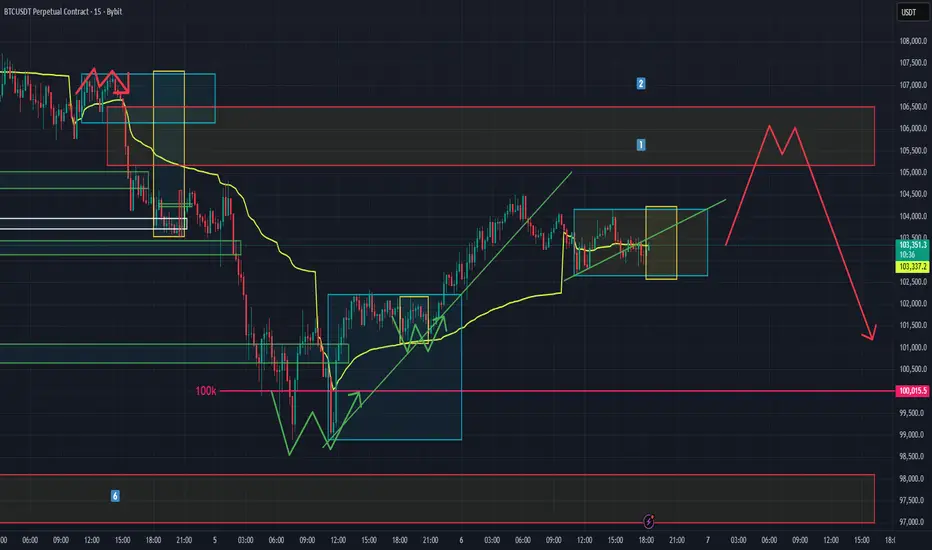
BTC primed for L3 move up? (Short Term Analysis)After bouncing off of the 100k level yesterday we appear to have made it up through level one and level two rises which means we should be looking for one more rise before we see continuation down to collect that vector candle just below. There are many areas of interest further down but we shall see what happens in the short term first.
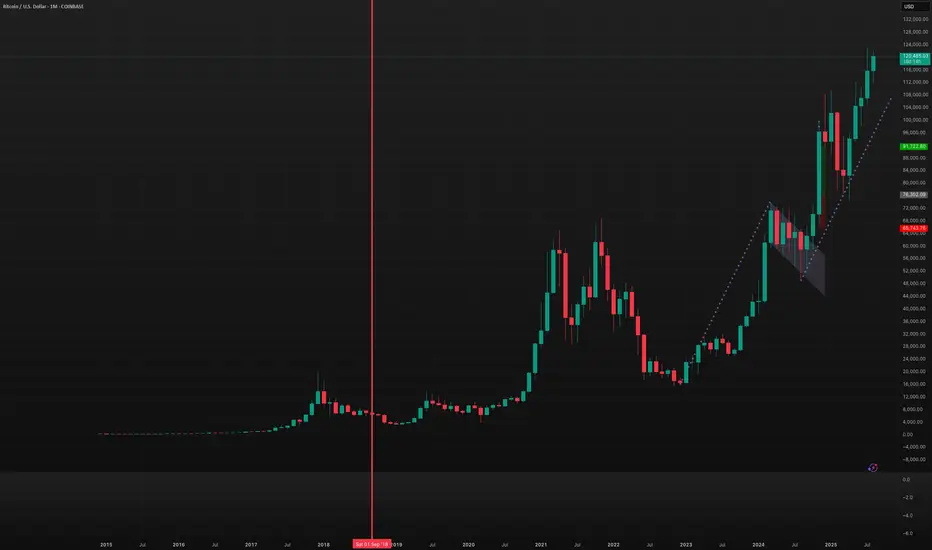
Bitcoin Loves OctoberRecently I had a client ask if I could tell them the probability of a candle being bullish or bearish. My fingers got excited and I tried it out. Little did I know this rabbit hole was getting adventurous.
July this month, COINBASE:BTCUSD rose by 8%. The probability read 70% which now makes it 78% next year. Whats even more curious is that October has a 90% chance of having a buillish candle.
Now the question remains, will this october be the one to lower this score or raise it?
Lets wait and find out.
Bitcoin : Stay heavy on positionsBitcoin : Stay heavy on positions (3x)
A signal for catching a bounce has emerged.
Within 1–2 weeks after the bounce signal, leverage is reduced from 3x to 2x.
** This analysis is based solely on the quantification of crowd psychology.
It does not incorporate price action, trading volume, or macroeconomic indicators.

BTC 1W😎Probabilities of a correction to the 55-period moving average, a technical rebound for bullish continuation, without breaking the weekly uptrend.
♥ Keep in mind that a correction to the 55-period moving average on the weekly chart constitutes a bearish trend on the daily chart.

BTC 4H Trade Idea Here is an trade idea for Bitcoin on 4H time frame.
BTC has renounced from important daily reversal zone. Looks good here for upside.
Entry & Exit Points are given with RR of 2.13. Amazing!!!!!
DYOR NFA..

BTC-USD LOW in PLACE, moving UPFor BTC-USD the LOW seems to be in place. It needs to start closing DAILY above $115,685 so it can then run up to the WEEKLY Reversal levels between $123,119 and $130,367 .

BTC/USDT Analysis. Testing the Lower Boundary of the Range
Hello everyone! This is the trader-analyst from CryptoRobotics, and here’s your daily analysis.
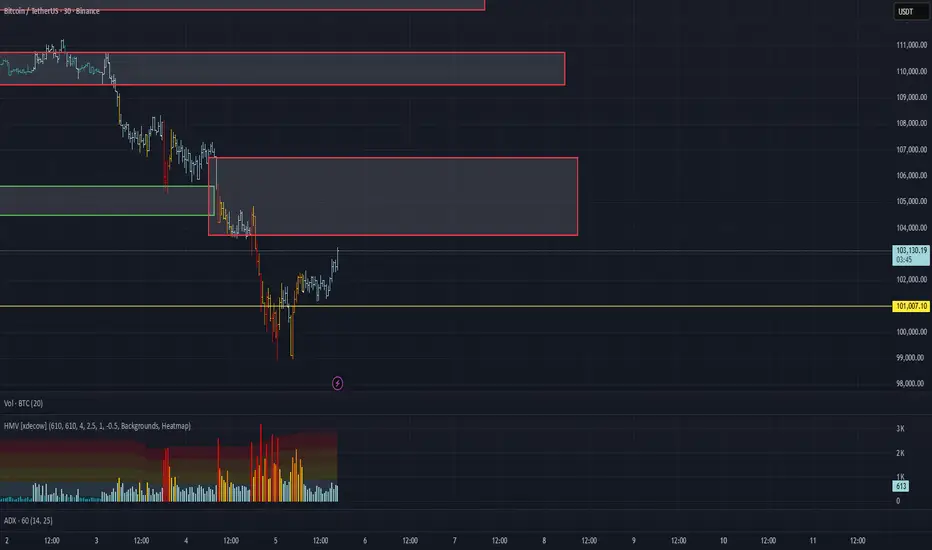
Since Monday, Bitcoin has moved exactly as expected — heading lower and testing the $105,600–$104,500 support zone (volume anomalies).
Volumes spiked sharply, and some selling pressure was absorbed, but on the second test, the price slid through the level almost effortlessly.
At the moment, Bitcoin is testing the lower boundary of the global range $102,000–$116,000, where we’re observing strong volume anomalies that have triggered a short-term correction.
However, this reaction alone is not enough for a full reversal.
We expect a retest of the push-volume zone $103,700–$106,700, from where seller pressure may resume, leading to a move toward ~$101,000.
Only if that zone shows strong buying defense can we consider long entries.
For now, the bias remains bearish — the market seller is weak, but the price continues to move downward by inertia.
If the $101,000 level fails to hold, the next downside target lies at $97,000–$93,000.
Buy Zones:
• ~$101,000 (volume anomalies)
• $97,000–$93,000 (volume zone)
Sell Zones:
• $103,700–$106,700 (push volumes)
• $109,500–$110,700 (accumulated volumes)
• $112,400–$113,300 (accumulated volumes)
• $114,700–$115,700 (accumulated volumes)
• $120,900–$124,000 (volume zone)
This publication is not financial advice.
Bitcoin Losses Hit 9-Month High Of $24 Billion Amid 8% Price DroBitcoin is trading at $101,729 at the time of writing, sitting just above the critical $100,000 support. Earlier, BTC slipped below this level, forming an intra-day low of $98,966 before rebounding slightly.
The recent 8% drop has validated a head-and-shoulders pattern, which projects a potential 13.6% decline targeting $89,948. However, if investors begin buying at lower levels, Bitcoin could bounce from $100,000 and retest $105,000 or higher.
Conversely, continued selling pressure and weak market conditions could send BTC below $100,000 again. A breach under $98,000 may lead to further losses toward $95,000 or lower, undermining any short-term recovery hopes.

Bitcoin at Make-or-Break Zone. History Says Bounce Incoming!IG:BITCOIN is currently trading above the 50 EMA on the 1W chart, a level that has historically acted as a strong dynamic support during previous bullish cycles.
Each time CRYPTOCAP:BTC has touched the 50 EMA in the past (as highlighted on the chart), it has triggered a strong rebound leading to significant upside moves. Currently, the price is consolidating near both the support zone and the 50 EMA, suggesting that the market is once again at a critical juncture.
If IG:BITCOIN manages to hold this zone and bounce, we could see the next bullish leg pushing towards $150K. However, a clean break below the 50 EMA and support area could indicate a short-term downtrend or deeper correction before resuming the uptrend.
Traders should stay patient and prepared for all possible scenarios. Risk management remains key at these levels.Plan your entries and stops accordingly.

BTC/USD Monthly Forecast: Targeting $128K After FVG MitigationKey Observations:
Current Price Action: The price has seen a significant pullback over the last month(s) after a strong bullish run.
Support/Demand Zone: The price is currently approaching a critical shaded green zone labeled "M / FVG" (Likely standing for Mitigation Block / Fair Value Gap). This zone, roughly between $95,000 and $97,500, is anticipated to act as a strong support or demand area where buyers are expected to step in.
Bullish Structure: The prior price action showed a "BOS" (Break of Structure) to the upside, indicating that the overall market structure remains bullish on this higher timeframe.
Liquidity Targets ($$$$ $):
The first major target above is indicated as a liquidity pool ($$$$ $) around $110,000 - $112,000.
The ultimate higher target is another, more significant liquidity pool ($$$$ $) around $126,000 - $128,000.
Projected Path: The dotted line illustrates a potential bullish scenario:
A final drop into the M / FVG demand zone for mitigation/re-accumulation.
A strong reversal and rally toward the first liquidity target (approx. $112,000).
A potential continuation to the higher liquidity target (approx. $128,000).

Relief Bounce incoming on BTC? We've smashed through all my previous levels for today but there is still a bit of vector candle to recover just below here at point 6. Is this the beginning of the end for this cycle?

BTC/ETH-USD Bouncing as ExpectedProvided that this bounce and breakout DOES NOT FAIL, this is what the beginning of a BOUNCE looks like as far a TA is concerned.

BTC-USD So far so good! Weekly 50MA HeldIt's amazing how we humans can become so BULLISH or so BEARISH!
This test of the Weekly 50MA is as normal as it gets. For as long as it does not FAIL to breakout, the BULL RUN remains INTACT.

Bitcoin - The devastating top formation!💎Bitcoin ( CRYPTO:BTCUSD ) is creating a top:
🔎Analysis summary:
In the end of 2022, we witnessed another perfect bullish break and retest on Bitcoin. This retest was followed by an incredible rally of +600%. But slowly, Bitcoin is retesting a massive curve resistance, which has been pushing price lower for the past 15 years.
📝Levels to watch:
$100,000 and $50,000
SwingTraderPhil
SwingTrading.Simplified. | Investing.Simplified. | #LONGTERMVISION

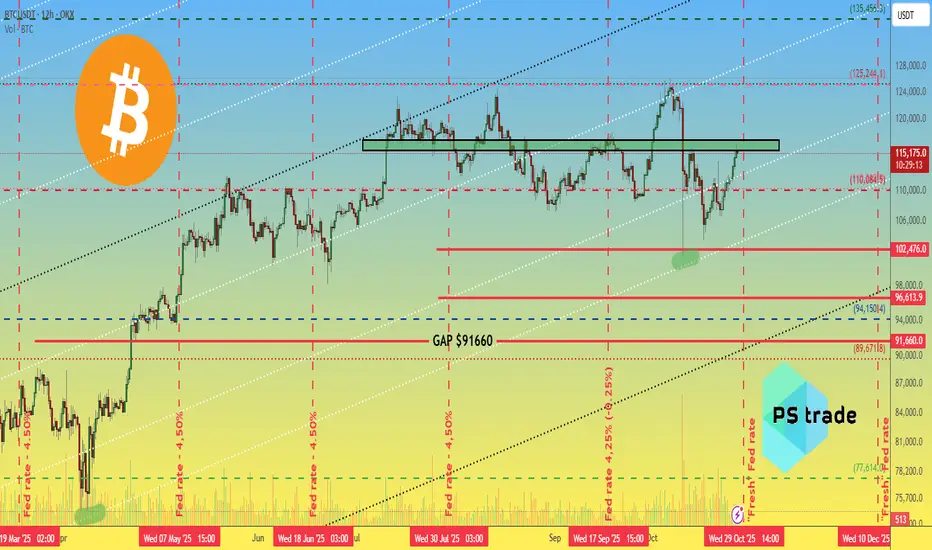
Crypto Markets Enter a Volatile Week Ahead of Key Global EventsKey events shaping volatility this week:
Oct 29: FED rate decision (expected -0.25%)
Oct 30: Trump–Xi meeting in South Korea
Market sentiment:
Fear & Greed Index jumped from 22–34 → 51
Short-term optimism is returning as macro uncertainty softens
CRYPTOCAP:BTC Technical Zone:
Current resistance: $115,500–117,000
Support: $110,000
A confirmed breakout above 117K could open the way to the next bullish leg on OKX:BTCUSDT
Question remains: is this the start of a new rally or just a pre-correction bounce?
______________
◆ Follow us ❤️ for daily crypto insights & updates!
🚀 Don’t miss out on important market moves
🧠 DYOR | This is not financial advice, just thinking out loud.
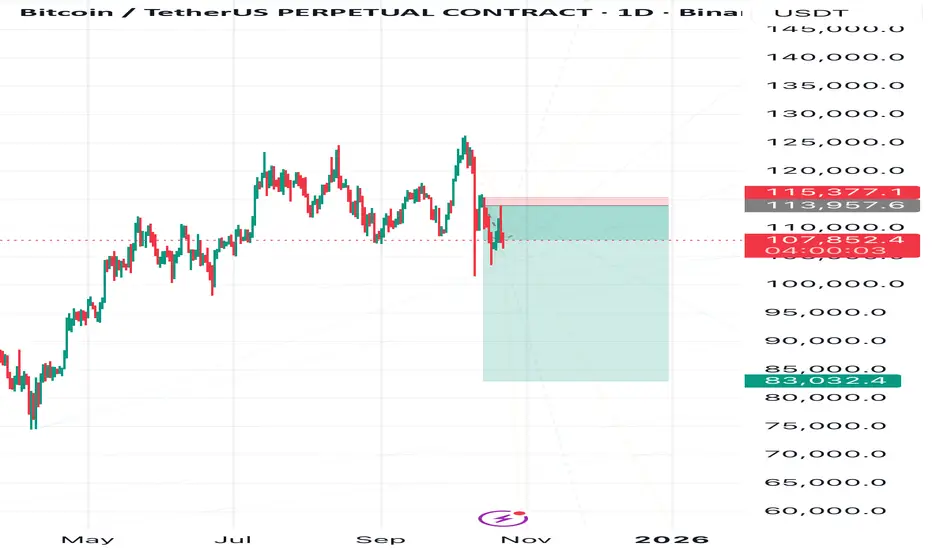
Winter Has Arrived — Bitcoin’s Chill DiveBitcoin’s chart looks frosty — I expect a decline toward 83,000.
The red zone on the chart marks the invalidation area, where my plan will be canceled if price reaches it.
I believe Bitcoin is entering a corrective phase, and the market might need a “cool down” before any new rally can start
BTCUSD Bearish: Break Below 104,200 Targets 96,000Bitcoin on the 1D is trending lower after the early-October peak near 125,000. Price sits beneath the 20/60/120 MAs, and a clear Descending Triangle has formed with a flat floor at 104,200 and lower highs pressing from above. The heavy resistance band at 113,400–114,500 and the short-term cap near 115,000 continue to attract selling. Volume has favored down days, keeping momentum on the bears’ side.
Primary path: a daily close below 104,200 confirms breakdown and opens 100,000 first, then the 96,000 objective. Aggressive sellers can also look for a failed rally into 108,000–109,500 to fade the lower-high structure. If downside accelerates, a worst-case extension toward 90,000 is on the table within the pattern’s continuation.
Alternative: if 104,200 holds and price reclaims 108,500 on a strong daily close, a squeeze toward the 113,400–114,500 cluster and 115,000 resistance is plausible. That would signal a failed breakdown but not a trend change unless buyers can establish acceptance above those overhead levels.
Trigger/confirmation: daily close < 104,200 for continuation; secondary trigger is a rejection from 108,000–109,500. Targets: 100,000 and 96,000 (bearish), or 114,500–115,000 (contrarian bounce). Invalidation: for shorts, a daily close back above 108,500; for any tactical longs, a slip back under 103,500 negates. This is a study, not financial advice. Manage risk and invalidations.

Bitcoin 1 day analysisBitcoin is at important reversal zone and almost started reversal.
A successful reversal will lead to $109000 and break from here will lead to $95000.
I view favors for upside. NFA DYOR

Bitcoin Price Crash Below $100,000? Here’s How It Could HappenAt press time, Bitcoin trades at $104,268, having slipped below the $105,000 support level. However, it is holding above the $100,000 which it has since May this year.
Nevertheless, the crypto king continues to trace the head and shoulders pattern, which historically precedes a bearish breakdown.
If the pattern confirms, it could result in a 13.6% drop from its neckline, pushing Bitcoin toward $89,948. Combined with weakening inflows and potential EMA crossover, the risk of a sub-$100,000 correction appears high in the short term.
However, a quick recovery could still prevent this outcome. If Bitcoin finds investor support and reclaims $105,000 as a stable floor, it could rebound toward $110,000. Surpassing this resistance would invalidate the bearish outlook and restore short-term market confidence.

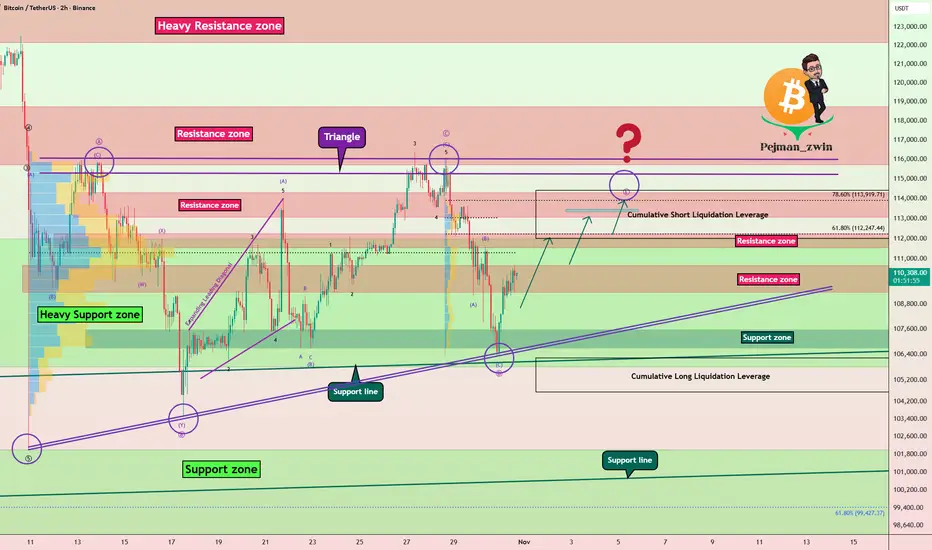
Bitcoin Correction Forming a Triangle – Which Way Next?Bitcoin ( BINANCE:BTCUSDT ), just as I expected in the previous idea , started to decline and reached its full target .
Over the past 20 days , Bitcoin has been moving in a ranging pattern that seems to be forming into a triangle shape .
From an Elliott Wave perspective , this corrective structure also appears to be a triangle , with its wave E potentially completing around the Resistance zone($114,300-$113,000) and the Cumulative Short Liquidation Leverage($114,424-$112,000) .
I expect that in the coming hours, Bitcoin can rise at least up to about $112,800 . If the upward momentum is strong enough , we might even see it reach the upper lines of the triangle .
Cumulative Long Liquidation Leverage: $106,231-$104,648
Please respect each other's ideas and express them politely if you agree or disagree.
Bitcoin Analysis (BTCUSDT), 2-hour time frame.
Be sure to follow the updated ideas.
Do not forget to put a Stop loss for your positions (For every position you want to open).
Please follow your strategy and updates; this is just my Idea, and I will gladly see your ideas in this post.
Please do not forget the ✅' like '✅ button 🙏😊 & Share it with your friends; thanks, and Trade safe.
Tuesday Asia Range AnalysisTuesday Asia is a 1% consolidation with single session M formation indicating lower movement.
Current areas of interest down include:
1 - previous day low sweep and/or vector candle 104,800
2 - Daily ADR low
3 - Previous low and remainder of longer term unrecovered vector candle

Bitcoin BullishThis crypto has been bearish for the past few days, and has reached a POI, 1 H our demand Zone.
I anticipate a slight bullish pullback towards the 109 - 110k supply Zone.
