BITCOINS - ANOTHER OPPORTUNITYTeam,
last week we went long BITCOINS at 108k, then add more at 107500, with target at 109-111k
TARGET HIT
We are now entered at 107.5k, will add more at 107k
WITH STOP LOSS AT 105K
Target 1 at 109-111.5k
Target 2 at 113-115k
Once it hits 1st target, take a partial 70% and bring the stop loss to BE for the next target.
Bitcoinprediction

Bitcoin Setup Ahead – Is the $115K Target Within Reach?🎯 BTC/USDT: The Gentleman Thief's Heist Plan | $115K Target 🔥
📊 Market Overview
Asset: BTC/USDT (Bitcoin vs Tether)
Market: Crypto
Strategy Type: Swing/Day Trade
Bias: 🐂 BULLISH
🎭 The Setup: Planning the Perfect Heist
Ladies & Gentlemen, gather 'round! We're orchestrating a sophisticated Bitcoin heist, and the vault is looking mighty accessible right now. 💼💰
🔍 TECHNICAL CONFIRMATION
✅ Weighted Moving Average (WMA) Double Pullback Detected
The chart structure shows a confirmed bullish setup with double pullback pattern on the WMA, signaling potential upward momentum continuation.
🚪 Entry Zone: Any Price Level
That's right, OG Thieves — flexibility is key! You can enter at current market price. We're not picky when the setup looks this clean.
🚨 Stop Loss: $103,000 (The Escape Route)
Now listen carefully, fellow bandits: This is my stop loss level at $103,000. But here's the deal — I'm NOT telling you to blindly follow my SL. You're the mastermind of your own operation! Manage your risk, protect your loot, and make decisions based on YOUR risk tolerance. Every thief needs their own exit strategy. 🏃♂️💨
🎯 Target: $115,000 (The Main Score)
Our primary target sits at $115,000. Why stop at $116K when there's a police barricade (strong resistance) + overbought conditions + potential trap zone lurking there? Smart thieves know when to grab the bag and disappear before the alarms go off! 🚔
Important Reminder: This is MY take-profit level. You run your own show! If you want to be greedy and push for $116K+, that's YOUR call. Take profits when YOU feel comfortable. This is your heist, not mine! 💼✨
🔍 Technical Analysis: Reading the Blueprint
Key Resistance Zones:
$115,000 - Primary target (Sweet spot to secure profits)
$116,000 - Strong resistance + overbought danger zone (Police barricade territory!)
Support Levels:
$103,000 - Critical support/stop loss area
Market Structure: Bullish momentum intact with room to run toward our target zone. Watch for signs of exhaustion near $115-116K.
👀 Related Pairs to Watch
Keep your eyes on these correlated moves:
🔹 ETH/USDT - Often follows Bitcoin's lead; look for confirmation
🔹 BTC Dominance (BTC.D) - Rising dominance = BTC outperformance
🔹 DXY (US Dollar Index) - Inverse correlation; weak dollar = crypto strength
🔹 TOTAL (Total Crypto Market Cap) - Confirms overall market sentiment
Key Correlation: When BTC pumps with strong volume, altcoins typically follow with a slight lag. Monitor Ethereum for confirmation of crypto-wide bullish sentiment.
🎪 Risk Management: Don't Get Caught!
⚠️ This is a high-risk, thief-style trading strategy — meant for entertainment and educational purposes!
✅ Golden Rules:
Never risk more than you can afford to lose
Position sizing is EVERYTHING
Have YOUR OWN exit plan
Markets can reverse faster than you can say "heist"
This is NOT financial advice — just one thief sharing his blueprint with other thieves! 🎩
💬 Final Word from Your Fellow Bandit
Stay sharp, stay disciplined, and remember: The best thieves are the ones who live to steal another day! 😎🔓
Whether you're swinging for the fences or day-trading the volatility, make sure you've got YOUR plan locked in. My levels are just a reference point — YOU are the mastermind of your own trading heist!
Good luck, OG Thieves! May your bags be heavy and your exits be timely! 🎯💰
✨ "If you find value in my analysis, a 👍 and 🚀 boost is much appreciated — it helps me share more setups with the community!"
#Bitcoin #BTCUSDT #CryptoTrading #SwingTrading #DayTrading #TradingView #CryptoAnalysis #BullishSetup #BTCPrediction #CryptoSignals #TechnicalAnalysis #BitcoinTrading #CryptoTA #PriceAction #TradingIdeas

$BTC SUNDAY UPDATE We’re still holding our short position BTC SUNDAY UPDATE
We’re still holding our short position from the last 85 days, and it’s been playing out exactly as planned.
Bitcoin dumped multiple times from the 116K–124K short range which has been our sell zone every time, and we’ve stayed patient, holding through every bounce.
Right now, BTC is trading around 110K, sitting just below the 1D 50 EMA, currently near 112.7K. If BTC breaks and holds above 112.7K, there’s a chance we could see 116K–117K, and that’s exactly where I’ll be adding more shorts. 🚨 My main target remains below 100K.
BANKS UNDER MASSIVE PRESSURE 🏦
Liquidity stress is building fast. The Fed may pause QT, but that doesn’t mean money is coming back. There’s no QE yet. Banks are struggling to stay liquid as repo borrowing just hit $50B in a single day and reverse repo usage spiked again.
That’s a clear sign the system is tightening. If this continues, we could see forced selling across risk assets. I’m still short on BTC until the Fed is forced to print again. That’s when the real rally begins. 💥
In simple terms:
🏦 Banks are showing signs of liquidity strain.
💸 QT is removing cash from the system.
📊 The Fed saw a surge in overnight borrowing.
#Bitcoin #BTC #Crypto #MarketUpdate #Liquidity #Fed

BTC/USD Liquidity Blueprint – Are You Reading the Flow Right?🎯 BTC/USD: The Great Heist Setup | Swing Trade Blueprint 💰
📊 Market Overview
Asset: BTC/USD (BITCOIN/US DOLLAR)
Market: Cryptocurrency
Trade Type: Swing Trade
Strategy Style: The Thief Method™ (Layered Entry System)
🎨 Technical Setup
📈 Market Structure: BULLISH CONFIRMED
The Simple Moving Average is showing strong accumulation patterns with a healthy pullback structure. Bulls are loading up their bags like thieves preparing for the ultimate vault heist! 🏃♂️💨
Key Technical Indicators:
✅ SMA showing strong bullish accumulation
✅ Pullback phase completed
✅ Higher lows formation intact
✅ Volume supporting upside momentum
🎯 The Heist Plan: Entry Strategy
💎 The Thief Layered Entry System
Instead of going all-in at one price (that's how amateurs get caught! 👮), we're using a professional layered approach with multiple buy limit orders:
Entry Layers:
🔹 Layer 1: $108,000
🔹 Layer 2: $109,000
🔹 Layer 3: $110,000
🔹 Layer 4: $111,000
🔹 Layer 5: $112,000
💡 Pro Tip: You can add more layers or adjust based on your bag size and risk appetite. The beauty of this strategy? You average into position like a pro! 🎭
🛡️ Risk Management
⛔ Stop Loss: $106,000
⚠️ Important Note: Dear Thief OG's (Ladies & Gentlemen),
This is MY stop loss based on MY risk tolerance. You're the captain of your own ship! 🚢 Set your SL according to YOUR risk management rules. Remember: Take profits at your own risk, protect capital like it's your treasure!
🎯 Target Zone: The Great Escape
🚨 Target: $124,000
Why this target?
The "Police Barricade" (strong resistance zone) sits right here with multiple confluence factors:
🔴 Major resistance level
🔴 Overbought conditions expected
🔴 Bull trap zone activated
🔴 Historical rejection area
🏃♂️ Exit Strategy: When we hit this zone, it's time to take your loot and run! Don't get greedy and caught in the trap!
⚠️ Important Note: Dear Thief OG's (Ladies & Gentlemen),
This is MY take profit target. You're free to take profits whenever YOU feel comfortable. Your money, your rules, your timeline! 💰
🔗 Correlated Pairs to Watch
Keep your eyes on these related assets for confirmation:
💱 Major Correlations:
BITSTAMP:ETHUSD - Typically follows BTC momentum; watch for similar accumulation
BINANCE:BTCUSDT - Alternative pairing for liquidity confirmation
TVC:DXY (US Dollar Index) - Inverse correlation; weakness in DXY = strength in BTC
$SPX/SPY (S&P 500) - Risk-on sentiment indicator
GOLD ( OANDA:XAUUSD ) - Alternative store of value; competitive correlation
📍 Key Correlation Points:
When DXY weakens, crypto typically strengthens
Traditional market risk-on flows support Bitcoin upside
ETH/BTC ratio helps confirm alt-season vs BTC dominance
Gold movements indicate macro hedging flows
⚙️ Why The Thief Strategy Works
✨ Dollar-Cost Averaging (DCA) on steroids
✨ Reduces emotional decision-making
✨ Better average entry price
✨ Lower risk per order
✨ Professional money management
Think like a thief planning the perfect heist: multiple entry points, calculated risks, clear escape route! 🎭
🎬 Final Thoughts
This isn't financial advice—it's a strategic blueprint for those who trade with discipline and style! The market is our playground, but only the smart thieves get to keep their loot. 🏆
Remember:
📊 Stick to your plan
🎯 Manage your risk
💰 Take profits systematically
🧠 Trade with logic, not emotion
🎭 Execute like a professional
📣 Support This Analysis
✨ If you find value in my analysis, a 👍 and 🚀 boost is much appreciated — it helps me share more setups with the community!
#Bitcoin #BTCUSD #CryptoTrading #SwingTrade #TradingStrategy #TechnicalAnalysis #CryptoAnalysis #BTC #LayeredEntry #RiskManagement #ThiefStrategy #CryptoSignals #BitcoinAnalysis #PriceAction #TradingSetup #CryptoTA #BTCSetup #SwingTrading
🎯 Stay sharp, trade smart, and may the profits be with you! 🚀

From 107K to 104K — Bitcoin’s Next Stop Before the Big Drop?An update to my previous Bitcoin outlook — we’ve almost reached my 107K target.
Now, I’m setting a new short-term goal at 104K, though I believe we might even dip toward 100K.
Let’s see how the chart reacts as we approach the 104K zone.
On a larger scale, as I mentioned in one of my earlier posts, my global target remains around 83K.
The invalidation zone for this scenario is marked directly on the chart.
Let’s summarize 👇
📉 Nearest target: 107K (almost reached)
📉 Next target: 104K
📉 Possible drop to: 100K
🌋 Global target: 83K
👁️Follow me so you don’t miss future updates to my forecasts!

BTC Sweeps Psychological High and rejects off of EMABitcoin has swept the psychological high level and rejected off of the EMA which may be our false move week beginning for this week. Short term bearish if this M confirms. But as this may be the false move we could be looking for further upside tomorrow.


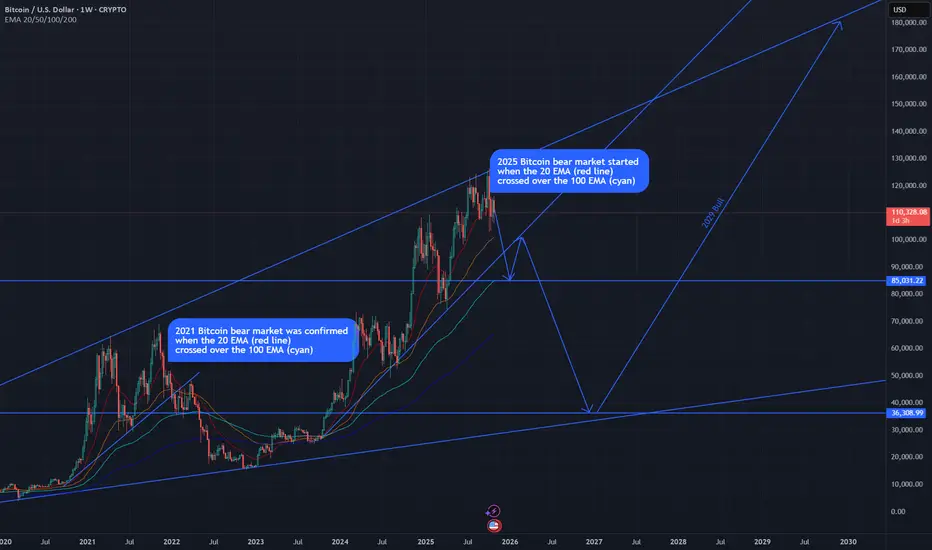
Bitcoin Beyond 2025, Path to 2029 Peak & 4 year cycleLikely bitcoin price movement for the rest of 2025 to the bear market bottom of 2026/27 and finally to the next bull peak of 2029
Check in early 2027 for accuracy

Bitcoin Beyond 2025, Path to 2029 PeakLikely bitcoin price movement for the rest of 2025 to the bear market bottom of 2026/27 and finally to the next bull peak of 2029
Check in early 2027 for accuracy
Bitcoin 2025-2029 CycleLikely bitcoin price movement for the rest of 2025 to the bear market bottom of 2026/27 and finally to the next bull peak of 2029
Check in early 2027 for accuracy

BITCOIN HIGH PROBABILITY SETUP SOON!!!🚨 BTC HIGH PROBABILITY SELL/BUY SETUPS 🚨
* Here We Can See Clearly The Next Potential Moves For BTCUSD Coming Hours/Days.
* Keep Your Eyes Close On Your Trading Positions.
* Happy PIP Hunting Traders.
FXKILLA.

Bitcoin - The manipulation!On the weekly Bitcoin chart, there’s a clear bearish rising wedge pattern, and right now it’s trading near the lower side of that wedge — getting ready for a downward weekly breakout.
But let me remind you of something important — this will likely be part of a psychological game played by market makers, so remember my words carefully:
- Bitcoin will break down from the wedge, giving a bearish signal, and many traders will enter short positions.
- It’ll even dip slightly below the 50 EMA, making everyone more confident in the bearish move.
- Then, it’ll reverse sharply upward, liquidating all the short positions.
Market makers always make you believe your plan is playing out perfectly — right before they turn against you and take your money.
So stay alert, place your buy orders slightly below the 50 EMA, and avoid using high leverage.
Best Regards:
Ceciliones🎯

BTC Retracement Setup After Liquidity Sweep at Key Resistance📊 Bitcoin 4H Analysis – Bullish Momentum Meets Key Liquidity Zone
Bitcoin continues to trade within a strong bullish trend on the 4-hour timeframe. Price has now tapped into a major resistance zone — the liquidity sitting above a previous external range high. This reaction suggests we may see a corrective move before the next leg higher. 🔁💡
I’ll be waiting for price to retrace back into equilibrium of the current bullish price swing, where premium turns to discount, to look for a high-probability long setup. ✅🎯
⚠️ Not financial advice — for educational purposes only.

BTC/USDT Analysis. A Moment of Uncertainty
Hello everyone! This is the trader-analyst from CryptoRobotics, and here’s your daily analysis.
Yesterday, we expected a false breakout followed by renewed buying activity, but the market took a different turn.
Bitcoin broke the local low, and the buyer’s response was much weaker than anticipated.
Although we later saw absorption of the sell bar, overall buying pressure still looks insufficient.
At the moment, we’re observing a phase of uncertainty: a new volume zone has formed around $110,000, which could serve as a pivot for either further decline or a retest of the upper resistance levels.
For now, we remain out of positions and wait for a clearer market structure to form.
Buy Zones:
• $105,600–$104,500 (volume anomalies)
• $97,000–$93,000 (volume zone)
Sell Zones:
• $112,400–$113,300 (accumulated volumes)
• $114,700–$115,700 (accumulated volumes)
• $120,900–$124,000 (volume zone)
This publication is not financial advice.

BITCOIN SIGNAL: HERE IS THE NEXT MOVE!!!! (damn)Yello Paradisers! Enjoy the video!
And Paradisers! Keep in mind to trade only with a proper professional trading strategy. Wait for confirmations. Play with tactics. This is the only way you can be long-term profitable.
Remember, don’t trade without confirmations. Wait for them before creating a trade. Be disciplined, patient, and emotionally controlled. Only trade the highest probability setups with the greatest risk to reward ratio. This will ensure that you become a long-term profitable professional trader.
Don't be a gambler. Don't try to get rich quick. Make sure that your trading is professionally based on proper strategies and trade tactics.

BTC 4H ENG.My kids are scared; they got scared with the October 10th crash. Do you know when they stop being scared? When it goes up! I have my futures take profits at 117k; you're my target. I've had my entry pattern very clear, since I was at 106k. The red box indicates an ideal entry area, although you should already be inside.

BTC 4H ENGLISHBearish divergence forming. We're about to break the previous high. What's next? A pullback continues to rise, as the daily chart holds a bullish pattern. I'm not shorting that trade. I'm waiting for my next bullish entry to complete the daily chart's move.

Bitcoin Crash, Correction or the Final Shakeout. What to Watch.In this video, I examine the narrowing window of opportunity for us to still push up to $150k this year, and potentially $200k by Q1 2026.
The weekly Bollinger Bands (Modified for Crypto @ 3STDev) show tightening which signals a likely bigger move is brewing. The question is, do we breakout to the upside...
Or continue lower, to the $100k - $105k range where I'm seeing buyers and placing my buy orders.
I've been in cash for weeks, waiting for the final shakeout which appears to be happening now.
Let me know your thoughts below and what you think comes next!
- Brett

BTC/USD: Anticipating Rejection from FVG and Short-Term DropRecent Trend: Following a period of upward movement (October 24th - 27th), the price experienced a sharp drop from its peak near $116,000, indicating a short-term structural break to the downside.
Fair Value Gap (FVG): The shaded gray box, labeled FVG, represents a zone of price inefficiency created during the aggressive drop (between approximately $112,000 and $113,000). The price is currently trading near the lower boundary of this FVG.
Consequent Retracement Levels (CRT):
CRT-L (around $113,600) is the highest level of the FVG structure.
CRT-H (around $109,200) is the next anticipated level of support and the target for the expected decline.
Proposed Price Action:
The primary curved arrow indicates the expectation that the price will move up into the FVG zone to "fill" or mitigate the inefficiency.
After reaching the FVG, the price is expected to reject the zone and resume its decline (indicated by the straight black arrow) towards the CRT-H support level at approximately $109,200.
Interpretation and Trading Bias
The analysis suggests a short-term bearish outlook for Bitcoin. The setup is based on the principle of price mitigating its imbalances (the FVG) before continuing the move that created that imbalance. The trade idea is to wait for the price to reach the FVG (the area of liquidity/resistance) before entering a short (sell) position targeting the CRT-H low.

BTC - Two Scenarios Despite all the criticisms I have received on these ideas, it doesn’t change the truth that this is what Bitcoin has been setting up for in its chart.
Scenario 1 - 3 Wave Corrective Drop:
108,500 SHORT to 34,800
34,800 LONG to 80,000
80,000 SHORT to 8,000
Scenario 2 - Straight wick to 8,000
108,500 SHORT to 8,000 to 10,000
Why do I say Bitcoin is inevitably going to see this drop to 8,000?
1. Long Stop Loss orders being accumulated and left in tact all the way down
2. DXY bearish retest translating to a 4-6 year long bull market from here on out
3. Market Makers want their money back
I have a 99% confidence this will happen.
Unfortunately, Bitcoin moves on either side of these major trendlines, and it’s been very difficult to time when it will occur.
Everytime we fall underneath, I feel it’s responsible to inform traders on this platform of this possibility.
- DD

BTC/USDT Analysis. A Long Opportunity?
Hello everyone! This is the trader-analyst from CryptoRobotics, and here’s your daily analysis.
Yesterday, Bitcoin followed our primary scenario — a move down toward the nearest support zones.
In the first zone at $111,700–$110,000, trading volumes spiked but didn’t trigger a reversal.
Upon reaching the next zone at $108,700–$107,500, a similar pattern emerged, but with stronger buyer activity, leading to a graphical trend shift.
Currently, we’re seeing a wave of selling, yet delta data shows absorption of market sales, indicating potential accumulation and a shift in sentiment.
This creates an interesting opportunity for a long position with limited risk.
We expect a test of the local low — if a false breakout occurs with a surge in volume, we’ll consider a long entry targeting the nearest resistance at $112,400–$113,300 (accumulated volumes).
Buy Zones:
• $105,600–$104,500 (volume anomalies)
• $97,000–$93,000 (volume zone)
Sell Zones:
• $112,400–$113,300 (accumulated volumes)
• $114,700–$115,700 (accumulated volumes)
• $120,900–$124,000 (volume zone)
This publication is not financial advice.

BTCUSD (Bitcoin) has broken powerful support = Time to sell!BTCUSD (bitcoin) has been in a new bearish trend for the last few weeks and has just recently broken a major support level which is shown (white line drawn) .. it has also broken the support level of an upward channel (the 2 red trendlines) ... The next very likely outcome for bitcoin is for it to hit and test the next support level all the way to the downside.

BTCUSDT – Hawkish Fed Sends Bitcoin to Test Its 200‑Day LineBitcoin extended losses this week as Fed Chair Jerome Powell’s hawkish tone cooled expectations for another rate cut. The move left traders torn between short-term risk-off signals and long-term technical support.
The Fed’s second straight 25-basis-point cut was widely expected, but Powell’s comments hinted that the central bank may pause before easing further. That shift strengthened the dollar and Treasury yields, weighing on crypto and risk assets. Bitcoin slipped around 3% to below $108 000 before finding temporary footing.
🔹 Macro & Sentiment
Powell’s message was clear: the committee remains divided, and caution may prevail into year-end. That triggered profit-taking across risk markets. Meanwhile, Trump’s “amazing” meeting with Xi Jinping and a new trade truce added volatility, but digital assets lagged the optimism seen in equities — a sign of hesitation among crypto traders.
🔹 Chart & Levels
BTC is now testing its 200-day moving average near $110 000, a level that has defined the broader uptrend since summer. Below that, key support sits at $107 000 and $100 000. Resistance remains around $120 000–$127 000. A clean bounce from the 200-day line could restore bullish momentum, while a break beneath it would expose the lower range.
As long as $110 k holds, bias stays cautiously bullish toward $120 k+. Below $110 k, the outlook turns more corrective.
🧾 The Takeaway
Fed caution has slowed Bitcoin’s momentum but not yet reversed its trend. The next major move depends on whether the 200-day line can hold under the pressure of a stronger dollar and shifting rate expectations.
Off to you: Will Bitcoin COINBASE:BTCUSD defend its 200-day support or roll over for a deeper correction?
