BTC/USDT | BTC Update – Testing the $112K Barrier!By analyzing the #Bitcoin chart on the 12-hour timeframe, we can see that after finding strong support near $103,500 , BTC has continued its recovery and recently reached $111,700 . The key question now is whether the price can break decisively above the $112K resistance zone.
The $103K–$105K range still acts as a major demand area , while the $109K–$112K zone remains short-term resistance . A confirmed breakout above $112K could open the door toward $113,800, $116,000, and $119,600 , while rejection from this zone might trigger another pullback before continuation.
Overall, the structure remains neutral-to-bullish , and volatility is still high — you guys should stay alert for a confirmed breakout before the next big move develops.
Please support me with your likes and comments to motivate me to share more analysis with you and share your opinion about the possible trend of this chart with me !
Best Regards , Arman Shaban
Bitcoinprediction

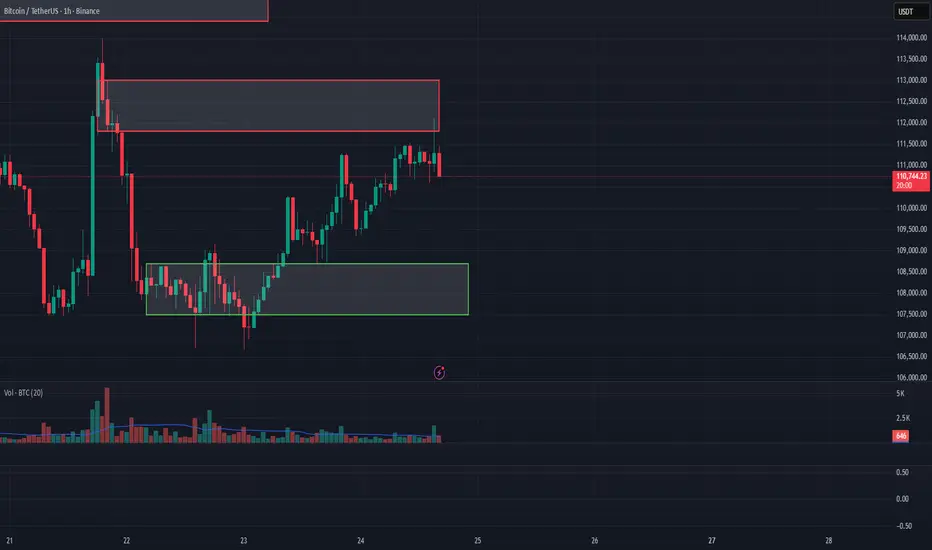
BTC/USDT Analysis. The seller’s trap worked — what’s next?
Hello everyone! This is the trader-analyst from CryptoRobotics, and here’s your daily analysis.
Yesterday, Bitcoin failed to update its local high. The zone we highlighted earlier — $115,000–$115,400 (buy absorption) — worked as expected, but buyers were unable to close above it on the hourly timeframe.
After testing this zone, the market saw a sharp decline.
At the moment, a significant amount of volume has accumulated around ~$113,000, and the delta shows selling pressure. We can expect a retest of the lower support zone and will monitor the reaction. If the price bounces from $111,700–$110,000, the first resistance to watch will be around ~$113,000.
An alternative scenario suggests renewed buying from current levels. In that case, we’ll look for short entries near the updated seller zone — $114,700–$115,700 (accumulated volumes).
Buy Zones:
$111,700–$110,000 (accumulated volumes),
$108,700–$107,500 (volume zone),
$105,600–$104,500 (volume anomalies),
$97,000–$93,000 (volume zone).
Sell Zones:
$114,700–$115,700 (accumulated volumes),
$120,900–$124,000 (volume zone).
This publication is not financial advice.

BITCOIN SIGNAL: SECRET PATTERN ABOUT TO BREAKOUT (massive)!!!!!!Yello Paradisers! Enjoy the video!
And Paradisers! Keep in mind to trade only with a proper professional trading strategy. Wait for confirmations. Play with tactics. This is the only way you can be long-term profitable.
Remember, don’t trade without confirmations. Wait for them before creating a trade. Be disciplined, patient, and emotionally controlled. Only trade the highest probability setups with the greatest risk to reward ratio. This will ensure that you become a long-term profitable professional trader.
Don't be a gambler. Don't try to get rich quick. Make sure that your trading is professionally based on proper strategies and trade tactics .

BTC. a longterm perspective :(I read that this recent BTC strength was caused by retail investor wave and that whales are sleeping. If we look from a longterm perspective -> we forget initial CUP n HANDLE pattern, and where it's next PEAK was.
this was also a 3rd wave. Still bullish longterm tho.

Bitcoin : Stay heavy on positionsBitcoin : Stay heavy on positions (3x)
Maintaining the same outlook as before.
** This analysis is based solely on the quantification of crowd psychology.
It does not incorporate price action, trading volume, or macroeconomic indicators.

Bitcoin prediction Nov 2025Bitcoin prediction Nov 2025, Bitcoin is expected to push to the upside after it broke previous high and came to test previous low and bullish order block and start to move toward previous high (Bullish Extension). This move may break previous all-time high and break record of 2025 All-time high.

BTCUSD – 4H Bearish setup BITSTAMP:BTCUSD is reacting from confluence resistance near 114K, with fading momentum and Fibonacci alignment favoring a retracement toward 112.4K, 111.3K, and possibly 109.4K if bearish momentum extends. A sustained break above 114.9K would invalidate this short-term bearish view.
Bearish Confluences:
Price is approaching the upper boundary of the maroon resistance channel while showing rejection wicks near 113.9K–114.3K — a zone aligning with previous structure highs.
Momentum has slowed near the 38.2% Fibonacci retracement of the prior downswing (around 114.3K), signaling potential exhaustion of the current bounce.
The brown mid-band (trend mean) has flattened, suggesting loss of bullish momentum and possible reversion to mean.
Candles are testing the underside of prior liquidity zones where sellers previously entered aggressively.
Bias: Short-term bearish retracement potential while below 114.3K. A confirmed 4H close under 113.5K would strengthen the bearish case.
Fibonacci Targets (from swing high ≈ 119.2K to swing low ≈ 109.4K):
38.2% Target: 112,463
61.8% Target: 111,309
100% Extension: 109,442

Bitcoin Rally Heating Up – Watch This Zone Carefully!As the new week kicked off, Bitcoin ( BINANCE:BTCUSDT ) started to climb, fueled by a pump in the S&P500 index ( SP:SPX ) and the creation of a gap in the S&P500 index.
It seems Bitcoin has successfully broken above the 100_SMA(Daily) and 50_SMA(Daily) , as well as a Resistance zone($114,300-$113,000) .
In fact, Bitcoin has also formed a new CME Gap($113,495-$110,990) due to this S&P500 Index -driven surge.
Right now, Bitcoin is approaching the next key Resistance zone($118,740-$115,740) , Potential Reversal Zone(PRZ) , the Cumulative Short Liquidation Leverage($117,577-$116,731) , and the upper line of an ascending channel .
From an Elliott Wave perspective , by breaking this Resistance zone($114,300-$113,000) , Bitcoin has entered a new phase of wave counting. It appears to be completing microwave 4 of the main wave C . Overall, the corrective structure seems to be a Zigzag Correction(ABC/5-3-5) with an expanding leading diagonal in main wave A .
I expect that in the coming hours, after a pullback to the broken Resistance zone($114,300-$113,000) and those moving averages , Bitcoin might rise again at least up to the Potential Reversal Zone(PRZ) . There's a possibility of forming a larger ascending channel, but since we haven't confirmed a second top, we can't rely on that channel just yet.
Note: In general, the crypto market in the past couple of weeks has been heavily influenced by news around U.S.-China tariffs. Any headline can cause Bitcoin and other tokens to swing up or down, so keep an eye on those geopolitical headlines.
Cumulative Long Liquidation Leverage: $113,625-$112,175
Cumulative Long Liquidation Leverage: $106,033-$104,090
Note: If Bitcoin falls below the moving averages and the Resistance zone($114,300-$113,000) again, we can expect further declines.
Please respect each other's ideas and express them politely if you agree or disagree.
Bitcoin Analysis (BTCUSDT), 2-hour time frame.
Be sure to follow the updated ideas.
Do not forget to put a Stop loss for your positions (For every position you want to open).
Please follow your strategy and updates; this is just my Idea, and I will gladly see your ideas in this post.
Please do not forget the ✅' like '✅ button 🙏😊 & Share it with your friends; thanks, and Trade safe.

BTC/USDT Analysis. The seller is trying to take control again
Hello everyone! This is the trader-analyst from CryptoRobotics, and here’s your daily analysis.
Yesterday, after reaching the upper boundary of the $115,000–$114,000 zone (local delta activity), buyers showed abnormal activity, but it failed to result in sustained growth. Only after dropping to the lower boundary did Bitcoin find support.
At the moment, we’re seeing a rebound, and the price is testing the area of yesterday’s buying activity — $115,000–$115,400. If there’s no reaction from this zone, the movement toward $120,000 may continue. However, if resistance holds, we expect a pullback toward the nearest support.
Currently, the delta shows absorption of buying, so long positions are considered only after a local high breakout followed by a retest.
Buy Zones:
$111,700–$110,000 (accumulated volumes),
$108,700–$107,500 (volume zone),
$105,600–$104,500 (volume anomalies),
$97,000–$93,000 (volume zone).
Sell Zones:
$115,000–$115,400 (buy absorption),
$120,900–$124,000 (volume zone).
This publication is not financial advice.
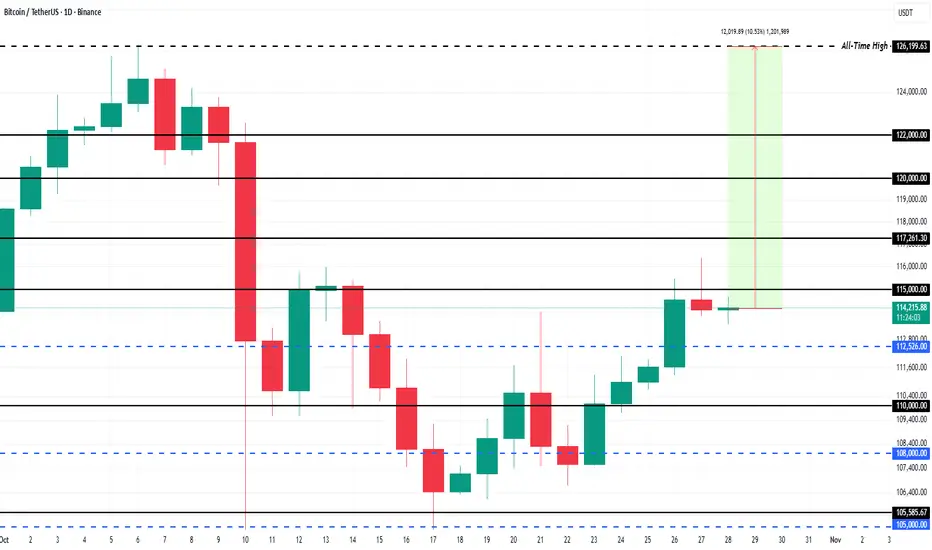
What To Expect From Bitcoin Price In November 2025At the time of writing, Bitcoin trades at $114,518, sitting just below the key $115,000 resistance level. With investor sentiment turning increasingly positive, BTC could soon push through this barrier. A confirmed breakout would likely trigger renewed momentum, driving prices toward higher resistance levels in November.
Bitcoin’s near-term target remains its all-time high (ATH) of $126,199, which requires a 10.2% rise from current levels. To achieve this, BTC must first clear strong resistance zones at $117,261 and $120,000, where heavy supply from profit-takers could temporarily slow progress.
However, if Bitcoin fails to sustain momentum above $115,000, short-term weakness could reemerge. A dip toward $110,000 remains possible if buyers lose conviction. Any move below this support would invalidate the bullish outlook.
Why Most Traders Exit Too Early — Psychology of Taking Profits1. Introduction
Most traders obsess over finding the perfect entry.
But what really separates professionals from everyone else is how they exit.
Closing trades too early kills more profits than bad setups ever will.
The problem might be one's psychology.
2. The Two Fears That Control Exits
When managing profits, every trader battles two emotions:
Fear of Loss – “ What if the PRICE reverses?”
Fear of Regret – “What if it keeps running after I close?”
Both pull you in opposite directions. One makes you take profit too soon; the other makes you hold too long.
The balance between them defines your discipline.
3. Why Most Traders Close Too Early
After entering a good trade, emotions rise. As profit builds, so does anxiety.
Instead of trusting their plan, traders imagine losing what they’ve just gained, so they close the trade prematurely.
In doing so, they trade emotion, not logic.
It feels safe in the moment, but long term it destroys reward-to-risk consistency.
4. The Solution: Predefine the Exit
The only way to remove hesitation is to plan exits before entering.
Decide in advance:
– Target levels based on structure or risk-reward.
– Conditions that justify partial profits.
– Situations that allow for trailing stops.
When these decisions are made beforehand, emotions can’t interfere mid-trade.
You act according to a plan, not a feeling.
Visual idea: Screenshot-style mockup of trade plan with marked “Entry,” “Partial,” “Final Target.”
5. The Real Lesson
Profit-taking should be systematic, not emotional.
Your job isn’t to catch every little move, it’s to execute your plan without hesitation.

BITCOIN SIGNAL: SHOCKER TARGET REVEALED!!! (warning) Yello Paradisers! Enjoy the video!
And Paradisers! Keep in mind to trade only with a proper professional trading strategy. Wait for confirmations. Play with tactics. This is the only way you can be long-term profitable.
Remember, don’t trade without confirmations. Wait for them before creating a trade. Be disciplined, patient, and emotionally controlled. Only trade the highest probability setups with the greatest risk to reward ratio. This will ensure that you become a long-term profitable professional trader.
Don't be a gambler. Don't try to get rich quick. Make sure that your trading is professionally based on proper strategies and trade tactics.

Bitcoin gains ground on improved risk sentimentIt is all about risk appetite right now driving Bitcoin prices. The rally in BTCUSD in the last few days has has coincided with renewed optimism surrounding trade negotiations between the United States and China. This is also why gold has fallen below $4K today and the S&P 500 has reached fresh record highs. Trump struck an optimistic tone, telling reporters he “really feels good” about a deal, with reports suggesting that China could resume soybean purchases and ease restrictions on rare-earth exports. In return, Washington may scale back its recent tariff threats.
Anyway, it is risk on and BTC is holding firm right now, with the crypto also creating a bullish reversal after it refused to hold below prior low at 107250 and the 200-day average a couple of weeks ago (see circled). That fake out has subsequently pushed BTCUSD back above 110K, 112K and now 115K. Key support is now 112K where the breakout from yesterday commenced and where the 21-day exponential converges.
Next upside resistance levels to watch include 116K, which was being tested at the time of writing, followed by 120K, which is a more significant level to watch.
For now, the path of least resistance is to the upside, even if we see a return to 112K support.
By Fawad Razaqzada, market analyst with FOREX.com

Analytics: Market Outlook and Forecasts
📈 WHAT HAPPENED?
Last week, amid a record drop in gold on October 21, Bitcoin entered a phase of increased volatility. Initially, the asset experienced a ~5.5% increase, forming a strong volume anomaly, before returning to its initial levels.
After a sharp reversal, we anticipated a local uptrend and a short bounce from the seller's anomaly. However, we only observed a minor short movement, which was absorbed by the buyer.
💼 WHAT WILL HAPPEN: OR NOT?
We’ve reached an important level, which is now being tested. Given how easily the market passed strong resistance, the mood remains bullish.
The main expectations: break after a local retest of the $115,000-$114,300 range (buyer activity by delta) or test the next buyer zone before resuming growth. The target for the movement is the $120,000 mark.
Buy Zones:
$115,000–$114,000 (local delta activity),
$111,700–$110,000 (accumulated volumes),
$108,700–$107,500 (volume zone),
$105,600–$104,500 (volume anomalies),
$97,000–$93,000 (volume zone).
Sell Zones:
$120,900–$124,000 (volume zone).
📰 IMPORTANT DATES
Macroeconomic events this week:
• October 27, Monday, 14:00 (UTC) — publication of data on new home sales in the United States for September;
• October 28, Tuesday, 14:00 (UTC) — publication of the US Consumer Confidence Index for October;
• October 29, Wednesday, 13:45 (UTC) — announcement of the interest rate decision in Canada;
• October 29, Wednesday, 18:00 (UTC) — FOMC statement and announcement of the US Federal Reserve's interest rate decision;
• October 29, Wednesday, 18:30 (UTC) — FOMC press conference;
• October 30, Thursday, 9:00 (UTC) — release of Germany's GDP for the third quarter of 2025;
• October 30, Thursday, 12:30 (UTC) — publication of the US GDP for the third quarter of 2025;
• October 30, Thursday, 13:00 (UTC) — publication of the German Consumer Price Index (CPI) for October;
• October 30, Thursday, 13:15 (UTC) — announcement of the deposit rate and the Eurozone interest rate decision for October;
• October 30, Thursday, 13:45 (UTC) — press conference by the European Central Bank;
• October 31, Friday, 1:30 (UTC) — publication of the Chinese manufacturing sector business activity index for October;
• October 31, Friday, 10:00 (UTC) — publication of the Eurozone consumer price index for October;
• October 31, Friday, 12:30 (UTC) — publication of the US personal consumption expenditure base price index for September.
*This post is not a financial recommendation. Make decisions based on your own experience.
#analytics
Bitcoin is approaching a make or break decision, It MUST Rise
It may be best to show you THIS chart
The Chart is the Entire history of Bitcoin. (Yellow Line )
Easy to see how EVERY All Time High has been rejected off ONE line.
A Fibonacci Spiral
There is one line of support that has Never been broken just below.
PA is now getting Squeezed between these two lines.
PA MUST REACT
And it is VERY easy to understand that unless Bitcoin PA rises above this spiral, the line of resistance, VERY VERY Strong Resistance could push PA i descent.
The Zoomed Weekly shows more detail
The Blue line is that Spiral,
The Daily chart shows us where we are Right now.
We need to break over and remain above.
The rising lines of support meet that Blue Arc, the spiral, in Late December.
PA tends to react before the apex of a Squeeze.
As we enter November 2025, we may see some strong Moves in Both directions.
PA is currently rising, trying to close October Green, it is currently RED
We had a red October in a Bull run only once before, in 2012
November is going to be Fun.

H&S on BTC accompanied by rejection from IDT (still forming)Bearish signal for further declines on crypto
Weakening volumes on the short up move

BTC/USDT Analysis. Testing a Key Support Point
Hello everyone! This is CryptoRobotics trader-analyst, and here’s your daily market review.
Yesterday, Bitcoin fully followed the scenario we outlined earlier. As selling pressure weakened, buyers stepped in, pushing the price toward the strong resistance area with major volume anomalies we mentioned before.
At the moment, expectations are tilted toward short positions — the first test of this zone has already shown a spike in volume followed by an immediate pullback. The buyer’s price action looks weaker, suggesting a higher probability of further decline.
The nearest target is support at $108,700–$107,500, while the main target remains the $105,600–$104,500 zone (volume anomalies).
Buy Zones:
$108,700–$107,500 (volume zone)
$105,600–$104,500 (volume anomalies)
$97,000–$93,000 (volume zone)
Sell Zones:
$111,800–$113,000 (strong volume anomalies)
$114,400–$115,600 (local volume zone)
$120,900–$124,000 (volume zone)
This publication is not financial advice.
BTC/USD: Testing Key Supply Zone; Expecting Rejection1. Market Context (Prior Movement)
The chart opens shortly after a sharp, significant downtrend from levels well above $118,000.
Following the crash, the price action has been primarily sideways to slightly choppy, consolidating the large prior move.
2. Key Structure: Supply Zone
The price recently saw a sharp, bullish candle that tested a new high in the consolidation but was immediately sold off. This peak region is highlighted by the teal box, which represents a Supply Zone (or Resistance Zone) between approximately $112,000 and $113,800.
This zone signifies where sellers previously stepped in forcefully, absorbing the demand and pushing the price down.
3. Current Price Action and Prediction
The price is currently retesting the lower boundary of this key Supply Zone.
The chart includes a bearish prediction (downward arrow) originating from the Supply Zone. This suggests an expectation that the zone will hold, leading to a rejection and a move back down.
The predicted downside target is the dotted line at approximately $109,233, which aligns with a previous area of support within the recent consolidation range.
In simple terms, the price is at a critical ceiling, and the expectation is a rejection leading to a pullback.

Bitcoin: Is the Market Reaching a Historical Turning Point?📅 Update: October 2025
💡 Format: Educational analysis — not financial advice
Historical Context
Looking back at Bitcoin’s (BTC) price history, a clear pattern emerges: roughly every four years, the market experiences a major correction following a strong bullish cycle.
Key examples include:
2011
2013–2014
2018
2022
Each time, Bitcoin saw a drawdown of –75% to –93% from its previous highs. These deep retracements have historically marked the end of a growth phase and the beginning of a new accumulation cycle.
Current Elliott Wave Structure
According to Elliott Wave analysis, Bitcoin appears to have completed its third and fourth waves, while the fifth wave is currently unfolding.
However, the recent price action suggests that this fifth wave might already be nearing its conclusion.
The price remains within an upward channel, testing the trendline for the fourth time — a technical signal that often indicates weakening bullish momentum and a potential transition to a corrective phase.
Main Scenario: Possible Trend Reversal
For a confirmed shift in trend, Bitcoin would need to break below the channel’s lower boundary.
A typical technical sequence would look like this:
A breakdown below the trendline
A retest of the broken level from below
The beginning of a stronger downward move
This process usually unfolds over months, not days — a slow structural change rather than a sudden reversal.
Potential Downside Range
Based on historical patterns, a post-peak correction could bring Bitcoin into the $40,000–$30,000 range.
This is not a forecast, but rather an educational scenario grounded in the recurring market behavior seen in previous cycles.
Conclusion and Community Discussion
📊 At this stage, Bitcoin’s overall structure remains bullish, but signs of momentum exhaustion are becoming more apparent.
The key factor to watch is how price reacts to the main trendline — whether it holds as support or gives way to a deeper retracement.
❓Which scenario do you find more likely?
Continued growth and new highs
Or a corrective phase toward lower levels?
🗨 Share your thoughts and charts in the comments — let’s discuss it together.
🔔 Follow for more educational breakdowns, and suggest which tickers you’d like to see analyzed next.

BTC/USDT Analysis. Where to Next?
Hello everyone! This is CryptoRobotics trader-analyst, and here’s your daily market review.
Yesterday, Bitcoin followed the first scenario we highlighted earlier. Although the $108,000 zone didn’t immediately hold the price and we saw a short-term dip, selling pressure didn’t resume after the rebound, so we now consider it a solid support.
According to our previous outlook, we expect a move toward the strong resistance zone at $111,800–$113,000.
If the $108,000 area is retested — now extended to $108,700–$107,500 — we’ll be watching for a local long setup.
Currently, sellers are almost absent, which adds further confidence to this scenario.
Buy Zones:
$108,700–$107,500 (volume zone)
$105,600–$104,500 (volume anomalies)
$97,000–$93,000 (volume zone)
Sell Zones:
$111,800–$113,000 (strong volume anomalies)
$114,400–$115,600 (local volume zone)
$120,900–$124,000 (volume zone)
This publication is not financial advice.

Bitcoin Technical & Market Analysis $BTCCurrent Market Context
Bitcoin is trading around $109,090 as of October 23, 2025, demonstrating resilience after experiencing the largest liquidation event in cryptocurrency history on October 10. The market has entered a critical consolidation phase following a dramatic crash that saw BTC plunge from $126,255 to briefly touch $104,000, erasing over $500 billion in total crypto market capitalization within hours.
Technical Analysis Based on Chart Patterns
The attached chart reveals several critical technical indicators using the LuxAlgo indicator (for readers interested in replicating this analysis). The analysis shows:
Key Support Levels:
Immediate Support: $107,400-$108,000 zone (currently testing). This area has become increasingly fragile due to weakening institutional demand through ETF outflows.
Secondary Support: $106,200-$106,500 represents the next critical floor
Major Support: $103,500 marks the primary support level where buyers aggressively defended during the October 10 crash
Psychological Level: $100,000 remains the ultimate line in the sand
Key Resistance Levels:
Immediate Resistance: $111,250-$112,000 (short-term holder cost basis at $113,100)
Mid-term Resistance: $115,000-$117,000 pivot zone
Major Resistance: $122,000-$124,500 (previous all-time high region)
Moving Averages:
The chart demonstrates that Bitcoin is currently trading between the 200-day Simple Moving Average ($107,846) and the 365-day SMA ($100,367). This compression zone has historically led to extended consolidation periods lasting several months before a significant directional move emerges.
Fundamental Drivers & Market Sentiment
Extreme Fear Persists
The Crypto Fear & Greed Index has plummeted to between 22-28, indicating "Extreme Fear"—the lowest reading since April 2025. This sentiment has persisted for seven consecutive days, with the index dropping from 71 ("Greed") just days before the October 10 crash. Historically, such extreme fear readings have preceded significant market bottoms, with seven previous instances resulting in an average 22% rally within 15 days.
ETF Flows Show Institutional Hesitancy
U.S. spot Bitcoin ETFs recorded mixed flows this week, with significant outflows of $1.23 billion between October 13-17. While BlackRock's IBIT showed resilience with $73.6 million in inflows on October 22, overall institutional demand remains muted. Wednesday saw $101 million in outflows, suggesting institutions are adopting a wait-and-see approach. The inconsistent ETF activity has made the $107,000-$108,000 support zone "increasingly difficult to defend," according to Bitfinex analysts.
Geopolitical Pressures: Trump Tariffs
The catalyst for the October 10 liquidation event was President Trump's announcement of 100% tariffs on Chinese imports, escalating U.S.-China trade tensions. Trump has since threatened to increase tariffs to 155% if no deal is reached by November 1, adding continued pressure to risk assets. However, Trump is scheduled to meet with Chinese President Xi Jinping on October 31, creating a potential catalyst for sentiment reversal.
Long-Term Holder Distribution
On-chain data reveals that long-term Bitcoin holders have reduced their positions by 28,000 BTC since October 15, indicating continued distribution pressure. Daily selling by long-term holders has reached elevated levels at over 22,000 BTC per day (30-day average). Approximately 47% of this selling pressure comes from coins held between six months to one year, suggesting profit-taking from investors who accumulated during earlier 2025 dips.
Record Liquidations Create Cleaner Market Structure
The October 10 event saw $19-20 billion in leveraged positions liquidated within 24 hours, affecting over 1.6 million traders. This historic deleveraging has normalized futures open interest from the 95th percentile down to the 61st percentile, creating a healthier market structure with less downside risk from forced liquidations.
Price Outlook: 5-10 Day Forecast
Base Case Scenario (60% probability): Consolidation with downside bias toward $100,000-$105,000
Multiple analysts, including Standard Chartered's Geoffrey Kendrick, now consider a dip below $100,000 "inevitable" in the near term. Technical indicators support this view:
Bitcoin is trading below the short-term holder cost basis of $113,100
The formation of a potential "death cross" pattern suggests bearish momentum
Continued long-term holder distribution creates structural headwinds
Price prediction models suggest BTC could trade between $108,400-$116,764 over the next 5-10 days, though several analysts warn that weakness could persist into the $100,000-$103,000 range before finding a sustainable bottom.
Bullish Catalyst Scenario (30% probability): Recovery toward $115,000-$120,000
This outcome depends on several positive developments:
Friday's CPI data release (October 24) could provide directional clarity if inflation remains subdued
A breakthrough in U.S.-China trade negotiations at the October 31 summit could rapidly shift sentiment
Historical patterns suggest extreme fear readings often precede sharp recoveries
If Bitcoin can reclaim and hold above $111,250, it could trigger a rally toward the $115,000-$117,000 resistance zone within 5-10 days.
Bear Case Scenario (10% probability): Break below $100,000 toward mid-$90,000s
If the $107,000-$108,000 support fails convincingly and the $103,500 level breaks, Bitcoin could experience a deeper correction toward $93,000-$97,500. This scenario would likely require additional negative catalysts such as further tariff escalations or sustained ETF outflows.
Trading Considerations
Key Events to Monitor:
October 24: U.S. CPI data release (only major economic data unaffected by government shutdown)
October 31: Trump-Xi summit in Asia
November 1: Original deadline for 100% China tariff implementation
Technical Triggers:
A daily close above $111,250 would negate the bearish setup and suggest renewed upside momentum
A daily close below $106,500 would open the path to $103,500 and potentially $100,000
Watch for the interaction with the 200-day moving average at $107,846—sustained trading below this level typically signals extended weakness
Options Market Signals:
Bitcoin options open interest has reached all-time highs, now exceeding futures open interest by $40 billion—one of the widest gaps on record. This reflects increased hedging activity and market maturation, but also suggests potential for amplified intraday volatility.
Investment Strategy Recommendations
Given the current market structure, a cautious approach is warranted for the 5-10 day timeframe:
For Conservative Investors:
Wait for confirmation of support above $108,000 or look for accumulation opportunities if BTC dips toward $100,000-$103,000
Monitor Friday's CPI data and the Trump-Xi summit for potential catalysts
Consider dollar-cost averaging into positions rather than deploying full capital at current levels
For Active Traders:
The current range between $107,000-$112,000 offers tactical trading opportunities
Use tight stop losses given the elevated volatility environment
Be prepared for potential whipsaw movements around key economic releases
Institutional Perspective:
Spot buying continues despite futures weakness, with the Coinbase Premium Index showing steady accumulation. This suggests sophisticated investors view current levels as attractive for long-term positioning, even as short-term volatility persists.
Conclusion
Bitcoin is navigating a critical juncture following historic liquidations and extreme fear sentiment. The 5-10 day outlook suggests continued consolidation with a bias toward testing the $100,000 psychological level before establishing a sustainable bottom. However, key catalysts including CPI data and U.S.-China trade negotiations could rapidly shift the trajectory. The technical setup remains fragile below $108,000, but extreme fear readings and cleaned-out leverage positions suggest limited downside beyond $100,000 and potential for a sharp reversal once sentiment stabilizes.
The current environment favors patient accumulation over aggressive positioning, with the understanding that volatility will remain elevated until macro uncertainties resolve.

Bitcoin - Ultimate Swing Short As a compilation and summary of my previous ideas explaining in depth this signal - the why, when, how - here are the specific details for this swing short position.
Entry - 109,000 to 109,200
Stop Loss - 113,600
Target 1 - 97,600
Target 2 - 81,000
Target 3 - 63,400
Target 4 - 34,800
(Here is where I’ll potentially be signalling for a hedge long on Bitcoin from 34,700 to 80,000 - trading the retracement wave)
Target 5 - 20,000
Target 6 - 8,000
Ultimate wick bottom expected to be 7,200 to 7,800 range.
Good luck to all and any questions at all, please comment below.
I’ve linked any related ideas to this post here which you can view below.
- DD

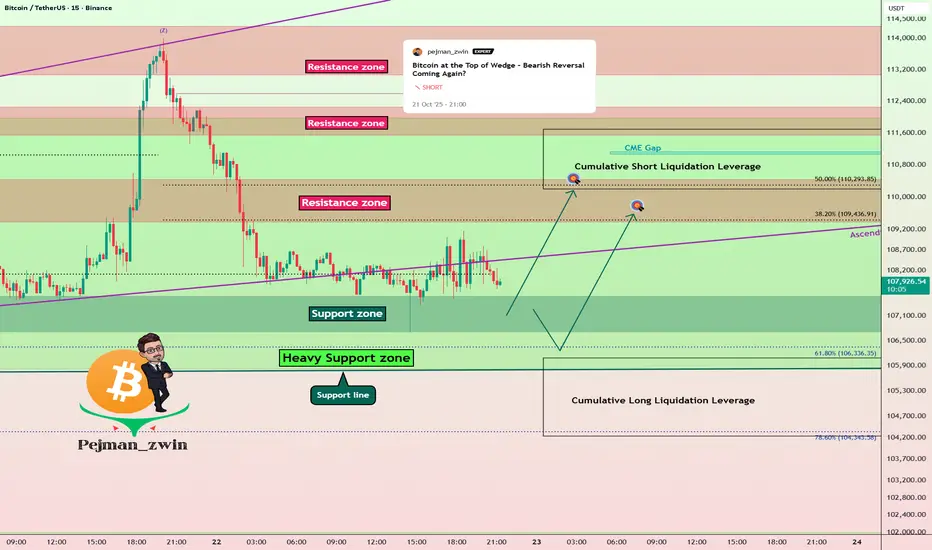
Bitcoin Short Term Setup – One More Push Before Fall?As I expected in yesterday’s idea , Bitcoin( BINANCE:BTCUSDT ) dropped down into the lower ranges of the Heavy Support zone($111,980-$105,820) .
Today, I want to share a quick 15-minute timeframe analysis with you.
Currently, Bitcoin is moving near that Support zone($107,580-$106,700) , but it hasn’t managed to break the lower line of the ascending broadening wedge pattern with strong momentum .
So I expect Bitcoin might at least make another move up to the Resistance zone($110,430-$109,380) . If BTC finds a Short Trigger near the Resistance zone and Cumulative Short Liquidation Leverage($111,687-$110,198) , it could drop sharply afterward, potentially breaking the Heavy Support zone eventually.
Cumulative Long Liquidation Leverage: $106,090-$104,234
Stop Loss(SL): $104,077
Please respect each other's ideas and express them politely if you agree or disagree.
Bitcoin Analysis (BTCUSDT), 15-minute time frame.
Be sure to follow the updated ideas.
Do not forget to put a Stop loss for your positions (For every position you want to open).
Please follow your strategy and updates; this is just my Idea, and I will gladly see your ideas in this post.
Please do not forget the ✅' like '✅ button 🙏😊 & Share it with your friends; thanks, and Trade safe.