BTC/USDT Analysis. Where to Next?
Hello everyone! This is CryptoRobotics trader-analyst, and here’s your daily market review.
Yesterday, Bitcoin followed the first scenario we highlighted earlier. Although the $108,000 zone didn’t immediately hold the price and we saw a short-term dip, selling pressure didn’t resume after the rebound, so we now consider it a solid support.
According to our previous outlook, we expect a move toward the strong resistance zone at $111,800–$113,000.
If the $108,000 area is retested — now extended to $108,700–$107,500 — we’ll be watching for a local long setup.
Currently, sellers are almost absent, which adds further confidence to this scenario.
Buy Zones:
$108,700–$107,500 (volume zone)
$105,600–$104,500 (volume anomalies)
$97,000–$93,000 (volume zone)
Sell Zones:
$111,800–$113,000 (strong volume anomalies)
$114,400–$115,600 (local volume zone)
$120,900–$124,000 (volume zone)
This publication is not financial advice.
Bitcoinprediction

Bitcoin Technical & Market Analysis $BTCCurrent Market Context
Bitcoin is trading around $109,090 as of October 23, 2025, demonstrating resilience after experiencing the largest liquidation event in cryptocurrency history on October 10. The market has entered a critical consolidation phase following a dramatic crash that saw BTC plunge from $126,255 to briefly touch $104,000, erasing over $500 billion in total crypto market capitalization within hours.
Technical Analysis Based on Chart Patterns
The attached chart reveals several critical technical indicators using the LuxAlgo indicator (for readers interested in replicating this analysis). The analysis shows:
Key Support Levels:
Immediate Support: $107,400-$108,000 zone (currently testing). This area has become increasingly fragile due to weakening institutional demand through ETF outflows.
Secondary Support: $106,200-$106,500 represents the next critical floor
Major Support: $103,500 marks the primary support level where buyers aggressively defended during the October 10 crash
Psychological Level: $100,000 remains the ultimate line in the sand
Key Resistance Levels:
Immediate Resistance: $111,250-$112,000 (short-term holder cost basis at $113,100)
Mid-term Resistance: $115,000-$117,000 pivot zone
Major Resistance: $122,000-$124,500 (previous all-time high region)
Moving Averages:
The chart demonstrates that Bitcoin is currently trading between the 200-day Simple Moving Average ($107,846) and the 365-day SMA ($100,367). This compression zone has historically led to extended consolidation periods lasting several months before a significant directional move emerges.
Fundamental Drivers & Market Sentiment
Extreme Fear Persists
The Crypto Fear & Greed Index has plummeted to between 22-28, indicating "Extreme Fear"—the lowest reading since April 2025. This sentiment has persisted for seven consecutive days, with the index dropping from 71 ("Greed") just days before the October 10 crash. Historically, such extreme fear readings have preceded significant market bottoms, with seven previous instances resulting in an average 22% rally within 15 days.
ETF Flows Show Institutional Hesitancy
U.S. spot Bitcoin ETFs recorded mixed flows this week, with significant outflows of $1.23 billion between October 13-17. While BlackRock's IBIT showed resilience with $73.6 million in inflows on October 22, overall institutional demand remains muted. Wednesday saw $101 million in outflows, suggesting institutions are adopting a wait-and-see approach. The inconsistent ETF activity has made the $107,000-$108,000 support zone "increasingly difficult to defend," according to Bitfinex analysts.
Geopolitical Pressures: Trump Tariffs
The catalyst for the October 10 liquidation event was President Trump's announcement of 100% tariffs on Chinese imports, escalating U.S.-China trade tensions. Trump has since threatened to increase tariffs to 155% if no deal is reached by November 1, adding continued pressure to risk assets. However, Trump is scheduled to meet with Chinese President Xi Jinping on October 31, creating a potential catalyst for sentiment reversal.
Long-Term Holder Distribution
On-chain data reveals that long-term Bitcoin holders have reduced their positions by 28,000 BTC since October 15, indicating continued distribution pressure. Daily selling by long-term holders has reached elevated levels at over 22,000 BTC per day (30-day average). Approximately 47% of this selling pressure comes from coins held between six months to one year, suggesting profit-taking from investors who accumulated during earlier 2025 dips.
Record Liquidations Create Cleaner Market Structure
The October 10 event saw $19-20 billion in leveraged positions liquidated within 24 hours, affecting over 1.6 million traders. This historic deleveraging has normalized futures open interest from the 95th percentile down to the 61st percentile, creating a healthier market structure with less downside risk from forced liquidations.
Price Outlook: 5-10 Day Forecast
Base Case Scenario (60% probability): Consolidation with downside bias toward $100,000-$105,000
Multiple analysts, including Standard Chartered's Geoffrey Kendrick, now consider a dip below $100,000 "inevitable" in the near term. Technical indicators support this view:
Bitcoin is trading below the short-term holder cost basis of $113,100
The formation of a potential "death cross" pattern suggests bearish momentum
Continued long-term holder distribution creates structural headwinds
Price prediction models suggest BTC could trade between $108,400-$116,764 over the next 5-10 days, though several analysts warn that weakness could persist into the $100,000-$103,000 range before finding a sustainable bottom.
Bullish Catalyst Scenario (30% probability): Recovery toward $115,000-$120,000
This outcome depends on several positive developments:
Friday's CPI data release (October 24) could provide directional clarity if inflation remains subdued
A breakthrough in U.S.-China trade negotiations at the October 31 summit could rapidly shift sentiment
Historical patterns suggest extreme fear readings often precede sharp recoveries
If Bitcoin can reclaim and hold above $111,250, it could trigger a rally toward the $115,000-$117,000 resistance zone within 5-10 days.
Bear Case Scenario (10% probability): Break below $100,000 toward mid-$90,000s
If the $107,000-$108,000 support fails convincingly and the $103,500 level breaks, Bitcoin could experience a deeper correction toward $93,000-$97,500. This scenario would likely require additional negative catalysts such as further tariff escalations or sustained ETF outflows.
Trading Considerations
Key Events to Monitor:
October 24: U.S. CPI data release (only major economic data unaffected by government shutdown)
October 31: Trump-Xi summit in Asia
November 1: Original deadline for 100% China tariff implementation
Technical Triggers:
A daily close above $111,250 would negate the bearish setup and suggest renewed upside momentum
A daily close below $106,500 would open the path to $103,500 and potentially $100,000
Watch for the interaction with the 200-day moving average at $107,846—sustained trading below this level typically signals extended weakness
Options Market Signals:
Bitcoin options open interest has reached all-time highs, now exceeding futures open interest by $40 billion—one of the widest gaps on record. This reflects increased hedging activity and market maturation, but also suggests potential for amplified intraday volatility.
Investment Strategy Recommendations
Given the current market structure, a cautious approach is warranted for the 5-10 day timeframe:
For Conservative Investors:
Wait for confirmation of support above $108,000 or look for accumulation opportunities if BTC dips toward $100,000-$103,000
Monitor Friday's CPI data and the Trump-Xi summit for potential catalysts
Consider dollar-cost averaging into positions rather than deploying full capital at current levels
For Active Traders:
The current range between $107,000-$112,000 offers tactical trading opportunities
Use tight stop losses given the elevated volatility environment
Be prepared for potential whipsaw movements around key economic releases
Institutional Perspective:
Spot buying continues despite futures weakness, with the Coinbase Premium Index showing steady accumulation. This suggests sophisticated investors view current levels as attractive for long-term positioning, even as short-term volatility persists.
Conclusion
Bitcoin is navigating a critical juncture following historic liquidations and extreme fear sentiment. The 5-10 day outlook suggests continued consolidation with a bias toward testing the $100,000 psychological level before establishing a sustainable bottom. However, key catalysts including CPI data and U.S.-China trade negotiations could rapidly shift the trajectory. The technical setup remains fragile below $108,000, but extreme fear readings and cleaned-out leverage positions suggest limited downside beyond $100,000 and potential for a sharp reversal once sentiment stabilizes.
The current environment favors patient accumulation over aggressive positioning, with the understanding that volatility will remain elevated until macro uncertainties resolve.

Bitcoin - Ultimate Swing Short As a compilation and summary of my previous ideas explaining in depth this signal - the why, when, how - here are the specific details for this swing short position.
Entry - 109,000 to 109,200
Stop Loss - 113,600
Target 1 - 97,600
Target 2 - 81,000
Target 3 - 63,400
Target 4 - 34,800
(Here is where I’ll potentially be signalling for a hedge long on Bitcoin from 34,700 to 80,000 - trading the retracement wave)
Target 5 - 20,000
Target 6 - 8,000
Ultimate wick bottom expected to be 7,200 to 7,800 range.
Good luck to all and any questions at all, please comment below.
I’ve linked any related ideas to this post here which you can view below.
- DD

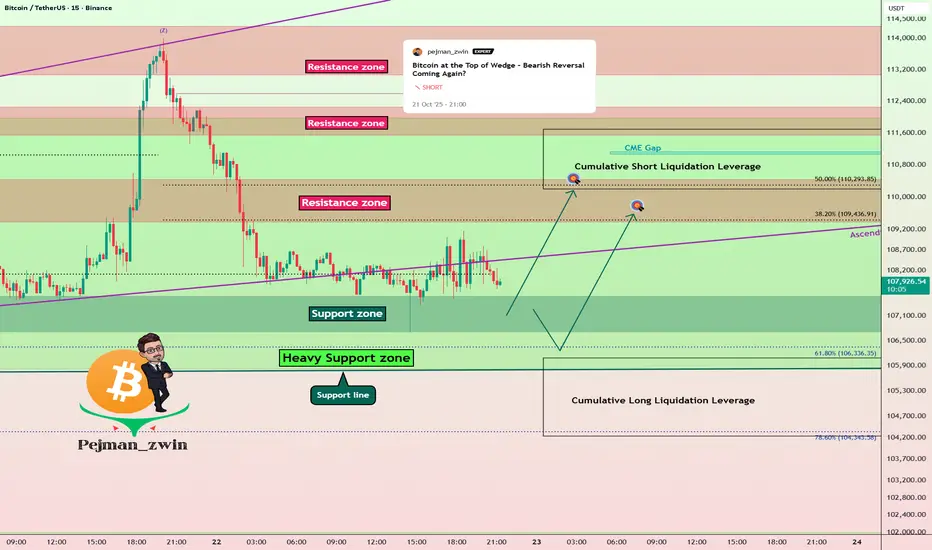
Bitcoin Short Term Setup – One More Push Before Fall?As I expected in yesterday’s idea , Bitcoin( BINANCE:BTCUSDT ) dropped down into the lower ranges of the Heavy Support zone($111,980-$105,820) .
Today, I want to share a quick 15-minute timeframe analysis with you.
Currently, Bitcoin is moving near that Support zone($107,580-$106,700) , but it hasn’t managed to break the lower line of the ascending broadening wedge pattern with strong momentum .
So I expect Bitcoin might at least make another move up to the Resistance zone($110,430-$109,380) . If BTC finds a Short Trigger near the Resistance zone and Cumulative Short Liquidation Leverage($111,687-$110,198) , it could drop sharply afterward, potentially breaking the Heavy Support zone eventually.
Cumulative Long Liquidation Leverage: $106,090-$104,234
Stop Loss(SL): $104,077
Please respect each other's ideas and express them politely if you agree or disagree.
Bitcoin Analysis (BTCUSDT), 15-minute time frame.
Be sure to follow the updated ideas.
Do not forget to put a Stop loss for your positions (For every position you want to open).
Please follow your strategy and updates; this is just my Idea, and I will gladly see your ideas in this post.
Please do not forget the ✅' like '✅ button 🙏😊 & Share it with your friends; thanks, and Trade safe.
Bitcoin at the Top of Wedge – Bearish Reversal Coming Again?As I expected in yesterday’s idea , Bitcoin dropped to the $107,800 level, hitting its target .
In the last few hours, BTC started to pump again and is now trading near a cluster of resistances : the 100_SMA(Daily) , the 50_SMA(Daily) , and Cumulative Short Liquidation($117,517-$116,020) . This creates a strong resistance , and I don’t think Bitcoin will easily break through it. ( As of the time of writing, there’s no fresh news influencing the market .)
From an Elliott Wave perspective, it looks like Bitcoin is forming a Triple Three Correction(WXYXZ ).
On the Classical Technical side, Bitcoin is at the top of an ascending broadening wedge pattern , which is a reversal pattern . There’s also a Regular Bearish Divergence (RD-) between the two peaks in this pattern.
I expect that in the coming hours, Bitcoin will start to drop again. After breaking the important $111,000 level , it could fall at least to the lower line of the ascending broadening wedge .
Note: In these past few days, the Bitcoin and crypto market have been quite volatile and driven by news, especially related to US-China tensions. So always manage your risk carefully and avoid impulsive decisions based on sudden headlines.
New CME Gap: $107,690-$107,220
Cumulative Long Liquidation: $107,105-$104,297
Cumulative Short Liquidation: $115,241-$113,454
Stop Loss(SL): $116,200
Please respect each other's ideas and express them politely if you agree or disagree.
Bitcoin Analysis (BTCUSDT), 1-hour time frame.
Be sure to follow the updated ideas.
Do not forget to put a Stop loss for your positions (For every position you want to open).
Please follow your strategy and updates; this is just my Idea, and I will gladly see your ideas in this post.
Please do not forget the ✅' like '✅ button 🙏😊 & Share it with your friends; thanks, and Trade safe.

BITCOIN SIGNAL: NEXT MASSIVE MOVE IN THIS DIRECTION IS FORMING!!Yello Paradisers, I hope you are doing fine. This is a video for you. Enjoy. I hope you are enjoying it. Smash the rocket button if you want. I will see you again next time. You can also share this video. I will be retweeting everybody who gonna mention me and TradingView.
And Paradisers! Keep in mind to trade only with a proper professional trading strategy. Wait for confirmations. Play with tactics. This is the only way you can be long-term profitable.
Remember, don’t trade without confirmations. Wait for them before creating a trade. Be disciplined, patient, and emotionally controlled. Only trade the highest probability setups with the greatest risk to reward ratio. This will ensure that you become a long-term profitable professional trader.
Don't be a gambler. Don't try to get rich quick. Make sure that your trading is professionally based on proper strategies and trade tactics.

BITCOIN - Clear bearish sign!Bitcoin is currently forming a clear corrective pattern — a rising wedge that has broken downward, retested the breakdown, and is now continuing a gradual decline.
This correction is expected to bottom around the $85K level, after which Bitcoin will likely enter a consolidation phase, form new structures, and we’ll keep updating the outlook as new developments occur.
Also, note that the EMA 25 just crossed below the EMA 50, forming a death cross — a bearish signal.
You can consider entering a short position from here, but keep your leverage low and wait for a slight pullback before entering the trade.
Many people won’t like what I’m saying — they’ll tell you “Bitcoin is heading to $200K!” — but that’s just the nature of the market. Everyone sees what they want to see.
Corrections, retracements, and emotional reactions are all part of the cycle. The smart ones are those who read the structure, not the hype.
Best Regards:
Ceciliones🎯

BTC/USDT Analysis. Pump and Dump Amid Gold Selloff
Hello everyone! This is CryptoRobotics trader-analyst with the daily market overview.
Yesterday, following a massive gold selloff, volatility on Bitcoin spiked sharply. The price made an explosive move upward with no resistance in the $110,700–$111,500 zone.
However, once above that range, a strong selling anomaly appeared between $111,800–$113,000, triggering a retracement back to initial levels.
At the moment, support at $107,300–$106,300 (accumulated volumes) has been tested, while local volume anomalies appeared slightly higher.
Currently, Bitcoin is attempting to consolidate above $108,000 — holding this level may lead to a short-term bounce, but upon reaching $111,800–$113,000, there is roughly a 90% chance of renewed selling pressure.
Overall, the market structure remains weak for buyers, and within the next week, a test of the stronger support area near $105,600–$104,500 (volume anomalies) looks likely.
Buy Zones:
~$108,000 (local volume anomalies, potential support)
$105,600–$104,500 (volume anomalies)
$97,000–$93,000 (volume zone)
Sell Zones:
$111,800–$113,000 (strong volume anomalies)
$114,400–$115,600 (local volume zone)
$120,900–$124,000 (volume zone)
This publication is for analytical purposes only and does not constitute financial advice.

Bitcoin AMD for London Session - LONG We are currently observing a typical Accumulation-Manipulation-Distribution (AMD) entry model to support a bullish bias for Bitcoin in the upcoming hours (London Session).
At present, price action appears to be in an accumulation phase. We anticipate a potential liquidity sweep of a key swing low , specifically, the previous day’s low (PDL), which aligns with a Point of Interest (POI): an unmitigated H1 order block.
Sell-side liquidity from the previously established dealing range has already been swept, indicating that a manipulation phase may be underway.
Based on this structure, we can reasonably expect a price movement toward the 0.618 Fibonacci retracement level of the prior range.

$BTC about to collapse?Hey traders,
I Hope you are doing good!
As a continuation of my last CRYPTOCAP:BTC analysis ( ) I bring you a new fresh Bitcoin scenario.
In this case, my thoughts have changed. In my opinion what we saw last Friday was just the beginning of an early bearish movement.
The price tried to rebound and show some strenght but it failed and is falling to new lows.
Of course, momentum changes so fast and my setup could be invalid if we head to 116.000 USD and close above this week. However, in my opinion thats not likely to happen.
Im not talking about a short bearish movement but an actual 3 -6 months bear market.
My targets? Hard to say. But I see some interesting zones at 60 - 80K where I will start to buy some Bitcoin.
This scenario obviously applies to SP500 and Nasdaq.

BTC/USDT Analysis. Is There Potential for Growth?
Hello everyone! This is your trader-analyst from CryptoRobotics, and here’s the daily market analysis.
Yesterday, as expected, after reaching the $110,000–$113,000 (accumulated volume) zone, Bitcoin showed a reaction and moved downward. Just before reaching the $107,300–$106,300 (accumulated volume) support zone, trading volume increased, and buyers are now attempting to regain control.
Currently, the structure suggests a balance forming within the $107,400–$111,700 range. A breakout above the $110,700–$111,500 local resistance could open the path toward $120,000.
Based on this, we expect continued rotation within the range, with a bullish breakout as the main scenario.
Buy Zones:
• $107,300–$106,300 (accumulated volumes)
• $105,600–$104,500 (volume anomalies)
• $97,000–$93,000 (major volume zone)
Sell Zones:
• $110,700–$111,500 (local sell zone)
• $114,400–$115,600 (local volume zone)
• $120,900–$124,000 (major volume zone)
This publication is not financial advice.

BTC - Don’t Rule Out this PossibilityPer my “Ultimate Swing Short Setup” analysis, the bulk of this plan and idea is due to Bitcoin situating itself underneath this major trendline.
Although I’m predicting corrective wave structures to take us here - I’m also of the opinion that it’s entirely possible we see a flash crash / wick straight to 7,400 to 10,000 zone.
How would this be possible?
For over 3 years bitcoin has been moving in a slow upwards consolidation. This price movement attracts and accumulates long position stop loss orders / sell orders. Orders that only fill when price crosses down the level.
Technically and mechanically speaking, it’s entirely possible we stop straight to sub 10,000 in a fast movement.
No bear market required - just a straight up flash crash ending in a wick to 8,000.
See my related linked ideas below.
Be careful and good luck.
- Dick Dandy

BUY BITCOIN BTCUSD - Low risk high rewardBitcoin experienced a big drop to the downside but it nows has clear signs of bullish movement ahead. There is currently a head and shoulders pattern forming which has given us high confidence that it will head to the upside. BUY NOW!

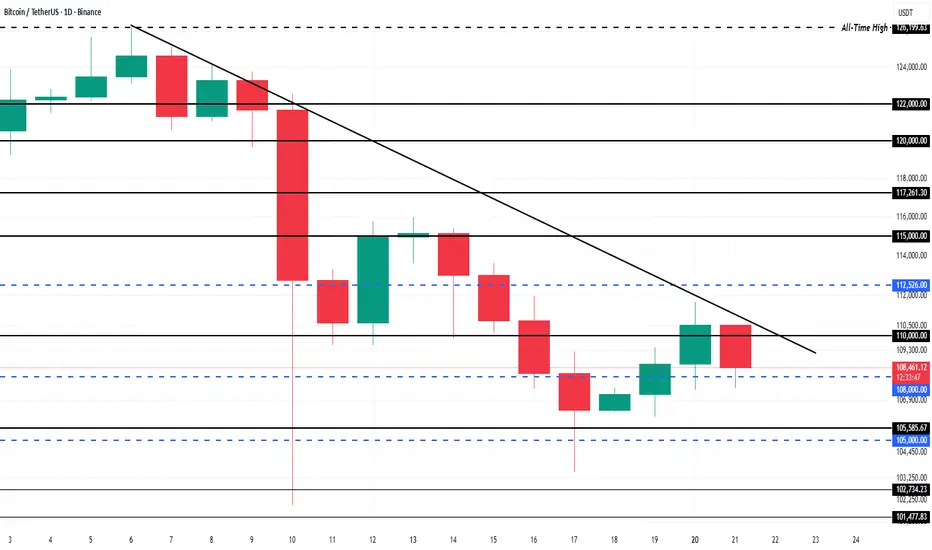
Bitcoin Nears Capitulation As Price Fails To Breach DowntrendAt the time of writing, Bitcoin trades at $107,734, holding below the $108,000 resistance. The crypto giant has repeatedly failed to break the two-week downtrend line, signaling weakening momentum and growing skepticism among investors.
The formation of lower lows this week is concerning. If Bitcoin cannot reclaim the $110,000 psychological level, the price could slip further toward $105,000 or even lower, amplifying selling pressure. Sustained bearishness could accelerate this move, pushing BTC into deeper correction territory.
However, if Bitcoin manages to regain $110,000 as support, the technical outlook could improve sharply. This would invalidate the downtrend and open the door to a move toward $112,500 and possibly higher. In that case, short-term recovery would be back on the table, but for now, caution remains the dominant theme across the Bitcoin market.
BTCUSD: Option A or B?Plan for today. 2 options for BTCUSD.
A: Break and close above 1 to go bullish.
B: Break and close below 2 to go bearish.
Option B is preferred with high timeline bearish view. However Option A is still a possibility with low probability.

BTC Next Target $113K–$116K?If CRYPTOCAP:BTC holds above the $109,000 – $110,000 range, we’re likely to see a bullish continuation toward the $113,000 – $116,000 zones in the coming days.

BTC 2026 Outlook - Roadmap Speculation to $300KHello BTC Watchers.
Let's talk about BTC in the Logarithmic view.
I mapped out the date-ranges, as well as how far the price fell logarithmically after each top. You'll see the word "lines" on the chart. This simply indicates the amount of diagonal trendlines it has fallen. By using this pattern-dedicated approach, a commonality is found which may be useful in speculating a future price. Because if not for past history, how else would we speculate on the future?
It's interesting to note that the past 3 ATH's (all time high's) are each lower than the previous if you compare it not to price but to the "lines". Even the fifth high (the one coming next) will be on a lower click-line than the previous, and that estimate is already over 300k. This is a really helpful way to speculate a future high because usually on a regular-view chart, the zone above the ATH is uncharted territory. You could use a Fibonacci trend-based extension, but this is limited to the cycle that you're using for input points. Logarithmic chart + indicators factor in the entire history of the price.
This would mean the new peak could be in 2026 around USD 300k.
It's important to note that this ay not be a straight line up. As you'll see, although the price has been increasing exponentially, there have been periods of hard pullbacks or corrections. These are great times to enter the market, NOT when the price is close to the peak of the curve (in green).
So could it be that this is just another dip in the road towards a new ATH - despite the recent market liquidation?

Analytics: Market outlook and forecasts
📈 WHAT HAPPENED?
Last week, Bitcoin experienced another wave of decline, but didn’t reach the low of the previous dump. On Friday, there was a volume anomaly at $105,000, after which a correction was expected to $108,000. As a result, we got into a sideways movement at these values, and the seller's activity didn’t resume.
💼 WHAT WILL HAPPEN: OR NOT?
On the hourly timeframe, a trend reversal to the upside has been recorded. We’re currently testing a significant volume sales zone, and the slowdown in price movement (price action) indicates a likely correction. Our future tactics will depend on the dynamics of this correction: whether to join the longs or stay on the sidelines.
Two support zones have formed below the current price, and if there is a reaction, testing these zones will serve as a buy signal. If the situation unfolds favorably, the $116,000 level may be tested this week. If the buyer doesn’t show any activity, the priority scenario shifts towards sales, and we expect a decline to the level of $97,000.
Buy Zones:
• $107,300–$106,300 (accumulated volumes)
• $105,600–$104,500 (volume anomalies)
• $97,000–$93,000 (major volume zone)
Sell Zones:
• $110,000–$113,000 (accumulated volumes)
• $114,400–$115,600 (local volume zone)
• $120,900–$124,000 (major volume zone)
📰 IMPORTANT DATES
This week, we’re following these macroeconomic events:
• October 22, Wednesday, 6:00 (UTC) — publication of the UK Consumer Price Index for September;
• October 23, Thursday, 12:30 (UTC) — publication of the number of initial jobless claims in the United States;
• October 23, Thursday, 14:00 (UTC) — publication of data on U.S. home sales for September;
• October 24, Friday, 12:30 (UTC) — publication of the US Consumer Price Index for September;
• October 24, Friday, 13:45 (UTC) — publication of the US Service and Manufacturing Business Activity Index for October;
• October 24, Friday, 14:00 (UTC) — publication of US new home sales data for September.
*This post is not a financial recommendation. Make decisions based on your own experience.
#analytics

BUY BITCOIN - BTC/USD- Amazing low risk high reward trade!Based on our deep analysis we can see that BITCOIN (BTC/USD) will head to the upside. Great time to BUY - it has broken POWERFUL resistance levels and is also being held by powerful support levels which it can't break through. Target is next resistance level - buy now!

BTCUSD – Three Drives Pattern + RSI DivergenceHi Teams!
Bitcoin has recently completed a three-drive pattern while also showing a clear bearish divergence on the RSI. This confluence has led to a strong rejection from the third drive area, confirming short-term weakness.
The three-drive trendline was broken last night, signaling that the bullish momentum has temporarily cooled down. However, as long as $97,900 remains unbroken, the bullish structure can still hold.
Here’s the current plan:
Key support zone: $108,600; this looks like a good potential long entry area if the price stabilizes and shows confirmation.
Upside target: around $118,045, which also aligns with the previous swing high.
Invalidation: if the price breaks below $97,900, the setup turns bearish, and we can expect deeper retracements toward the $86,500–$88,000 region.
In short, BTC is at a critical decision point, holding above $97,900 keeps the bullish structure intact, but a breakdown below that level could shift the market sentiment sharply bearish.
Disclaimer: As part of ThinkMarkets’ Influencer Program, I am sponsored to share and publish their charts in my analysis.

LTCUSD Next Target for Bulls RevealedLTCUSD 4H Chart
The correction has already ended at 100.25 . We expect a small retracement before the trend continues. Upon closer examination, this correction appears to be subwave C of wave (4). For now, watch the 119 level for a potential bullish breakout.
LTCUSD Targets: 122 , 127 , and 132 .
Wave (4) has already reached the 0.382 Fibonacci retracement level, which may act as support near the upper boundary and serve as a possible reversal point.
Stay tuned!
@Money_Dictators
Thank you :)

Bitcoin Can reach 93000 Bitcoin could reach the price level of $93,000 in the coming weeks.
There is a possibility that after breaking the midline of its long-term weekly channel, it may move up to the indicated FVG level to fill the remaining unfilled orders.
After that, it could start a new bullish rally aiming for the upper boundary of the channel.
This is purely an analysis and should not be considered as financial advice.
Buying or selling is at the trader’s own risk.

SELL BITCOIN Btc/Usd - Amazing low risk high reward trade!Based on our deep analysis we can see that BTC/USD Bitcoin will head to the downside. Great time to buy - it has broken major support levels + trends.
