BTC to 70kThis is my idea on $BINANCE:BTCUSDT. We all know BINANCE:BTCUSDT hit all time high reached 70k in 2021. In 2024 we all witnessed BITSTAMP:BTCUSD able to break all time high reached new high which is 126k. Was there any consolidation after breaking high 70k? yes there was but BITSTAMP:BTCUSD never able to check 70k from above, you can say there is a gap BITSTAMP:BTCUSD must come to fill. There are few minor support zones which may able to hold BITSTAMP:BTCUSD but I wouldn't trust those areas which is around 100k, 86.5k, 75k. If BINANCE:BTCUSDT ever reach 75k-70k that means BTC is ready to make higher high. In worst case scenario we might see 65k 60k 50k, which may caused by Trump speaking or any other major news related to USD.
Bitcoinprediction

Buy Bitcoin 106500Bullish, tp 130k.
Bitcoin is testing a key resistance near 108,000. A breakout above this level could trigger a strong bullish continuation. Watching for a clean close above resistance to confirm the move toward higher targets.
Good luck!

Winter is coming!Hey Guys,
As you know Bitcoin can't pump forever and will eventually take a break for a while and it seems to me that every 4 years starting from October 3 months candle it does exactly the same thing.
Now keep in mind that this drop might happen between now and December so expect price volatility soon.
I have another prediction for altcoins drop which I will try to post as soon as possible but in the mean time we must be prepared for this scenario!
And I would appreciate your thoughts about my idea so please feel free to write a comment and let me know what you guys think.

Bitcoin BTC - Market AnalysisWhile my broader bias on Bitcoin (BTC) remains bearish, I hold a short-term bullish outlook leading into the New York (NY) session open. This perspective is based on several key technical observations:
I anticipate potential price manipulation during the NY session that may drive BTC toward the 0.618–0.786 Fibonacci retracement levels. This zone also coincides with a significant market structure shift (MSS) key level, making it a potential area of interest for short positions.
Notably, we have already seen strong rejection from the 0.5 equilibrium level within the current Fibonacci range, suggesting sustained selling pressure from market participants.
Furthermore, there appears to be limited liquidity buildup on the buy side, indicating a lack of engineered liquidity or compelling draw for a continued move higher compared to the liquidity we have on the sellside.
Given these factors, I plan to position myself for a potential short trade, capitalizing on any bullish manipulation that drives price into the aforementioned sell zone.

BTC/USDT Analysis. Strong Short
Hello everyone! This is the trader-analyst from CryptoRobotics, and here’s the daily analysis.
Yesterday, Bitcoin broke through a key level we mentioned earlier. Although this scenario was not the primary one, buyers were completely absent, allowing sellers to take full control.
Since yesterday, Bitcoin has dropped by around 6%. The decline could potentially extend to $97,000, where strong support is located.
Locally, we’re seeing a volume anomaly around the current levels.
If buyers defend the $105,000 area, we could see a bounce toward $108,000.
If not, the next downside target remains $100,000.
Buy Zones:
• $97,000–$93,000 (major volume cluster).
Sell Zones:
• $108,000 (volume anomaly),
• $110,000–$113,000 (accumulated volume),
• $114,400–$115,600 (local volume zone),
• $120,900–$124,000 (major volume zone).
This publication does not constitute financial advice.

BTC Short Update - Prepare for Wicks to these LevelsAn update on my ultimate swing short trade:
There’s a good possibility this swing will be the speed of a scalp trade, at least the first drop to 35,000
Prepare for wicks to the following lows:
Wick 1 - 34,700-35,000 bottom
Retrace Up to 77,500, reject at 77,500
Wick 2 - 7,250 to 9,000 range
Happy trading and thanks for following my ideas.
- DD

BTCUSD; Heikin Ashi Trade IdeaLast time we had big divergence on MACD and weekly TF, we had big correction...

Bitcoin Bearish Continuation from Daily FVGa bearish continuation setup on Bitcoin (BTC/USD) in the daily timeframe.
After a sharp rejection from the Daily Fair Value Gap (FVG) zone between roughly $114,000–$120,000, price shows strong bearish momentum. The large red candle indicates sellers’ dominance, and the marked downward arrow projects a potential move toward lower support zones around $108,000 and $105,000, which act as the next liquidity levels or demand areas.

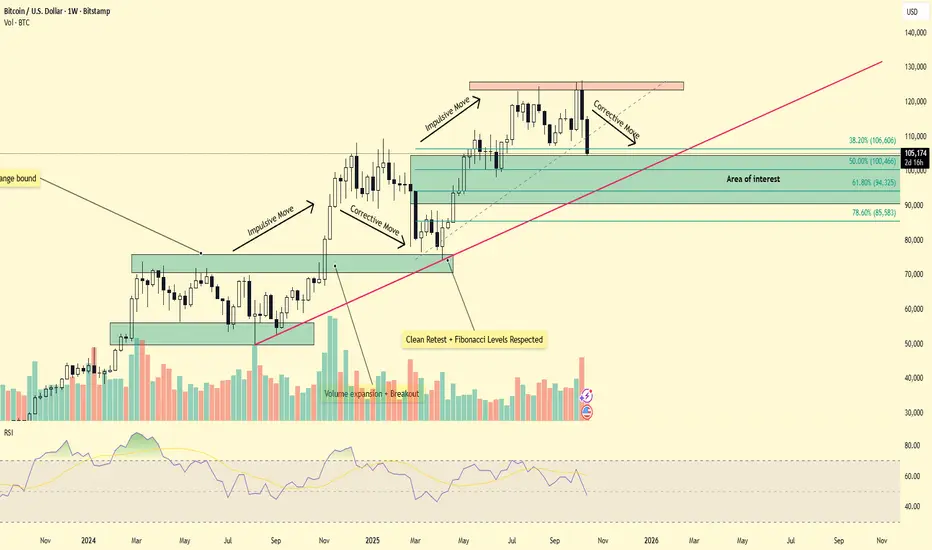
From Euphoria to Correction — Is BTC Setting Up for a Deeper PulIn my previous published idea, I mentioned that BTC was due for a corrective phase following an extended period of bullish momentum to the upside. That projection appears to be unfolding, as Bitcoin’s recent uptrend has started to cool off after several euphoric weeks of gains.
The weekly chart now shows price consolidating below the highs, indicating reduced buying pressure and potential exhaustion at elevated levels.
A weekly close below the 38.2% Fibonacci retracement level (≈106,000) could open the door for a deeper pullback toward the 50% retracement zone around 100,530, an area that previously acted as a strong demand zone and launch point for the last rally.
If the correction extends further, the 61.8% retracement level near 94,000 becomes the next key structural support — aligning closely with the ascending trendline that has guided BTC’s broader move.
Overall, Bitcoin remains within a macro bullish structure, but sustained weakness below the 100K region could mark the early signs of trend exhaustion and a potential sentiment shift.
Bitcoin at Heavy Supports – Time to Go Long?As I expected in my previous idea , Bitcoin ( BINANCE:BTCUSDT ) completed both its bullish and bearish moves and hit its Long and Short targets .
Bitcoin can still see some upside as long as it holds this Heavy Support zone($111,980-$105,820) . However, given the recent momentum and the wick down to around $102K a few days ago, any further rally depends on breaking the Resistance zone($118,750-$115,730) and touching around $117,220 , which is the high of that significant bearish candle .
Currently, Bitcoin is sitting in a Heavy Support zone($111,980-$105,820) near the 200_SMA(Daily) and a Cumulative Long Liquidation($108,415-$107,156) . It's basically hovering between key weekly support lines, so this is a pretty strong supports .
In terms of Elliott Wave theory , it looks like Bitcoin is still completing its wave 4 . This wave 4 might have formed a Double Three Correction(WXY) , and now we can expect a potential upward move .
I expect that in the next few hours, Bitcoin may start a short-term bullish move up to around $115,000 or to the Cumulative Short Liquidation Leverage($114,973-$113,435) .
Note: Overall, it's better to look for Long positions right now, considering Bitcoin's position. But if it breaks the 200_SMA(Daily) and the Heavy Support zone($111,980-$105,820), we could see a broader crypto market drop.
Note: Around the $108,000 level, we have huge buy orders stacked up, which might act as a significant support zone.
Please respect each other's ideas and express them politely if you agree or disagree.
Bitcoin Analysis (BTCUSDT), 4-hour time frame.
Be sure to follow the updated ideas.
Do not forget to put a Stop loss for your positions (For every position you want to open).
Please follow your strategy and updates; this is just my Idea, and I will gladly see your ideas in this post.
Please do not forget the ✅' like '✅ button 🙏😊 & Share it with your friends; thanks, and Trade safe.

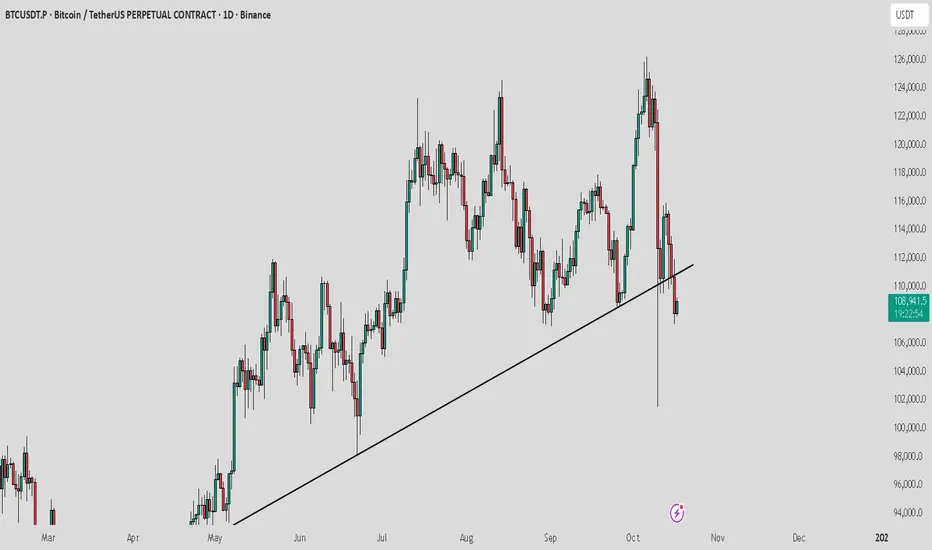
Bitcoin at Make or Break level : $118K or $102k next ? Bitcoin has broken down from trend line support and is now moving to retest that zone. Some consolidation near this area is likely.
Bullish scenario: If buyers dominate and BTC reclaims the support, we could see a move towards $118,000.
Bearish scenario: If sellers maintain control, a drop towards $102,000 – $100,000 is possible.
Manage risk carefully, avoid high leverage, and stay patient during consolidation.
104,750 inevitable at this point? What next?Zooming way out, this current price activity is not unusual.
But the question we're all interested in knowing the answer to is whether this the final capitulation before a bear market rally that will then mark the beginning of a much-bigger downside move?
Until we break lower than 104,750 I'd have to say we are still within an upward trend that will then see another ATH. However, if Bitcoin attempts to recover and then Gold/Silver sells-off, Bitcoin will go with the correction and that could mark the completion of our bull market.

$BINANCE:BTCUSDT BINANCE:BTCUSDT
30min hollows
After a spectacular price drop of 16% - 17% over 8 hours on 30 minutes timeframe chart...
We can say that a downward parallel channel has been formed, from which since the price came out of the channel, this signaled the beginning of the consolidation phase, that is the stabilization of the price.
The stabilization rate ranges between 4%.
So using the Fibonacci retracement sequence, we can see the Support and Resistance areas forming.
So there is this condition:
If the price is within the support point and breaks it downwards, this means that the market trend will be downward.
Respectively, if the price enters the resistance point and then breaks it, we can say that we have an upward market trend.
and then the resistance point will become the support point.
Good Luck
#CryptoHellas team

Bitcoin (BTC/USD) Bearish Continuation After Liquidity GrabThe BTC/USD daily chart shows a bearish structure forming after a sharp rejection from the upper resistance area near $116,000–$117,000. The large red candle at the top indicates a strong liquidity sweep, where price briefly moved higher to collect buy-side liquidity before reversing downward.
Following this, a series of smaller candles suggest consolidation under the resistance zone, with a clear lower-high formation, signaling potential continuation to the downside. The blue-shaded box represents a premium zone (supply area) where sellers are expected to remain dominant.
The projected black arrow path on the chart shows an anticipated pullback toward the mid-level ($112,000–$113,000) before continuation of the bearish move targeting the $108,000–$109,000 zone — a potential demand or support area.
Summary:
Trend: Bearish continuation
Key resistance: $115,000–$117,000
Short-term pullback: $112,000–$113,000
Target zone: $108,000–$109,000
Market sentiment: Bearish after liquidity grab and lower-high formation

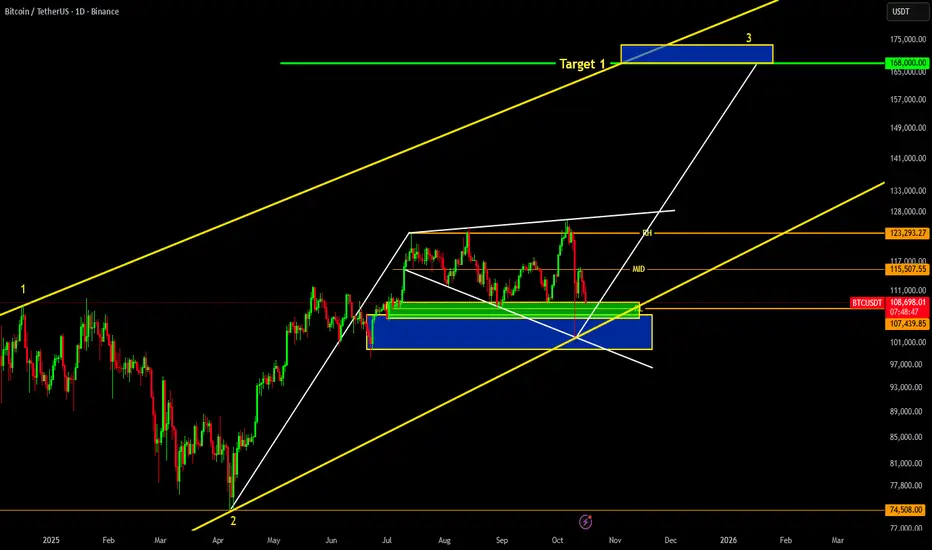
BTC IS ABOUT TO EXPLODE UPTO 168K!!!! BUY THE DIP ASAPThis is the only CRYPTOCAP:BTC chart you need to see. As we can see a proper expanding triangle is formed on major time frame, and this directly targets #btc to 168k. BUY THE DIP ASAP!!!
Bitcoin – Bearish Setup / 4H
📉 ***
Price is forming a clear lower high pattern with multiple rejections from the same resistance area.
The market is showing weakness and testing the support zone around **110,000 – 112,000**.
If this support breaks, we could see a deeper move down toward the next demand zone near **104,000 – 105,000**.
🎯 **Targets:**
1. 108,000
2. 106,000
3. 104,000
🛑 **Stop Loss:** clear close above **114,500**
I expect further downside movement based on market structure and repeated rejection from the resistance level.
📘 *This analysis is based on personal market study – DYOR / Not financial advice.*

BTC/USDT Analysis. Inside the Range
Hello everyone! This is the trader-analyst from CryptoRobotics, and here’s the daily analysis.
Yesterday, unfortunately, buyers failed to regain market activity, and today we’ve once again moved down to the lower boundary of the range. After a false breakout of the local low, the price bounced back and tested a small demand zone at $112,000–$113,000 formed yesterday.
The cumulative delta continues to decline, showing ineffective buying pressure.
On the other hand, the price is being squeezed tightly toward the $109,500 low, suggesting a possible liquidity sweep soon. In case of a false breakout, the move could extend up to $115,000.
However, if we see a clear breakout and consolidation below, the scenario shifts toward short positions.
Buy Zones:
• $109,500 (false breakout level),
• $97,000–$93,000 (volume cluster).
Sell Zones:
• $112,000–$113,000 (local volume zone),
• $114,400–$115,600 (local volume zone),
• $120,900–$124,000 (major volume zone).
This publication does not constitute financial advice.

What Bitcoin Options on CME Are Whispering Right Now
A quick look at the flow — and it’s clear:
the market is pricing in a move toward $145K–$150K.
But here’s the nuance:
nearly all these call spreads come with a hedge — a short futures leg added right away.
This isn’t pure bullish speculation.
It’s a structured play.
🔍 The Logic Behind It:
Primary goal: Profit from upside as BTC rallies.
But also prepared for downside:
These portfolios assume a potential drop to $103K, and in some cases even $101K — which are the break-even points of the structures.
At those levels:
The short futures can be bought back for profit (closing the hedge)
Or the entire position can be closed out entirely, if sentiment shifts dramatically
In other words — they’re bullish, but not blind.
They want exposure to upside…
while keeping an exit ramp ready if things go south.

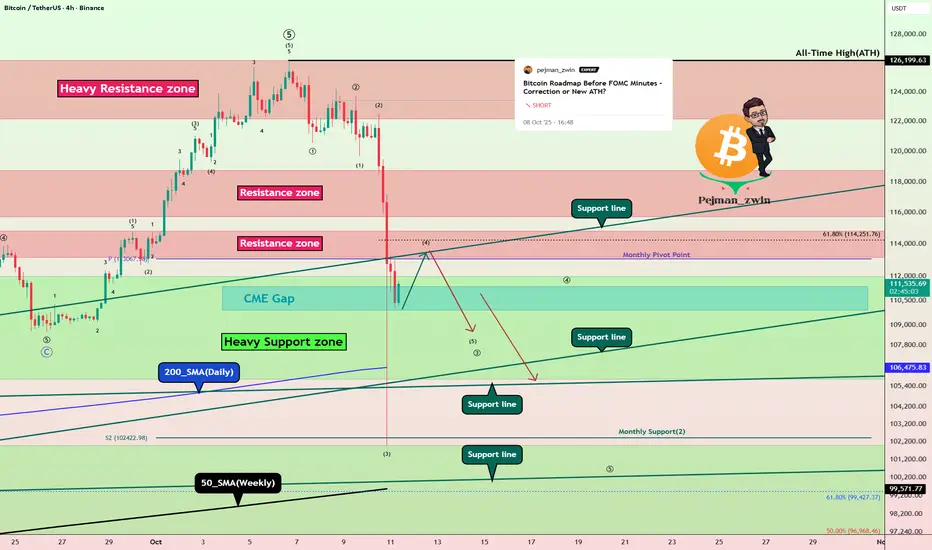
Bitcoin Roadmap: Is a Major Correction the Next Stop?As I expected from the previous analysis , Bitcoin did start to drop and hit its targets .
Now, with the news that the U.S. might impose a 100% tariff on China , we saw Bitcoin sharply sell off last night. Actually, as I mentioned in my previous ideas , the rally from about $109,000 to around $126,199(ATH ) (which was a new all-time high for Bitcoin) had relatively low volume. That was a sign that a correction might be on the way, and last night’s news just acted as a trigger to speed it up.
In fact, what took Bitcoin 10 days to climb was reversed in about 4 days , showing how strong the sellers are right now.
Educational tip: You can use volume candles on TradingView to see which candles had higher volume—the thicker the candle, the more significant the move.
Now, the big question: will Bitcoin keep dropping or bounce back?
Right now, it’s sitting near a cluster of Support lines and close to the daily 200_SMA(Daily) and the 50_SMA(Weekly) , as well as a Heavy Support zone($111,980-$105,820) . Last night’s drop was basically the first test of these supports .
Since it’s the weekend and volumes are usually lower, we don’t expect a huge downward move in the next 48 hours.
Bitcoin might do a pullback to the broken Resistance zone($114,820-$113,180) and then continue its drop.
According to Elliott Wave analysis , Bitcoin seems to be completing a microwave 4 of the main wave 3 .
I expect that after Bitcoin completes , we might see it continue downward and fill the CME Gap($111,355-$109,915) early in the next week.
So, do you think the major correction for Bitcoin has started or not? Let me know what you think!
Note: In case the Support lines break, there’s also a chance that we might see a Death Cross (where the 50-day moving average crosses below the 200-day moving average), which could signal further bearish momentum.
Note: Around the $108,000 level, we have huge buy orders stacked up, which might act as a significant support zone.
Please respect each other's ideas and express them politely if you agree or disagree.
Bitcoin Analysis (BTCUSDT), 4-hour time frame.
Be sure to follow the updated ideas.
Do not forget to put a Stop loss for your positions (For every position you want to open).
Please follow your strategy and updates; this is just my Idea, and I will gladly see your ideas in this post.
Please do not forget the ✅' like '✅ button 🙏😊 & Share it with your friends; thanks, and Trade safe.
Rotation Gold to BTCEvery time gold reaches the top, Bitcoin has a 20% correction. Then money flows from gold to the Bitcoin market, and Bitcoin starts a rally.

BITCOIN SIGNAL: THIS IS WHAT WILL HAPPEN NEXT!!!(smash it) Yello Paradisers! Enjoy the video!!
And Paradisers! Keep in mind to trade only with a proper professional trading strategy. Wait for confirmations. Play with tactics. This is the only way you can be long-term profitable.
Remember, don’t trade without confirmations. Wait for them before creating a trade. Be disciplined, patient, and emotionally controlled. Only trade the highest probability setups with the greatest risk to reward ratio. This will ensure that you become a long-term profitable professional trader.
Don't be a gambler. Don't try to get rich quick. Make sure that your trading is professionally based on proper strategies and trade tactics.

BTC/USDT Analysis. Expected Range-Bound Movement
Hello everyone! This is the trader-analyst from CryptoRobotics, and here’s your daily market analysis.
Yesterday, Bitcoin rebounded from the lower boundary of the high-volume zone at $113,600–$110,600, showing a modest upward move. Upon reaching local resistance, selling pressure returned — currently, sell-side activity dominates according to delta data. However, the absence of strong bearish candles suggests that price action is more likely to drift toward the upper boundary of the current range.
For now, the scenario remains unchanged: we expect continued rotation within the $110,000–$116,000 range. The breakout priority remains to the upside, supported by several factors — stop-hunting below key levels, preservation of the broader flat structure, and evidence of selling absorption in delta.
The bearish alternative would be a firm consolidation below the local low of $109,500, which could open room for a deeper decline toward $97,000.
Buying Zone:
$113,600–$110,600 (high-volume area)
Selling Zone:
$120,900–$124,000 (volume zone)
This publication does not constitute financial advice.

$107,551 Will be a Critical Area for BitcoinGiven that the price of Bitcoin BITSTAMP:BTCUSD is falling below the 8-EMA, 21-EMA, and 200-EMA, technical analysis employing the H4 period suggests that the cryptocurrency is in a downward trend.
The current price of Bitcoin is between $107,551 and $122,007, which is both a traditional support and a demand area. Many traders who established long positions were liquidated in the $108,261 range, according to Coinglass's liquidity data. Consequently, the $107,551–$108,261 range is regarded as a long-term area to monitor.
If the price stays steady above the $107,551–$108,261 area, with a price increase towards the $116,108 region, Bitcoin could continue its upward trajectory.
The price of Bitcoin will continue to drop, testing the $102,000 mark, if it breaks out below $107,551.
