BITCOIN: One Last Drop And Then On The Way $200,000Dear Traders,
In our previous analysis, we predicted a price drop from 100k to 60k through multiple analyses. This prediction has come true as the price is currently plummeting sharply. We believe the price will likely fall between 63k and 58k, which would be ideal for swing buyers and a potential high volume zone.
We anticipate a final drop before the price reverses and potentially reaches a record high. Our initial targets are $100k, $150k and ultimately $200k. This is likely to be a significant reversal.
Please like and comment for more updates. Also, follow us for the latest news.
Team Setupsfx_
Bitcoinpriceforecast

Bitcoin Still Respects the 4-year Cycle Bitcoin has been in a downtrend for months now, yet many reject the notion that we are in a bear cycle. And yet, this week BTC dumped again and marked its >40% retracement since ATH.
This confirms my thesis that we are already in a bear market rather than just making a correction.
I've been saying this since October, but it was really in November when we saw the first signals of this, by failing to reclaim key levels on the way up and getting rejected at every attempt.
The current downtrend is not going to be broken easily and I see at least another few months ahead of us, where Bitcoin slowly finds a bottom and then we will be looking into relief rallies.
The good news is, that this time the cycle looks like it could be shorter, thus not forcing us to wait for years until we start the recovery. But this is still just a theory that needs to be put to the test.
What's interesting this time, is that most of the charts did not show us any convincing indication of the market topping up and we descended into the bears hands somewhat unexpectedly, although the timing was right. This was the only indicator that didn't fail us. The 4 year cycle was due to end in Oct/Nov 2025 and this happened just at the right time. Despite nobody expecting Bitcoin to enter a bear cycle during Trump's peak, after all, he talks a big talk about crypto reserves and all that jazz.
Bitcoin don't care.
While everyone was talking about the end of the 4-year cycle, Bitcoin said: "Nah, Imma go into a bear cycle" just at the right time, proving everyone wrong again.
As per my analysis, the 4-year cycles are still in play and no matter how much we want to see a prolonged bull cycle and mini-bear cycles, this is yet to happen. The cycle ended without a blow-off top (unexpected for many) and without any major hurdles for BTC. It just lost its momentum and buyers lost their fomo, thus we failed to challenge upper resistance. It's a very common occurrence on the charts.
Now the question is - are we going to respect the 1-year bear and 1-year accumulation cycles or will we take a new path?

Bitcoin SELL prediction of the End of january 2026After big sell extenntion price pulled back to a supply zone. Also created breakout of structure to the downside then pulled back for another time that gave us power to decide to take short position. Also,considering price and time theory we had confirmation that was right time take a short position

BTC is Bearish 81400 Head & Shoulders Pattern Good morning
As you can see easy to spot head and shoulders pattern for this Bearish move for BTC with a target of $81,400 range and yes we can go lower however in this trade this is currently the target.
Any questions or struggling with understand on how to trade BTC let us know more than happy to help
Mindbloome Exchange/ Kris

BITCOIN Growth Ahead!
HI,Traders !
#BITCOIN is trading along the
Rising support and is already
Making a bullish rebound so
As we are bullish biased due
To the strong uptrend we
Will be expecting a further
Bullish move up on BITCOIN !
Comment and subscribe to help us grow !

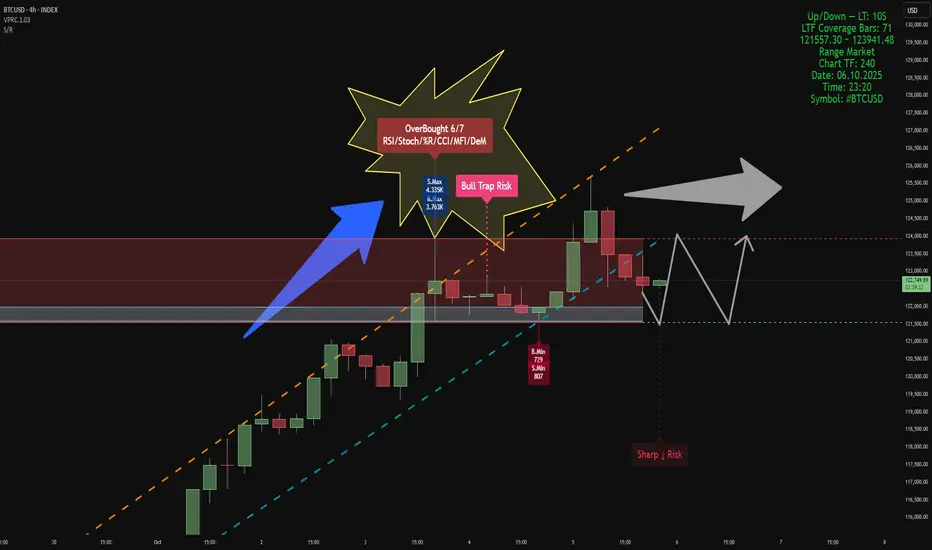
BTCUSD – 4H Volume-Structure Analysis
Indicators
Smart Money Support/Resistance (Lite) & ATAI Volume Analysis with Price Action V1.03
Analytical Setup
• LTF: 10 seconds
• LTF Coverage Bars: 70
• Global Volume Period: 52
• Market Type: Range
• Active Zones:
- Support Zone: 121,557 – 123,941 USD (current active range shown in panel)
The analysis timeframe ensures valid volume coverage, as the period (52) is smaller than total LTF bars (70).
Resistance Area & Bull Trap Risk
In the upper range (≈123,900 USD), a Bull Trap Risk has formed immediately after an OverBought 6/7 condition — confirmed by RSI, Stoch, %R, CCI, MFI, and DeM modules in ATAI. At this point, both buy and sell volumes peaked within the 52-bar window, with S.Max = 4.33K and B.Max = 3.76K. This slight dominance by sellers indicates demand absorption at the top of the structure. The setup matches ATAI’s trap logic — high wick, overbought context, and volume imbalance — signaling potential exhaustion near resistance.
Support Area
Support is currently anchored near 121,550 USD, derived from B.Min and S.Min lows (B.Min = 7.29, S.Min = 807). This aligns with the lower projection from Smart Money S/R, marking the point where cumulative delta begins to compress. Historically, compression at minimum-volume zones often precedes short-term accumulation or range stabilization.
Structural Behavior
The chart shows a defined upward channel (orange and cyan dashed lines). After testing the upper boundary, price entered the resistance zone and generated a Bull Trap Risk followed by moderate rejection. Below, the Sharp ↓ Risk tag signals potential for a short liquidity sweep before stabilization. Volume readings still support range continuation rather than a confirmed reversal, consistent with the Range Market tag.
Probable Scenario
1. A short pullback toward the lower boundary of support (~121.5K) is expected.
2. If support holds and volume compression persists, a rebound toward 123.9K (resistance ceiling) is probable.
3. A breakdown below 121.5K could trigger a deeper correction toward the next S/R projection near 120K.
This represents a neutral-to-bullish range bias: short-term weakness, but constructive above support.
Summary
• OverBought 6/7 + Bull Trap Risk detected at resistance (≈123.9K).
• Support around 121.5K built from B.Min and S.Min.
• Sellers slightly dominant at the trap peak.
• Likely scenario: retest of support, then rebound toward resistance if volume confirms.
• Bias: range continuation until breakout beyond 123.9K or breakdown below 121.5K.
Bitcoin cashBcH usdt daily analysis
Time frame daily
Risk rewards ratio >2.3 👈👌
Target 920$
Double bottoms pattern created

BTC/USD Eyes 50-Week EMA with Bearish MACD CrossoverSo, we just had a bearish cross on the MACD 1-Week chart.
Looking at the long history of BTC price action, this has happened 15 times. In 12 instances, this resulted in a pullback to the 50-Week EMA. In 3 other instances, price was already at or below the EMA and experienced even deeper drawdowns.
In the current cycle, this has already occurred 3 times. During the last cycle this happened 5 times, with the fourth crash marking the cycle top.
Conclusion: 100% of such MACD crossovers resulted in significant pullbacks to or well below the 50-Week EMA.
I hate to bear post, but charts are saying we dip to the 50-Week EMA in 1-5 weeks. Could be a good buying opportunity if price dips that low.
I am new to TA, so always happy to learn your thoughts and criticisms. NFA. DYOR.

MACRO 3-Drive Pattern on Bitcoin | Major Reversal Ahead?Is Bitcoin completing a massive 3-drive structure on the macro chart?
Three clear pushes higher, each with fading momentum, are flashing a major reversal signal.
This could be the final phase before a long-term shift — are you ready for what’s next?
📚 3-Drive Structure Trading Strategy — Full Breakdown
The 3-Drive Pattern is a powerful reversal-based price structure used to spot major turning points in trending markets. It works by identifying three consecutive drives (or pushes) in one direction, typically ending with exhaustion and a high-probability reversal.
Each drive forms a new high or low, but with weakening momentum — especially visible using RSI, MACD, or volume divergence.
🔍 What is the 3-Drive Pattern?
3 consecutive higher highs (or lower lows)
Each drive followed by a shallow pullback
Momentum weakens on each push (divergence forms)
Fibonacci symmetry often present:
- Drive extensions: 127.2%–161.8%
- Pullbacks: usually 61.8%
📉 Bearish 3-Drive (Reversal from Uptrend):
Drive 1: Price makes a higher high with strong momentum
Drive 2: Another higher high, weaker strength
Drive 3: Final high with clear divergence
Reversal: Entry when price breaks below structure
🎯Entry Criteria:
Wait for all 3 drives to form
Confirm with divergence on Drive 3
Use a confirmation candle or structure break
Stop-loss: just beyond the 3rd drive’s high
🎯 Targets:
Conservative: Return to Drive 2 base
Aggressive: Full trend reversal (50%–100% Fib retracement)
🧠 Pro Tips:
Best on 4H, 1D, 3D or 1w timeframes
Confirm with RSI, MACD, or volume divergence
Combine with key S/R or supply-demand zones
💡 Summary:
The 3-Drive pattern is one of the most reliable reversal structures when combined with divergence and Fibonacci symmetry. It's especially powerful at market exhaustion zones and works best with confirmation-based entries.

Bitcoin in expected price zone, may go lower then UP ?
This is the old fractal chart and I have faded out the Fractal from 2013 to 2017,
Everything ese remains unchanged since Feb this year.
We hit the expected price range indicated by the circle and we are still in that area but I expect, once the month closes and we have a small red month candle, then we can start printing Green again.
The daily version of this chart shows us more local detail
We have left the area of resistance and so now, we have a free move BUT I think we may dip down to that line of support around 100K - 98K
This would not be a bad thing to do before the end of the month as it would cool off the PA / RSI and MACD and so give confidence to the serious investor while scaring the pats off the New guys and Gals.
The Daily MACD still has a way to dip before it may find support on the neutral line
This level could see PA near that line of support but it is possible for MACD to drop while PA ranges.
So we could see that Dip to line of support and it may offer the last 100K buying zone for a very long time ..
But we do have Stupid people trying to start WW3 with Lies and Greed - this could possibly destabilise things.
Be Cautious

Bitcoin to 120k or 150k next?The last setup on BITSTAMP:BTCUSD played out exactly as predicted. ()
As of today, June 8, 2025, Bitcoin is trading around $105,000 - $106,000 USD.
And it's been retesting the zone for quite a long time and it's time it broke out! It's less likely to reverse now (Still a possibility tho).
Predictions for Bitcoin's future price is wide, as many analysts are quite bullish:
Year-End 2025: Some experts are eyeing $150,000 USD and more by the end of 2025, citing factors like global liquidity expansion and continued institutional interest.
Do you think it's a possibility?

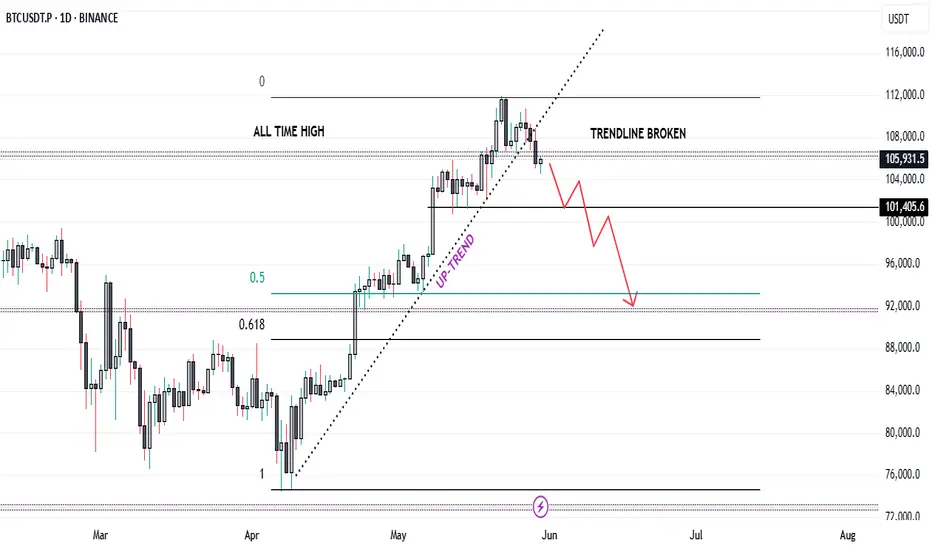
Bitcoin's Breakout Fizzles: Is a Major Reversal in Play...?Bitcoin Technical Analysis – In-Depth Breakdown
Over the past two months, Bitcoin has exhibited a strong bullish trend, appreciating by approximately 51%. The sustained rally was primarily driven by bullish momentum, increased investor confidence, and broader market sentiment.
Recently, Bitcoin broke through its all-time high (ATH) of 106,500, surging to a new peak near 112,000. However, this breakout was short-lived as the price failed to sustain above this level, indicating significant profit-taking activity by traders and long-term holders. This inability to hold the ATH region highlights a potential liquidity pocket where sell orders accumulate, resulting in a rejection wick and a subsequent reversal.
From a Technical perspective:
The price has now fallen back below 106,500, turning this key level into a major resistance zone. Historically, once a strong resistance level (like an ATH) is breached and subsequently reclaimed, it often acts as a formidable barrier to upward price movement unless there’s renewed bullish momentum.
Additionally, Bitcoin has broken its ascending trendline (drawn from the lows of the uptrend) and has already retested this trendline from below. The retest was successful in confirming the breakdown, which further strengthens the bearish bias.
The price structure is now forming a potential lower high pattern near the 106,500 resistance. This could signal a shift in market sentiment from bullish continuation to consolidation or correction.
In terms of market psychology, the all-time high region represents a crucial psychological barrier. Traders and investors often exhibit heightened caution near such levels. Many choose to lock in profits due to fear of a double top or a false breakout. This behavior can create increased volatility, especially when combined with institutional and retail order flows.
Trading Strategy and Risk Management
Given the technical breakdown and the psychological factors at play:
✅ A short position can be considered, particularly around the 106,500 resistance, with confirmation from the trendline retest.
✅ However, exercise caution due to the high volatility typically observed near ATH levels. Whipsaws and fakeouts are common as both bulls and bears battle for control.
✅ Avoid high-leverage positions unless you have a strict stop-loss in place. Ideally, place the stop-loss just above the 106,500 - 107,000 zone, where a decisive breakout would invalidate the short setup.
✅ For profit targets, initial supports are seen around 100,000 - 98,000, and a deeper correction could test the 94,000 - 92,000 zone.
✅ Wait for clear confirmation, such as a strong bearish candle on the retest of the resistance, before entering the trade.
Bitcoin Tests Key Support: Eyes on $103KBitcoin is technically bullish in the 4-Hour chart. However, it gave up bullish move from the last days and is now testing the key support zone near $103,033.
1. A pullback to retest the $103,032 with a dip below it, followed by a strong rebound above this level will push Bitcoin price towards $108,550 (dashed green projection).
2. A decisive move towards $108,550 and breakout with confidence could pave the way for further upward momentum towards $113,692(solid green projection).
3. If Bitcoin fails to hold above $103,032 and breaks below this level without a swift recovery, it could indicate a loss of bullish strength and Bitcoin chart will turn to neutral. This may trigger increased bearish activity, leading to sideways movement or a potential decline toward the $99,108 support level (red projections).

Bitcoin Price Forecast: Potential Bull Run in Q4 2024 & Q1 2025 Bitcoin (BTCUSD) currently holds a strong support level at $55,300. This key level presents a significant opportunity for potential gains. If the support at $55,300 fails, the next critical supports are at $52,000 and $48,500. Given the approaching bull run, we expect a bounce from these levels, particularly in Q4 2024 and Q1 & Q4 2025.
As with previous bull runs, we anticipate substantial volatility during this period. Remembering to exit the market around March or November 2025 is crucial, as the bull run is expected to conclude around this time.
Based on historical data and calculations, the Minimum target for Bitcoin in this bull run is $253,623. If Bitcoin flips the resistance at $253,623 by February 2025, we could see a maximum target of $275,780. Previous bull runs in 2013, 2017, and early 2021 exhibited unexpected price pumps, and we may witness similar volatility this time. While observing resistance zones, it's essential to keep trades active and plan to exit long positions by March or November 2025.
For more detailed analysis and insights, follow us on TradingView to stay updated with our latest ideas and benefit from our expertise.

Bitcoin will do this soonHello Traders,
Bitcoin will do this in one weekly candle sooner or later to fill the CME gap. Everyone is expecting lower prices, but not like this, and Bitcoin loves to surprise people.
Please hit the boost button and follow me for more ideas.
Thanks.

The first green September in 10 yearsIn my last post , I made the case of Bitcoin going to 21k. In this analysis, I want to question that theory.
TLDR: I am questiong my last analyses of Bitcoin going to 21k, based on the current price action.
After the breakout of the support/resistance zone, I was certain 21k was confirmed. However, the next day, an engulfing bullish candle was formed. This did not had to lead to a new theory, but the price kept on rising.
I set 2 conditions for myself as to when to switch my opinion:
1: Bitcoin has to break the current resistance zone (condition has been met today)
2: Bitcoin has to touch the second resistance zone, and come back to the old zone, making it new support.
As the first condition has been met, I see it less likely for Bitcoin to reach 21k. I think the new confirmation should be: If Bitcoin breaks the resistance line it is touching right now, then 21k is off the table, and we will see our first green September in 10 years.

The Mother Of All Trades 🙏🏽 Billions Will Be Made!Imagine a world, where The Crypto Weather Channel had its own bank. That bank stored a large amount of its capital reserves in Bitcoin at the start of the Bull Market. This is what that would look like.
#Long
Take Profit: $66,442 (5th Halving Price)
Entry: $26,976 (CAT 1 Price)
Stop Loss: $15,473 (Market Cycle Low)

BTC ready to take off? Aggressive count, which could give great results if playing out. For the time being I do not have any specific reason on why to be bearish as the wave counts suggests further upside.
These are not trading recommendation,
Trade Safe!

Bitcoin Bull Market Fully Matures! Category 5 😮 What now?In this video we examine what happens after a Bitcoin bull market fully matures and stabilizes. We also explore the relationship between the timing of bull market maturity and the future halving price, and how this relationship may affect the price action moving forward. Thanks for watching!

IMPORTANT! Bitcoin Long-term Price Projection Update!I have officially decided to update our long-term price projection for Bitcoin. A major key change is the elimination of the mini-bull market. Instead we are expecting the current bull market to develop into a major bull market. There is also a very high likelihood that this will be the only bull market for the 4th cycle. In this video we partially stepped outside of The Crypto Weather Channel world to explain our reasoning behind these changes. Thanks for watching!

Bitcoin BTCUSDHello Traders,
BITSTAMP:BTCUSD Is facing a lot of bearish pressure.
If you look at the chart the 'last pattern on weekly chart that can give us filtered information is a head & shoulders with neckline test pointing towards the blank box in the 6200-3600 area that could give a push for strong buying.
Thank you all , please leave a comment with your chart and comment with your TA analysis.
Illyrian Finance

In 5 days $18590 Vix Cheat SheatAccording to Vix cheat sheet indicator we are headed down to 18,590 by September 5th.

In less than 30 hours BTC will shock the worldIn this trend analysis, I show that Bitcoin is gearing up for a huge move towards the upside. Don't get left behind.
the price targets are shown by the orange horizontal lines.
