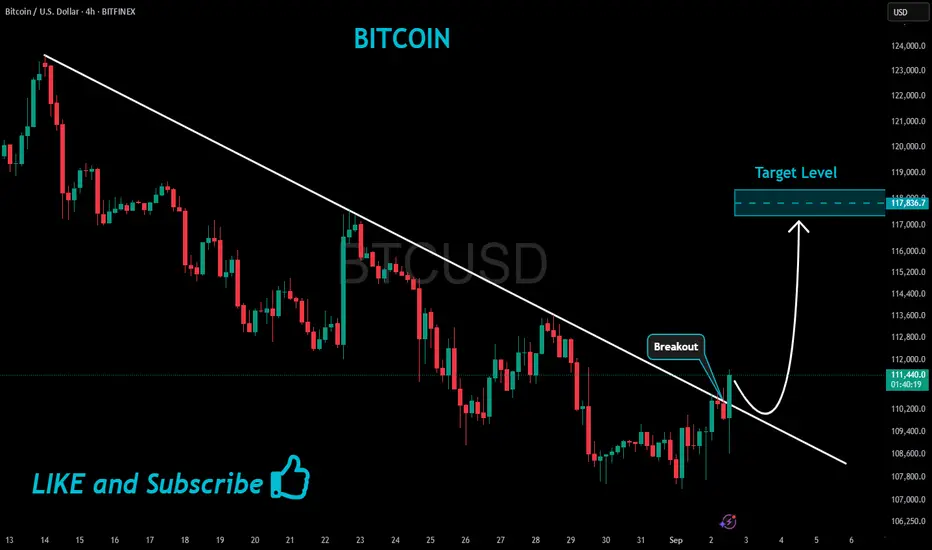
BITCOIN Bullish Breakout!
HI,Traders !
#BITCOIN made a bullish
Breakout of the falling resistance
And the breakout is confirmed
So we are bullish biased
And we will be expecting
A further bullish move up !
Comment and subscribe to help us grow !
Bitcoinpriceprediction
Bitcoin Price’s Grip on $115,000 Weakens—Here's the RiskBitcoin is trading at $114,770, slipping below the $115,000 support level in the process. Should bearish sentiment persist, BTC may fall further, potentially testing the uptrend line that has supported its rise since the start of the month. This would mark a crucial point for investors.
If selling pressure intensifies, Bitcoin could struggle to hold $115,000 as support and slide toward $112,500. This would represent a critical setback, reinforcing the ongoing distribution phase observed among holders and limiting near-term upside potential for BTC.
On the other hand, if Bitcoin absorbs the selling pressure and regains momentum, reclaiming $115,000 as support could trigger another rally. In this case, BTC would target $117,261 in the coming days, reaffirming its bullish outlook and reinforcing investor confidence.

Bitcoin Price To Climb Higher Amid Rising Institutional AdoptionBitcoin Price To Climb Higher Amid Rising Institutional Adoption, Yet Ethereum's Relative Value Puzzles Investors
The digital asset landscape presents a fascinating dichotomy. Bitcoin, the undisputed leader, appears poised for a significant ascent, with analysts increasingly confident in a rally toward the coveted $120,000 mark. This optimism is overwhelmingly fueled by a powerful and sustained wave of institutional adoption, underscored by staggering inflows into U.S. spot Bitcoin Exchange-Traded Funds (ETFs). However, a perplexing counter-narrative is unfolding with Ethereum. Despite its own significant institutional embrace and the successful launch of its own ETFs, the ETH/BTC price ratio remains stubbornly low, signaling a relative weakness against Bitcoin that has left many investors searching for answers.
Bitcoin's Bullish Momentum: The Unstoppable Force of Institutional Capital
The sentiment surrounding Bitcoin is palpably bullish. After a period of consolidation, the cryptocurrency has shown remarkable resilience, holding key support levels and demonstrating renewed strength. Bitcoin is trading at elevated levels, with technical analysts and market experts setting their sights on the next major psychological barrier of $120,000. A sustained break above this level is widely expected to trigger a fresh wave of buying pressure, potentially propelling the price toward new all-time highs.
A flurry of price predictions from various financial institutions and seasoned analysts paints a picture of widespread optimism. Forecasts range from conservative six-figure targets to highly bullish projections well above $200,000. These predictions are united by a common thread: the transformative impact of institutional adoption.
The primary engine driving this bullish outlook is the unprecedented success of U.S. spot Bitcoin ETFs. These investment vehicles have served as a regulated and accessible bridge for institutional capital to flow into the digital asset space. Recent weekly net inflows have been measured in the billions of dollars, reversing previous outflows and signaling a renewed and voracious investor appetite. Leading funds from major asset managers have been the primary beneficiaries, consistently attracting hundreds of millions in fresh capital.
This influx of institutional money represents a fundamental shift in how Bitcoin is perceived. Major institutions are actively adding exposure and incorporating Bitcoin into their long-term investment strategies. This is evidenced by the behavior of "whales"—large Bitcoin holders—who have been accumulating significant amounts, viewing price dips as buying opportunities. The growing institutional presence is also contributing to a reduction in Bitcoin's notorious volatility, making it a more attractive asset for diversified portfolios.
Further bolstering the bullish case are favorable macroeconomic conditions. With expectations for lower interest rates, the appeal of risk assets like Bitcoin is on the rise. A weaker U.S. dollar and lower borrowing costs historically create a fertile environment for assets with a fixed supply to thrive. The confluence of massive ETF inflows, strategic institutional accumulation, and a supportive macroeconomic backdrop has created a powerful tailwind for Bitcoin.
The Ethereum Conundrum: High Adoption, Low Ratio
While Bitcoin basks in the glow of institutional validation, the story for Ethereum is more nuanced. On the surface, Ethereum is experiencing its own institutional renaissance. The approval of spot Ethereum ETFs has been met with considerable enthusiasm, attracting billions in capital and providing a regulated pathway for traditional investors to gain exposure to the world's leading smart contract platform.
The inflow data for Ethereum ETFs has been impressive, at times even surpassing Bitcoin's on a monthly basis. Cumulative inflows have reached a significant figure, a clear testament to the growing recognition of Ethereum's value proposition, which extends beyond a simple store of value to encompass the vast ecosystems of decentralized finance (DeFi), non-fungible tokens (NFTs), and real-world asset (RWA) tokenization.
Institutions are not just buying ETH through ETFs; they are also actively participating in the network's staking mechanism. An unprecedented surge in staking activity has seen a significant portion of ETH's circulating supply locked away to secure the network and earn yield. This "supply squeeze" is fueled by both institutional players and large individual holders, underscoring the long-term conviction in Ethereum's future. With a large percentage of the total supply staked, the available liquidity on exchanges has dwindled, a factor that would typically be expected to exert strong upward pressure on the price.
Given this backdrop of robust adoption, significant ETF inflows, and a tightening supply, one would expect Ethereum to be gaining ground on Bitcoin. However, the ETH/BTC price ratio, a key metric that reflects the relative value of Ethereum to Bitcoin, tells a different story. This ratio has remained stubbornly below the 0.05 mark, a level that signals relative weakness for ETH. It currently hovers at a low level, far from its historical peak.
This persistent underperformance is a source of considerable debate. A higher ratio indicates that ETH is appreciating faster than BTC. The current suppression suggests that while absolute demand for Ethereum is strong, the demand for Bitcoin is even stronger.
Several factors may be contributing to this conundrum. Bitcoin's established brand and its narrative as "digital gold" give it a powerful first-mover advantage, particularly among institutional investors taking a conservative, phased approach. For many, Bitcoin is the initial and primary allocation.
Secondly, Ethereum's utility introduces complexities and risks compared to Bitcoin's simpler value proposition. The ongoing evolution of the network, while bullish long-term, may present a steeper learning curve for some investors.
Furthermore, a historical trend of Bitcoin outperforming Ethereum may have created market inertia, with capital continuing to flow into the asset with stronger recent relative performance. In essence, both assets are appreciating, but Bitcoin is doing so at a faster rate, keeping the ratio suppressed.
Beyond the Big Two: Other Trending Cryptos to Watch
While Bitcoin and Ethereum dominate, the broader cryptocurrency market is a hotbed of innovation. Investors are exploring a diverse range of projects with potential for significant growth, driven by several key trends.
Layer-2 Scaling Solutions: As Ethereum faces demand-driven congestion, Layer-2 solutions have become indispensable. Projects offering faster, cheaper, and more scalable environments for decentralized applications are capturing a growing share of activity and represent a crucial investment theme for ecosystem growth.
Integration of Artificial Intelligence and Blockchain: The convergence of AI and blockchain is gaining considerable traction, creating new possibilities in automated trading, decentralized organizations, and sophisticated dApps. Projects leveraging AI to enhance blockchain capabilities are attracting significant attention.
Tokenization of Real-World Assets (RWA): This is poised to be one of the most transformative trends. Representing physical assets like real estate and commodities as digital tokens on a blockchain has the potential to unlock trillions in illiquid assets, making them more accessible and tradable globally. This is expected to drive a new wave of adoption.
Meme Coins and Community-Driven Projects: While often speculative, meme coins continue to exert significant influence, demonstrating the power of community and viral marketing. Their enduring popularity highlights the importance of cultural relevance in the crypto space.
The altcoin market is characterized by higher volatility and risk. However, for investors with a high-risk tolerance, it offers the potential for outsized returns based on technological adoption and market trends.
The Road Ahead: A Market at a Crossroads
The cryptocurrency market is a study in contrasts. The overwhelming force of institutional adoption is propelling Bitcoin toward potentially historic highs. The success of Bitcoin ETFs has fundamentally altered the market structure, creating a sustained demand that shows no signs of abating.
Conversely, the curious case of the ETH/BTC ratio serves as a reminder of the market's complexity. While Ethereum's own institutional story is compelling, it has yet to translate into sustained outperformance against Bitcoin.
Looking ahead, the market's trajectory will be shaped by key factors. Central bank monetary policy will continue to play a crucial role. The continued growth of the ETF market will be a primary indicator of institutional sentiment. And ongoing innovation in scaling, AI, and tokenization will determine the next generation of leading projects.
For investors, the current environment offers both immense opportunity and significant risk. The bullish case for Bitcoin appears robust, but volatility remains. Ethereum's long-term value is undeniable, but its short-to-medium-term performance relative to Bitcoin is less certain. The altcoin market holds promise but requires careful navigation.
In conclusion, the narrative of rising institutional adoption is powerfully reshaping the digital asset landscape. As Bitcoin bulls eye their next target, the broader market watches closely, navigating the crosscurrents of innovation, regulation, and macroeconomic forces that will define the future of this transformative technology.

Bitcoin Price Eyes Breakout as ETF Inflows Mirror ATH TrendBitcoin’s price is trading at $114,192 at the time of writing, facing resistance at $115,000. Sustained buying interest at this level will be crucial to trigger the next stage of upward movement.
If ETF inflows remain strong, BTC could flip $115,000 into support and rally toward $117,261 before targeting $120,000. This level would represent a critical milestone in Bitcoin’s ongoing bull cycle.
However, if the breakout attempt fails, Bitcoin may consolidate between $112,500 and $110,000. Such a pullback would invalidate the immediate bullish thesis but still keep BTC within its broader uptrend channel.

Bitcoin Price History Says BTC Needs To Crash 8% To Form New ATHAt the time of writing, Bitcoin trades at $112,221, holding firm above the $110,000 support. This resilience reinforces the four-month uptrend line and signals potential short-term gains. The momentum is intact, with BTC eyeing higher levels.
If sustained, Bitcoin could climb past $112,500 and head toward $115,000. Yet to reach a new ATH, history suggests BTC might need to drop to $101,634 first, setting the stage for a stronger breakout.
On the flip side, if profit-taking escalates, BTC could slip toward the retracement level sooner. But should fear-driven selling dominate, the price risks falling below $100,000, which would invalidate the bullish outlook and extend the correction phase.

Bitcoin BTC Trend Shift: Watching for a Break (BoS) Confirmation🚀 Bitcoin (BTC) Update 🚀
Bitcoin has made a bullish move 🟢📈, showing a clear structural shift to the upside 🔄 on the 4H chart ⏰. My bias remains bullish ✅, but with a degree of caution ⚠️.
What I want to see next is a decisive break above the previous swing high 📍📊 — this would confirm a true break of structure (BOS) 🔓 versus the current stage, which is only a structural shift 🔄.
⚠️ This analysis is educational only and not financial advice. 📚

Bitcoin Targets $116K or $104K Post-CPIMy main bias is to the upside, expecting more upward movement, contingent on holding $104,770. The upcoming CPI data is the key catalyst. On the 4-hour chart, a break above $111,721 targets $116,722, while a break below $109,464 targets the key support zone at $104,777.

History Suggests Bitcoin Price Is Fated To ConsolidateBitcoin crossing the $112,500 resistance is encouraging, providing a path toward $115,000. This level is crucial for attracting new capital inflows, which would validate the recovery and increase the likelihood of sustained upward momentum.
However, historical patterns suggest consolidation remains likely. Bitcoin may settle under $115,000 or slip below $112,500, with sideways price action dominating the short term as the market absorbs recent volatility.
If profit-taking accelerates, Bitcoin could face sharper declines. A drop back to $110,000, or even a loss of this support, would weaken sentiment and invalidate the bullish thesis, leaving BTC vulnerable to extended consolidation or further downside.

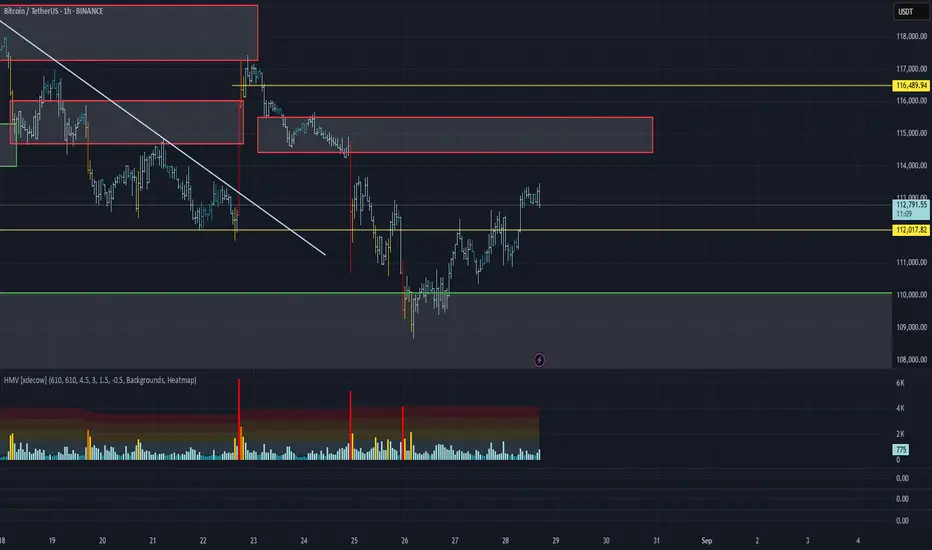
Analytics: market outlook and forecasts
📈WHAT HAPPENED?
Last week was marked by an update of the local minimum again. However, the breakdown turned out to be uncertain and weak, accompanied by delta absorption.
We've rebuilt the global buying zone on the daily chart: now it's in the range of $108,000-$102,500. Until the price is fixed below these levels, the global trend can be considered upwards.
In the short term, bitcoin is still in a downward trend. It's extremely risky to open long positions before the breakdown of the inclined line. The seller's activity remains limited, but the buyer doesn't take the initiative either.
💼 WHAT WILL HAPPEN: OR NOT?
The main scenario for the current week is the expansion of the range to collect liquidity in both directions.
The minimum is most likely not formed yet. For a more confident decline, the market needs more activity. This requires two conditions: an increase in open interest from the buyer and liquidity in the form of stop orders.
For now, it's better to refrain from trading the first cryptocurrency or, in anticipation of the resumption of the global long trend, consider grid spot strategies.
Buy Zones:
• $108,000–$102,500 (accumulated volumes)
Sell Zones:
• $112,400–$113,300 (local volume zone)
• $114,400–$115,500 (volume zone)
• ~$116,500 (volume anomaly)
• $117,200–$119,000 (accumulated volumes)
• $121,200–$122,200 (buy absorption)
📰 IMPORTANT DATES
The following macroeconomic events are expected this week:
• Tuesday, September 2, 09:00 (UTC) — publication of the consumer price index in the Eurozone for August;
• Tuesday, September 2, 13:45 (UTC) — publication of the index of business activity in the manufacturing sector (PMI) USA for August;
• Wednesday, September 3, 14:00 (UTC) — publication of the number of open vacancies in the labor market (JOLTS) USA for July;
• Thursday, September 4, 12:15 (UTC) — publication of changes in the number of people employed in the US non-agricultural sector in August;
• Thursday, September 4, 12:30 (UTC) — publication of the number of initial applications for unemployment benefits in the United States for August;
• Thursday, September 4, 13:45 (UTC) — publication of the business activity index (PMI) in the US services sector for August;
• Thursday, September 4, 14:00 (UTC) — publication of the Purchasing Managers' Index for the non-manufacturing sector (ISM) USA for August;
• Friday, September 5, 12:30 (UTC) — publication of the average hourly wage, changes in the number of people employed in the non-agricultural sector and the unemployment rate in the United States for August.
*This post is not a financial recommendation. Make decisions based on your own experience.
#analytics

BTCUSD Faces Mid-Band Rejection: Deeper Retracement incoming Price is showing rejection around the mid-range of its volatility bands after failing to sustain above the $112,800 zone, suggesting a potential continuation lower. The setup aligns with multiple bearish signals favoring downside momentum.
✅ Bearish Confluences:
Fibonacci Resistance: Price rejected just below the 38.2% retracement level at $114,619, failing to reclaim higher ground.
Lower High Structure: Market continues to print lower highs, reinforcing the short-term bearish trend.
Volatility Band Pressure: Rejection from the mid-band area highlights weakening buy-side momentum and strengthens the case for further downside.
🎯 Fibonacci-Based Targets:
TP1 – $111,016 (38.2%): First support test within the lower range.
TP2 – $109,903 (61.8%): Deeper retracement target in line with bearish continuation.
TP3 – $108,102 (100%): Full measured move completion toward the lower volatility band.
SL: Placed above $114,620 to invalidate the short thesis in case of bullish breakout.

BTC/USDT Analysis. Testing a key low
Hello everyone! This is CryptoRobotics trader-analyst with the daily market analysis.
Yesterday, a strong market seller emerged in Bitcoin, pushing the price lower. The local zone at ~$112,000 (abnormal cluster) provided only minimal reaction.
At the moment, we have already tested the local low. Now we need to wait for a buyer’s response. If strong activity appears, the main upside potential is towards $114,400–$115,500 (volume zone). If there is no reaction, the first downside target is around $107,000.
We have updated the global buying zone on the daily chart, now defined as $108,000–$102,500. As long as the price does not consolidate below this range, the broader trend can still be considered bullish.
Buy zones:
$108,000–$102,500 (accumulated volumes).
Sell zones:
$112,400–$113,300 (local volume zone),
$114,400–$115,500 (volume zone),
~$116,500 (volume anomaly),
$117,200–$119,000 (accumulated volumes),
$121,200–$122,200 (buying absorption).
This publication does not constitute financial advice.
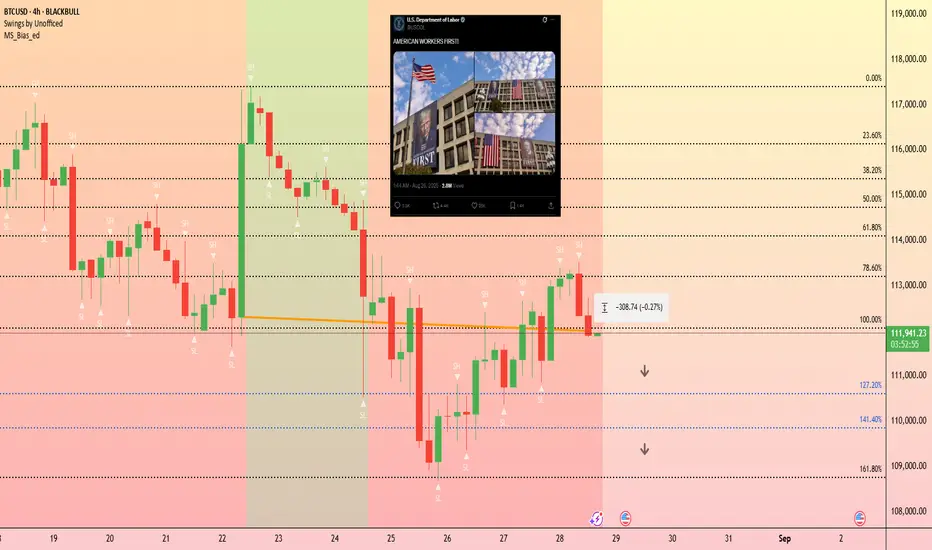
How Potentially Manipulated NFP Data Could Affect BTC's PricBitcoin rallied last Friday after Federal Reserve Chair Jerome Powell's prepped the market for an interest rate cut in September.
However, these gains have faded, with Bitcoin back to where it started last Friday; around $112,000.
The market's focus is now shifting to the upcoming U.S. Non-Farm Payroll (NFP) report, scheduled for release next week, which could greatly influence interest rates expectations.
Strong job data may reduce the likelihood of a September rate cut.
And with an Orwellian portrait of Trump now hanging from the Department of Labor Building, and his administration potentially pressuring the Bureau of Labor Statistics to inflate job numbers, this scenario is becoming a real possibility. If this happens, we could expect price action to test the lower Fibonacci retracement levels, such as the 141.4% at around $109,900 or further at $108,700.
BTC/USDT Analysis. Continuation of the local uptrend
Hello everyone! This is CryptoRobotics trader-analyst with the daily market analysis.
Yesterday, the market followed our scenario, continuing the local uptrend and breaking the previous high. At the moment, there are no strong signs of profit-taking that could trigger a reversal, nor major resistance zones nearby. The main expectation remains further growth towards the $114,400–$115,500 (volume zone), where a reversal pattern may start to form.
For intraday traders, the key level to watch is around $112,000. An abnormally high volume cluster was recorded there, which positioned buyers earlier. If the price dips into this zone and shows a reaction, a local long setup may be considered.
Buy zones:
~$112,000 (local zone, abnormal cluster),
$110,000–$105,000 (accumulated volumes).
Sell zones:
$114,400–$115,500 (volume zone),
~$116,500 (volume anomaly),
$117,200–$119,000 (accumulated volumes),
$121,200–$122,200 (buying absorption).
This publication does not constitute financial advice.
BTC/USDT Analysis. Buying Resumes
Hello everyone! This is CryptoRobotics trader-analyst with the daily market review.
Yesterday, as expected, Bitcoin buying activity resumed. The price reached the resistance area around ~$112,000 (absorption of market buys) and showed an initial reaction. The seller’s response was relatively weak, so if the local high is broken, we may see a move towards the next supply zone at $114,400–$115,500 (volume zone).
On the broader picture, demand remains weak, so a retest of the local low is still likely in the near term. For now, we remain out of positions and consider shorts from the next supply zone.
Buy Zones:
$110,000–$105,000 (accumulated volumes)
Sell Zones:
$114,400–$115,500 (volume zone)
~$116,500 (volume anomaly)
$117,200–$119,000 (accumulated volumes)
$121,200–$122,200 (absorption of buys)
This publication does not constitute financial advice.

Bitcoin buy Soon as soon possibleBitcoin buy Soon as soon possible
The live Bitcoin price today is $111497.14 USD with a 24-hour trading volume of $64109128491.21 USD. We update our BTC to USD price in real-time.

Bitcoin - Looking To Sell Pullbacks In The Short TermH4 - Strong bearish move.
No opposite signs.
Expecting bearish continuation until the two Fibonacci resistance zones hold.
If you enjoy this idea, don’t forget to LIKE 👍, FOLLOW ✅, SHARE 🙌, and COMMENT ✍! Drop your thoughts and charts below to keep the discussion going. Your support helps keep this content free and reach more people! 🚀

Bitcoin Profits Hit 2-Month Low, How Are Investors Reacting?BINANCE:BTCUSDT current price is $111,653, falling through the $112,500 support level. This zone has held strong since early August, offering a key buffer against deeper losses. For now, price action shows consolidation rather than collapse.
In the span of one week, BINANCE:BTCUSDT profits have declined sharply, hitting a two-month low. The price drop has pushed several addresses out of profit, reducing overall realized gains. Such drawdowns often follow overheated conditions, which may have marked a recent market top.
Given the current sentiment and net accumulation, BINANCE:BTCUSDT could see a bounce to $115,000 . If buying pressure increases and macro support builds, BTC might stabilize above this resistance. Alternatively, it may continue to trade sideways between $112,500 and $115,000 until clarity returns.
However, if accumulation slows and selling resumes, BINANCE:BTCUSDT may drop to $110,000. A move this low would mark a near two-month bottom and could expose BTC to increased downside risk.

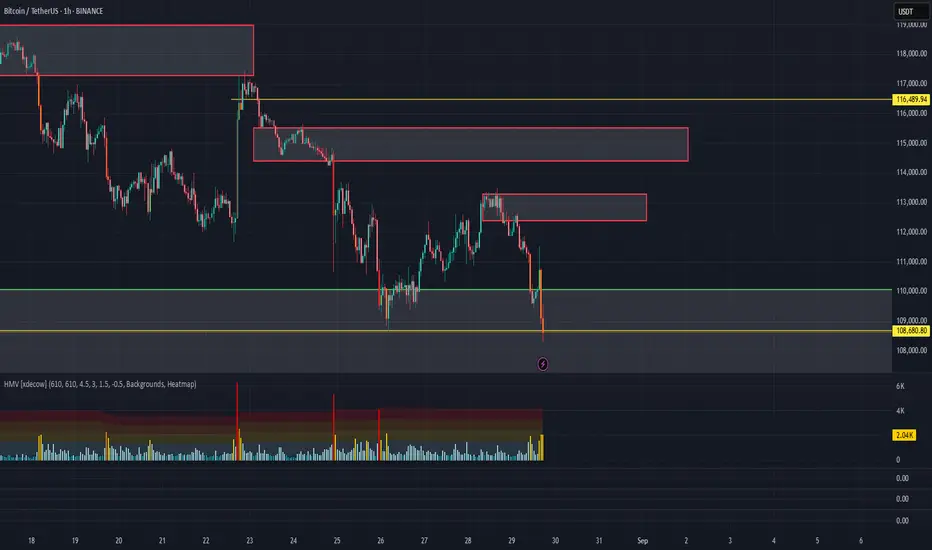
Analytics: market outlook and forecasts
📈 WHAT HAPPENED?
Last week, Bitcoin declined to a significant low of $112,000, where it formed a small false breakout.
Amid news of a potential key rate cut in September, the price broke through the descending trendline. The first volume zone was passed without a reaction; however, in the $117,200-$119,000 zone (accumulated volumes), Bitcoin corrected and subsequently found no support until it formed a new low.
The overall context is now shifting back to the bearish side. The key support zone of $110,000-$105,000 (accumulated volumes) has still not been tested, and its proximity makes this range a natural "magnet" for the price. At the same time, significant resistance levels based on volume have formed above the current price.
💼 WHAT WILL HAPPEN: OR NOT?
The current market situation appears highly manipulative, and the lack of reaction in the mirror volume zone around ~$115,000 only reinforces this impression.
We anticipate a test below the $110,000-$105,000 support zone. From this level, buyers will most likely resume their activity.
Buy Zones:
$110,000–$105,000 (accumulated volumes)
Sell Zones:
$114,400-$115,500 (volume zone)
~$116,500 (volume anomaly)
$117,200–$119,000 (accumulated volumes)
$121,200–$122,200 (buy absorption)
📰 IMPORTANT DATES
This week, we expect the following macroeconomic developments:
• Monday, August 25th, 14:00 (UTC) — US New Home Sales for July.
• Tuesday, August 26th, 14:00 (UTC) — US CB Consumer Confidence Index for August.
• Thursday, August 28th, 12:30 (UTC) — US GDP for Q2 and US Initial Jobless Claims for August.
• Friday, August 29th, 12:00 (UTC) — German Consumer Price Index (CPI) for August.
• Friday, August 29th, 12:30 (UTC) — US Core PCE Price Index for July and the year-over-year comparison (July 2024).
*This post is not financial recommendation. Make decisions based on your own experience.
#analytics

BITCOIN BTC PRICE ANALYSIS AND NEXT EXPECTED MOVES!!CRYPTOCAP:BTC Update & Next Possible Trade Ideas!!
• Right Now For Short term i am expecting sideway movement in CRYPTOCAP:BTC Price. (Overall No Trade Zone Area)
REASON:
Volume is Low, LTF's Structure look Bullish & HTF's Structure is Bearish... I think we will stuck in a trap🚨
• But after consolidation if price manage to hold 114600$ then we will look for long setup OR It's Price Drop B/w 111500$ to 110000$ zone then we will also look for quick long scalp🫡
• Trade ideas that i marked on a chart are also for quick scalp.
• Let's see how Price react in comming days🫠
Warning : That's just my analysis DYOR Before Taking any action🚨🚨

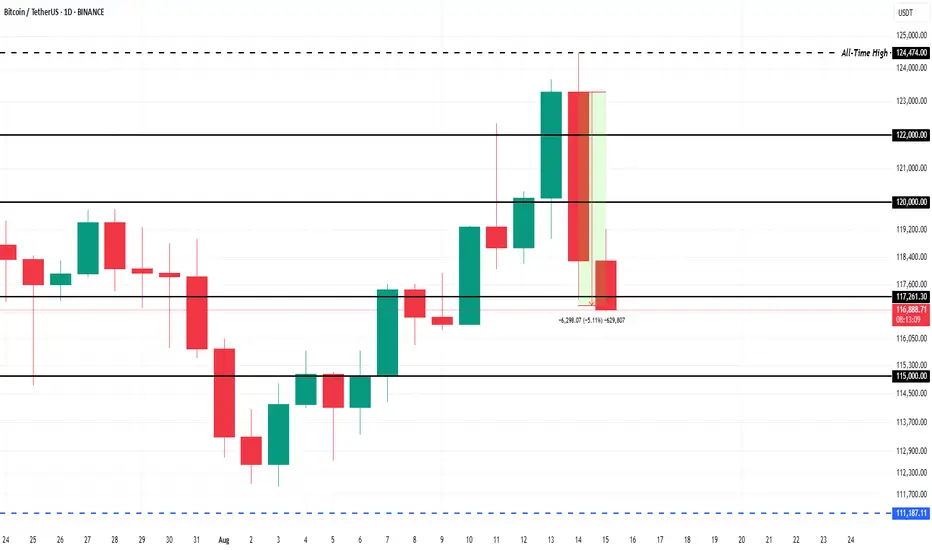
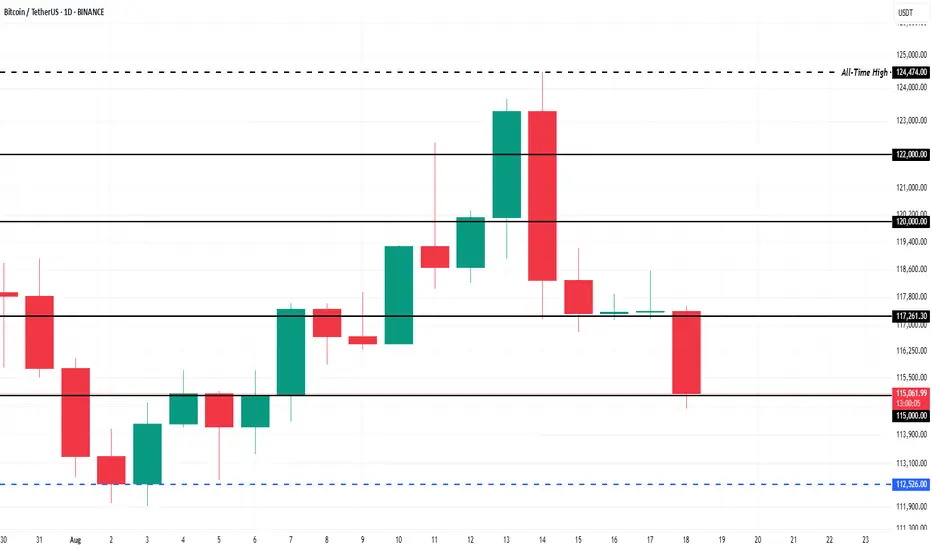
Bitcoin Price Forecast: Indicators Suggest $127,000 TargetAt the time of writing, BINANCE:BTCUSDT trades at $115,061, holding firmly above the $115,000 support. The models suggest that selling by STHs will remain limited until BTC approaches $127,000, which sits above the previous all-time high of $124,474 and marks the next major profit-taking level.
For BINANCE:BTCUSDT to reach this target, broader market support will be necessary. Geopolitical tensions remain a drag on sentiment, but renewed investor confidence could aid momentum. Reclaiming $117,261 as support and pushing to $120,000 would set the stage for a potential new all-time high in the near term.
If conditions worsen, BINANCE:BTCUSDT risks losing $115,000 support, with a possible decline to $112,526 or lower. Such a move would invalidate the bullish thesis and highlight the vulnerability of BTC to external pressures, reinforcing caution among traders while the market reassesses its trajectory.
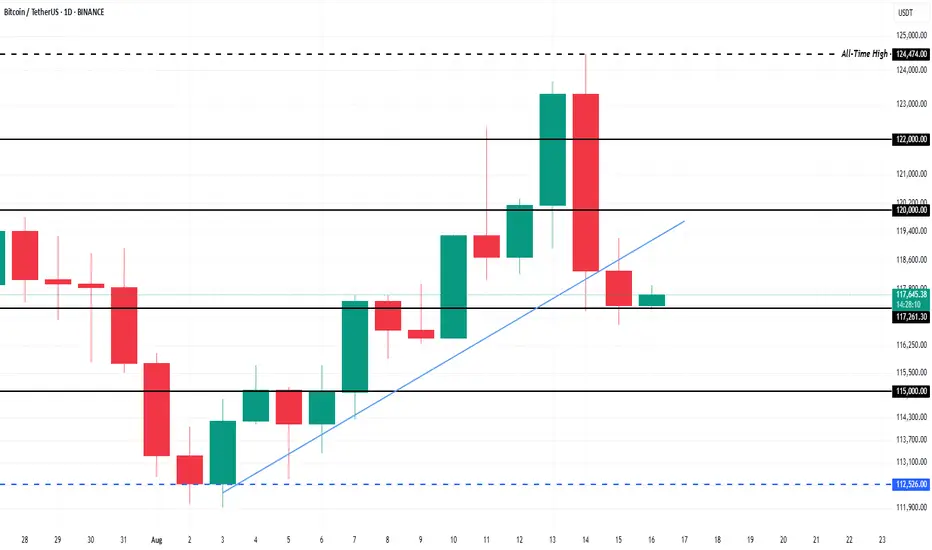
Bitcoin Key Holders Turn Neutral Ahead Of Volatility ExplosionBINANCE:BTCUSDT price had shown an upward trend throughout the month, but this momentum faltered in the last 24 hours, with BTC falling to $117,305 . This decline occurred as the price slipped below the established uptrend line, signaling a shift in market sentiment.
If investors maintain their positions during the expected volatility surge, BINANCE:BTCUSDT could stabilize above $117,000. This would open the door for a potential push toward $120,000, turning it into support and allowing further upside movement.
However, if investor sentiment turns bearish and selling increases in response to volatility, BINANCE:BTCUSDT could face a significant drop . In this case, the price may fall through the $115,000 support level, potentially reaching as low as $112,526 . This would wipe out the gains seen in August, invalidating the bullish outlook.
BBTCUSD long setupBTCUSD long setup
Entry - 111900.0
Stop Loss - 110670.0
Target - 123120.0
Risk Reward - 1:9.12

Why are Whales Moving Bitcoin to Binance? Weekly Whale WatchBINANCE:BTCUSDT price is currently trading at $116,830 after slipping below the key $120,000 level. The price fell from the recent ATH of $124,474 , showing some volatility. Despite this decline, Bitcoin is maintaining support above $119,000, suggesting that the recent dip could be a short-term correction.
In the past 24 hours, Binance has seen a massive increase in BINANCE:BTCUSDT deposits, with 6,060 BTC, worth approximately $722 million , added to the exchange’s balance. This surge primarily comes from whales
Given the mixed market sentiment, BINANCE:BTCUSDT could potentially reclaim $120,000 as a solid support level. If the bulls manage to maintain this level, Bitcoin might be able to recover from the recent dip and push towards $122,000.
However, if selling pressure intensifies, BINANCE:BTCUSDT price may fall through the $117,261 support level . A deeper drop could take the price to $115,000 or lower, which would invalidate the bullish outlook and indicate further market weakness.