Markets Could See Up to $80B of Selling PressureGoldman Sachs Warns of Massive Systematic Selling — Markets Could See Up to $80B of Pressure
Goldman Sachs’ trading desk recently issued a cautionary note that the current sell-off in global markets may not be over yet, and that downside pressure could extend significantly through February and beyond.
🔹 Systematic selling still in motion
According to GS, trend-following algorithmic strategies (like CTAs — Commodity Trading Advisers) have already triggered sell signals as key equity indices dipped, making them net sellers in the near term regardless of direction. Even in a flat market, these systematic models are expected to unload shares simply to rebalance positions.
🔹 Billions in potential sell-offs
Goldman’s analysis suggests:
~$33B of selling could occur this week if markets continue to weaken;
As much as ~$80B of systematic selling could be triggered over the next month if the S&P 500 breaches key technical thresholds.
Even without a further drop, models imply roughly $15B–$8B of selling in various scenarios as systematic funds reset exposure.
This selling isn’t driven by fundamental business news but mechanical trends and volatility — meaning these flows can hit markets even during mild rebounds.
⚠️ Why This Matters for Markets
📉 Equities: If trend-following selling continues, it may prolong or deepen the equity correction. These models can act independently of fundamental earnings or macrodata, amplifying volatility.
📉 Crypto (including BTC):
Bitcoin and other risk assets often move in sympathy with equities during stress periods. Liquidity drain in stock markets can spill over into crypto as investors de-risk, and systematic selling can trigger stop-loss cascades across correlated markets. Reports specifically note that such selling could pose downside risks for Bitcoin, gold, and silver as liquidity conditions deteriorate.
🧠 What This Means in Practice
💡 Not a guaranteed crash, but a higher probability of continued volatility and downside pressure across risk assets if:
Key equity support levels break
Volatility stays elevated
Trend-following models remain active sellers
This is not about fundamentals turning suddenly weak — it’s about technical and systematic flows creating selling pressure on autopilot.
Bitcoinsell

Bitcoin - Looking To Sell Pullbacks In The Short TermH1 - Strong bearish move.
No opposite signs.
Currently it looks like a pullback is happening.
Expecting bearish continuation until the two strong resistance zones hold.
If you enjoy this idea, don’t forget to LIKE 👍, FOLLOW ✅, SHARE 🙌, and COMMENT ✍! Drop your thoughts and charts below to keep the discussion going. Your support helps keep this content free and reach more people! 🚀
--------------------------------------------------------------------------------------------------------

Bitcoin 455 days Rising Wedge Top FormationHello there! Here we can clearly see that bitcoin is putting in a 455 days rising wedge.
It means that every rally is getting smaller, every consolidation is taking less time, meaning bulls have less and less ammo to push the price higher - a sign of exhaustion. Price is becoming compressed and an asset is looking for a resolution (a pattern is breaking up or down).
Also we can clearly see a declining volume of this rising wedge, meaning that that there is less and less interest as the price goes higher. The trend was very aggressive, but bulls could not maintain the velocity of the trend.
And now we have a trendline which is breaking down and the volume is increasing confirming the pattern breakdown. It is like the price was trapped in that rising tide, but because of the lack of momentum, volume the trend could not be sustained anymore leading to this breakdown. At first we lost 50 day Moving average, then 200 day MA, all with very little volume, now we are about to lose 50 week MA, which supported this whole bull market.
Protect your capital.
Stay safe everyone and have a great day!

[CRT] BITCOIN -> Weekly Outlook for the week of January 12Let’s look for the weekly direction for our beloved BITCOIN from a CRT perspective, as we have been doing with other assets since the end of 2025.
First of all, I would like to kindly ask you for a follow and to show some love to this article if you liked it, so I can keep creating this type of content.
Let’s get started. As always, first a bit of context to understand where we are and where we might be heading:
6-month timeframe chart of COINBASE:BTCUSD
On this timeframe (6 months), we can observe a bearish range formed after the close of the last semester candle of 2025, with a target at 112K .
It is worth mentioning that, as we already know, the BIAS for this asset has always been bullish, and we only have one precedent of such a high-timeframe range being completed in the opposite direction in the last ten years , and that precedent occurred during the 2022 correction.
Could this bearish range be completed? In my opinion, anything is possible in this world, but as always from a CRT perspective, we will first be waiting for price around 80.5K (red line on the chart), which is the low of the second semester of 2025 and the first possible reversal point on this timeframe.
Let’s now move down to the monthly timeframe:
Monthly timeframe chart of COINBASE:BTCUSD
On the monthly timeframe, we have a closer target located at 83.7K, which is the low of December 2025, and which we can aim for first, since price must at least go for the November low.
Why does it have to go for the November low if there is no bearish range formed toward that level on this timeframe?
Because from a CRT perspective, to go down, price must take highs, and to go up, it must take lows . November closes with the body outside of October, December is an inside candle which we ignore due to its condition, therefore if price wants to reverse, it must take that low, and if it wants to continue lower, obviously it must take it as well.
Let’s continue, now on the 2-week timeframe:
Biweekly timeframe chart of COINBASE:BTCUSD
Things are getting interesting for our intraday trading. We already have a first target with a high probability of being completed during this month of January, which is the low located at 86.35K, although there are still 7 days left for this low to be confirmed on the biweekly timeframe. Let’s now move down to the weekly timeframe to see if this low makes sense:
Weekly chart of COINBASE:BTCUSD
On the weekly timeframe, with 18 hours left before the candle closes at the moment I am writing this article, the next target is located at 86.675K . If price is going to complete it, it will most likely close inside the biweekly range and confirm the 86.35K target.
To finish this analysis and clearly define the intraday direction, let’s zoom in a bit more and move to the daily timeframe:
Daily chart of COINBASE:BTCUSD
On the daily timeframe, we already have the target we will aim for on Monday once we get confirmations from bearish ranges formed on the 4h, 6h, or 12h timeframes pointing toward lower lows, and we will take first partials at 89.2K .
To take a bit more risk, although it is difficult without having Sunday’s candle closed, I have drawn an optimal selling zone, which is basically Friday’s PO3, since Saturday is an inside candle and we ignore it.
We also need to pay attention to the liquidity taken above on Sunday , as price might start dropping from there:
4h timeframe chart of COINBASE:BTCUSD (optimal sell zone)
And that’s it for my weekly outlook on $COINBASE:BTCUSD.
As you know, if you liked it, please give me a follow so I can keep writing this type of content.
Have a great start to the week and many profits!

Bitcoin Technical Outlook | Bearish Scenario in FocusBitcoin is trading inside a clear descending consolidation structure after a strong bearish impulse from the 116k area. Price has repeatedly failed to reclaim the resistance zone 102,600–98,400 and is now compressing inside a bearish triangle showing weak momentum and lower highs. Multiple BOS and CHoCH signals confirm sellers remain in control. The broader structure is still bearish while price stays below the descending trendline and the 95k–100k supply zone. This consolidation suggests a continuation move lower, with downside liquidity resting below the 73k and 69k levels.
🔻 Trade Plan:
Bias: Bearish continuation
- Sell Zone: 92,500 – 95,000 (trendline + structure resistance)
- Sell Confirmation: Rejection / bearish candle inside the triangle or at resistance
- Targets: TP1: 80,500, TP2: 73,800 (strong low), TP3: 69,000 – 66,800 (major liquidity & fib extension)
- Invalidation: Daily close above 100,000 – 102,600
Note
Please risk management in trading is a Key so use your money accordingly. If you like the idea then please like and boost. Thank you and Good Luck!

Bitcoin Short Term Sell IdeaH4 - Strong bearish move.
No opposite signs.
Currently it looks like a pullback is happening.
Expecting bearish continuation until the two Fibonacci resistance zones hold.
If you enjoy this idea, don’t forget to LIKE 👍, FOLLOW ✅, SHARE 🙌, and COMMENT ✍! Drop your thoughts and charts below to keep the discussion going. Your support helps keep this content free and reach more people! 🚀
--------------------------------------------------------------------------------------------------------

Bitcoin SHORT AnalysisBitcoin SHORT Analysis
Our sell zone aligns with the Point of Control (POC) and an unfilled H1 Order Block (OB) & SIBI, which serves as our Point of Interests (POI).
This zone was established following a displacement and the formation of a CISD (Change in State of Delivery), indicating a potential shift in market structure.
Currently, there is a significant draw on liquidity on the sell side, with the previous day’s low (PDL) forming equal lows, suggesting a liquidity pool beneath this level.
I anticipate that price may sweep this liquidity before initiating a substantial move towards the buy-side liquidity.
Given that there have been no major liquidity sweeps thus far, I expect price to respect the H1 Order Block.
Should the appropriate confirmation signals appear, I plan to enter a short position targeting the PDL as the primary objective. 🎯

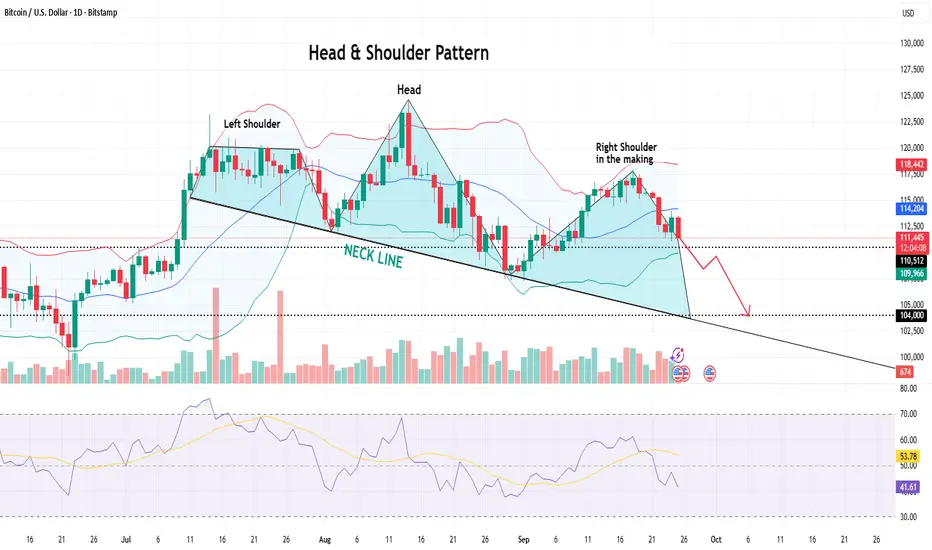
Bitcoin Creating a Classic Bearish Reversal SignalBitcoin is forming a Head & Shoulder pattern, a classic bearish reversal setup.
The right shoulder is in the making, and for that price might fall towards the neckline support around near 104000 level, a crucial zone to watch.
The immediate support exists near 110500, if breached successfully, the probabilities of reaching the 104000 zone will rise.
A confirmed break below the neckline could accelerate downside momentum toward $100,000–$98,000.
RSI is trending lower, showing weakening momentum and supporting the bearish outlook.
If neckline holds, a short-term bounce is possible, but overall structure favors sellers.
Also on the weekly chart, a clear Evening Star pattern has been creating (while writing this analysis)
Hence, taking double confirmation from the daily & weekly chart, Bitcoin prices are expected to fall.
Why Bitcoin (BTC) Will Likely Fill the Downside Imbalance After Bitcoin just made a sharp move up, liquidating short positions across the board — but if you think the pump is here to stay, think again. Let’s break down why BTC may be headed right back down to fill the imbalance it just created.What we just witnessed was a classic liquidity grab. Retail traders piling in with shorts at the local highs created a liquidity pool — and smart money took advantage. The sudden push up wasn’t organic; it was engineered to stop out shorts, triggering a cascade of liquidations and buy stops.But here's the key: in doing so, BTC left behind a significant imbalance — or Fair Value Gap — to the downside. If you're not familiar, imbalances are areas on the chart where price moved too quickly in one direction, leaving low-volume zones with inefficient pricing. These gaps tend to get filled more often than not, because the market seeks equilibrium. After a liquidity grab, smart money usually has no reason to sustain the move immediately — instead, they want to mitigate risk. That often means bringing price back to re-test the origin of the move and fill in the inefficient price action — especially if there’s confluence with a previous demand zone or breaker block.Don’t get caught chasing the pump. Remember, smart money moves in layers — liquidity grabs, imbalance fills, and then continuation. Until that downside inefficiency is addressed, the move isn’t complete.

BITCOIN Bearish Breakout!
HI,Traders !
#BITCOIN made an epic
Bearish breakout of a very
Strong key horizontal level
Of 112340.5which is now a
Resistance and the breakout
Is confirmed so we are
Bearish biased and we will
Be expecting a further
Bearish move down !
Comment and subscribe to help us grow !

Bitcoin - Looking To Sell Pullbacks In The Short TermH4 - Strong bearish move.
No opposite signs.
Expecting bearish continuation until the two Fibonacci resistance zones hold.
If you enjoy this idea, don’t forget to LIKE 👍, FOLLOW ✅, SHARE 🙌, and COMMENT ✍! Drop your thoughts and charts below to keep the discussion going. Your support helps keep this content free and reach more people! 🚀

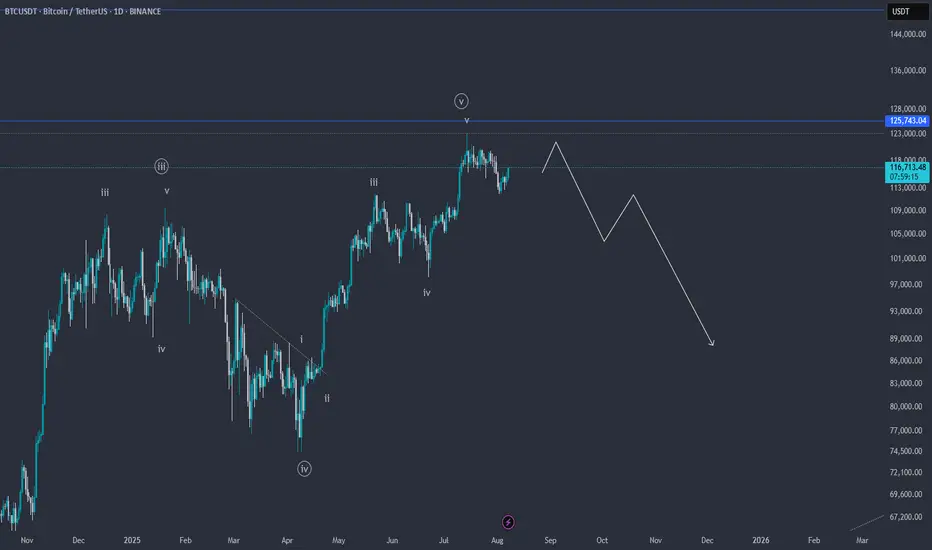
BTCUSDT Elliott Wave – End of the Rally or Start of a Crash?📉 BTCUSDT Elliott Wave Analysis – End of the Rally or Start of a Crash? ⚠️
On the BTCUSDT chart, it appears that the fifth wave of the impulsive structure is nearing completion. The wave count clearly shows a full five-wave sequence, suggesting that Bitcoin may be forming a major top around the $119,000–$125,000 resistance zone.
🔻 If price action confirms a reversal and breaks key support levels, we could see a deep correction potentially taking BTC below $90,000.
📌 Keep in mind this is a scenario based on wave structure and requires confirmation via breakdowns and price action.
💬 What do you think? Is Bitcoin ready for a major correction, or will it break into new all-time highs?
✅ Save this idea & follow for updates!
Bitcoin | BTCUSD | SELLSell Bitcoin.
Price reached supply level on 1H, we got confirmation of rejection from 15m.
Take Profit: 111,430
Stop Loss: 120600

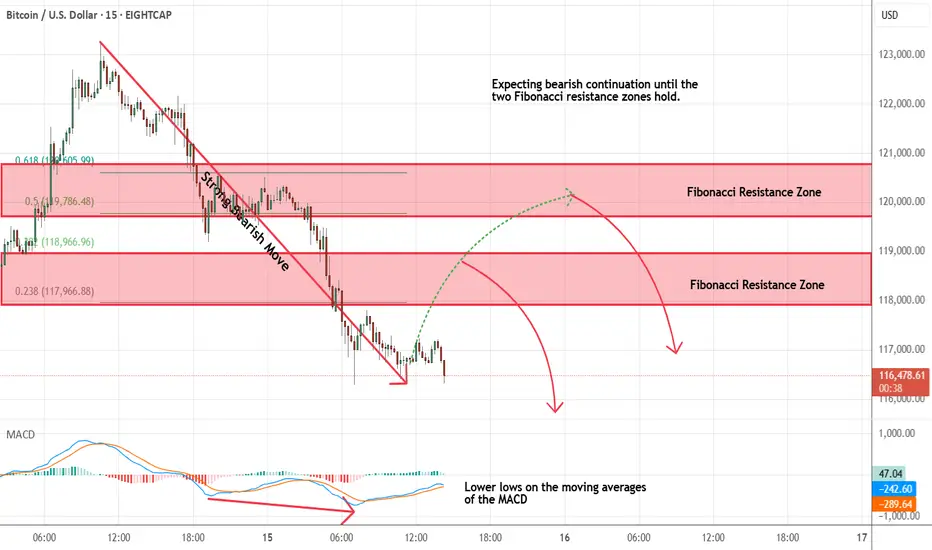
Bitcoin - Looking To Sell Pullbacks In The Short TermM15 - Strong bearish move.
Lower lows on the moving averages of the MACD.
No opposite signs.
Currently it looks like a pullback is happening.
Expecting bearish continuation until the two Fibonacci resistance zones hold.
If you enjoy this idea, don’t forget to LIKE 👍, FOLLOW ✅, SHARE 🙌, and COMMENT ✍! Drop your thoughts and charts below to keep the discussion going. Your support helps keep this content free and reach more people! 🚀
--------------------------------------------------------------------------------------------------------------------
SHORT ON BITCOINBITCOIN has continue to create lower highs at a major resistance zone.
I will be selling bitcoin looking to make over 8000 to 20,000 points.

BITCOIN Bearish Signal | Technical + Custom AlgoSmart Trend Signal | Technical Analysis + Custom Algorithm
This signal is the result of a combination of classic technical trend analysis and a proprietary software I personally developed.

Thu 15th May 2025 BTC/USD Daily Forex Chart Sell SetupGood morning fellow traders. On my Daily Forex charts using the High Probability & Divergence trading methods from my books, I have identified a new trade setup this morning, and this is a BTC/USD Sell trade. As usual, you can see the details of the trade/s on the chart. Keep in mind that I am generally looking to buy when the MACD is below the zero level & sell when it is above the zero level. The red/blue QMP Filter dots on the price chart produce the actual trade signal. I am also considering things like divergence, support/resistance, round numbers etc, and these will be marked up on the chart. Enjoy the day all. Cheers. Jim

Tue 6th May 2025 BTC/USD Daily Forex Chart Sell SetupGood morning fellow traders. On my Daily Forex charts using the High Probability & Divergence trading methods from my books, I have identified a new trade setup this morning. As usual, you can read my notes on the chart for my thoughts on this setup. The trade being a BTC/USD Sell. Enjoy the day all. Cheers. Jim

Sat 29th Mar 2025 BTC/USD Daily Forex Chart Sell SetupGood morning fellow traders. On my Daily Forex charts using the High Probability & Divergence trading methods from my books, I have identified a new trade setup this morning. As usual, you can read my notes on the chart for my thoughts on this setup. The trade being a BTC/USD Sell. Enjoy the day all. Cheers. Jim

We warned you in the previous post about the crash, BitcoinDo you remember the last post where we warned you about the upcoming crash?
Today, reality has become even harsher.. Bitcoin has crashed below $100, and Tram Coin has plummeted into oblivion!
🔥 Unfortunately.. for those who didn’t read the previous post:
It was the golden opportunity to exit before the disaster..
Now.. regret and loss for those who ignored the warnings!
💡 If you want to know how low Bitcoin will go.. read the previous post!
And if you don’t want the market to crash on you.. hit follow so you don’t miss any important warnings or analysis!
💔 The fear of loss is worse than the loss itself..
Don’t let procrastination or neglect make you a victim..
Follow the analysis and always be prepared for any scenario!
📉 The market shows no mercy..
So, are you ready for the next move?
This is the post I warned you from.. If you were following me and read it, you wouldn’t have lost!

Bitcoin Sell IdeaThere is a potential bearish move on the 1 hour chart.
Stop loss: 108.04
TP: Around 96.5

Bitcoin Major DropBitcoin Major Drop incoming, if the market closes with sharp bearish candle below 93k then next target would be around 86k more time to buy before major cycle

Short Bitcoin (BTC) (For Study Purpose Only)Short Recommendation
Entry Level: Below $94,000
Stop Loss (SL): $111,111
This surge has been largely attributed to President-elect Donald Trump's pro-cryptocurrency stance, including promises of deregulation and the establishment of a national strategic Bitcoin reserve.
However, concerns are emerging regarding Bitcoin's current valuation. Analysts warn that the market may be overheating, with some predicting a potential correction of up to 35%.
COINTELEGRAPH
Additionally, Federal Reserve Chair Jerome Powell has stated that the U.S. central bank cannot hold Bitcoin, which has introduced uncertainty into the market.
This analysis is for educational purposes only. Always consult your financial advisor before making any investment decisions. Cryptocurrency trading involves significant risk, including the potential loss of capital. Ensure to evaluate your risk tolerance and conduct thorough research.
