BITCOINS - time to recoverTeam, time to ADD BITCOINS at the current price 99715
WORST retest around at 98000 can add more at this level
STOP LOSS safe at 96000
Target 1 at 101500-102500 - take partial and bring stop loss to BE
Target 2 at 103500-105000
TARGET 3 at 109000-115000 - HOLD until december!
lets go for SANTA RALLY.
Bitcoinsignals

Bitcoin LONG OpportunityBitcoin Potential Long
Recently, we observed a liquidity sweep targeting key swing points, including the Previous Day’s Low (PDL), which represents sell-side liquidity within the previously established range.
Going forward, I anticipate that price may continue to draw toward liquidity levels below the current range , specifically the Previous Week’s Low (PWL) and an unfilled imbalance within the Monthly Fair Value Gap (FVG).
Should price reach this zone, I will be closely monitoring market structure and lower-timeframe price action for signs of a potential reversal or long setup from that area towards Buyside Liquidity.

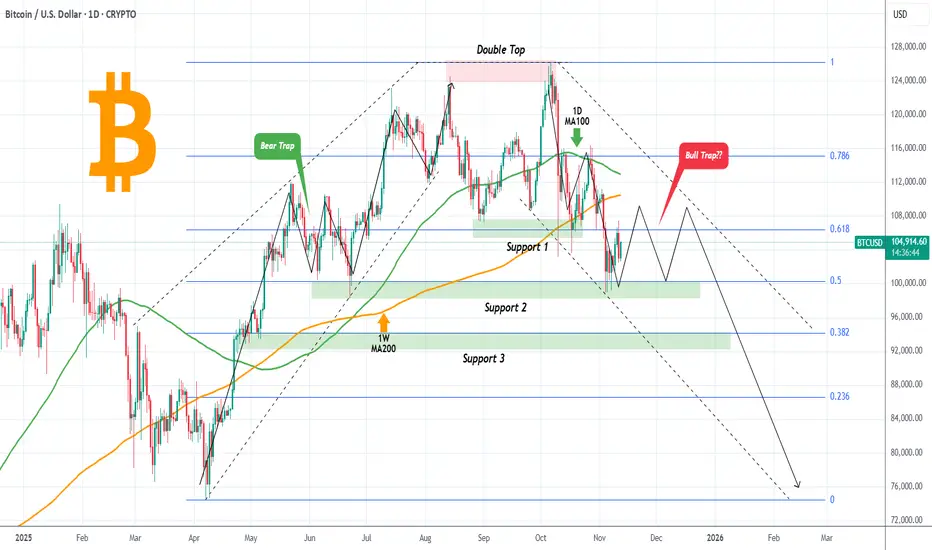
BITCOIN Is it following a symmetric downtrend?Bitcoin (BTCUSD) recently broke below the $100000 level for the first time since June and is currently on a short rebound. It has turned however all major MAs both the 1D MA100 (green trend-line) and 1D MA200 (orange trend-line) into Resistances, so the downtrend remains.
By doing so, we can see a highly symmetric pattern emerging, the inverse of the April - August uptrend. Following the (nearly) October 06 Double Top, the symmetrical downtrend has been testing and respecting all subsequent Support levels (so far Support 1 and 2), filling at the same time all Fibonacci gaps. See how accurately those Fibs formed key demand levels during the uptrend.
As a result, if this symmetry continues to hold, we can expect BTC to trade sideways for another month between Support 2 (Fib 0.5) and $110000 (roughly) before making the next leg down. Such price behavior typically confuses market participants and traps traders who stick to the former trend and haven't adapted yet.
Will it happen this time also and this potential ranged trading trap more buyers? Feel free to let us know in the comments section below!
---
** Please LIKE 👍, FOLLOW ✅, SHARE 🙌 and COMMENT ✍ if you enjoy this idea! Also share your ideas and charts in the comments section below! This is best way to keep it relevant, support us, keep the content here free and allow the idea to reach as many people as possible. **
---
💸💸💸💸💸💸
👇 👇 👇 👇 👇 👇
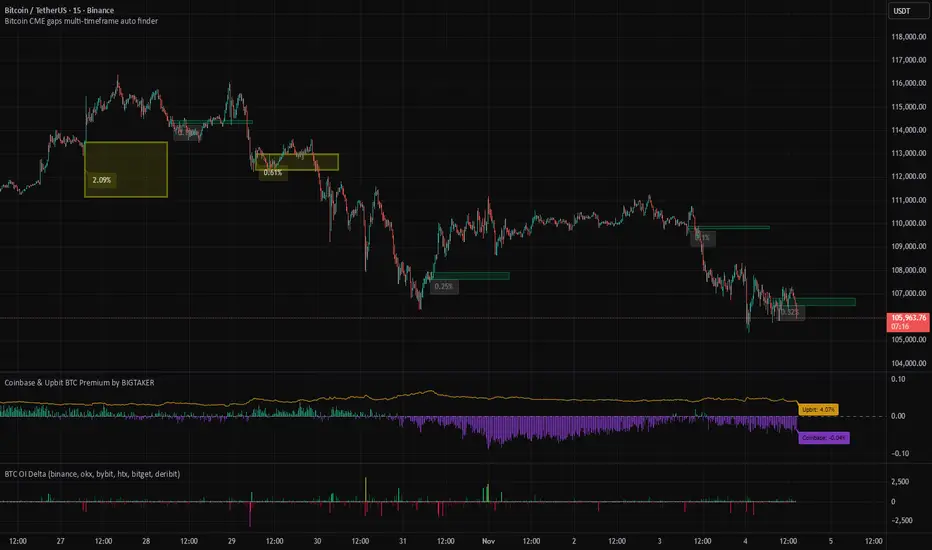
What is bitcoin CME Gap? How to use BTC gap IndicatorWhat is bitcoin CME Gap? How to use BTC gap Indicator
The 'Gap' in the CME (Chicago Mercantile Exchange) futures market, which offers a glimpse into the movements of institutional investors, is one of the key indicators many professional traders watch closely.
1️⃣ What is the Bitcoin CME Gap?
CME is one of the primary avenues for institutional investors to access Bitcoin. However, the CME Bitcoin futures market closes over the weekend (from Friday afternoon to Sunday afternoon, Chicago time, USA). Additionally, there is a one-hour trading break after market close on weekdays.
Conversely, spot exchanges like Binance and OKX, which we commonly see, operate 24 hours a day.
This difference is where a 'Gap' occurs. Especially during weekends, when the break is longer, gaps tend to be larger.
Bearish Gap: Occurs when the opening price after the CME market closes is lower than the closing price. This means that the Bitcoin price fell in the spot market during the off-hours.
Bullish Gap: Occurs when the opening price after the CME market closes is higher than the closing price. This means that the Bitcoin price rose significantly in the spot market during the off-hours.
Abrupt Psychological Shift: This implies that investor sentiment leaned heavily towards one side during the weekend.
Unfilled Order Blocks: The gap area is interpreted as a region where potential unfilled orders (buy/sell pressure) may exist.
Gap Fill Phenomenon: Many traders believe in the adage "gaps get filled" and use it as a trading strategy. This suggests a tendency for the price to move in the opposite direction of the gap, eventually attempting to cover the gap area. However, this phenomenon is not 'mandatory', and whether a gap will be filled immediately or much later must be judged through various analyses.
2️⃣ Easily Find CME Gaps
The Bitcoin CME gaps multi-timeframe auto finder indicator automates CME candle analysis and displays it intuitively on the chart.
⚡Indicator Features and Usage
Multi-Timeframe Gap Detection: 5-minute, 15-minute, 30-minute, 1-hour, 4-hour, and even 1-day candles! It simultaneously detects and displays CME gaps occurring across various timeframes. Whether you're a short-term trader or a long-term investor, you can check gaps according to your trading style.
Automatic Box and Label Display: The detected gap areas are drawn as rectangular boxes on the chart. Bullish gaps are displayed in green tones, and bearish gaps in red tones, making them easy to identify at a glance. The size of each gap (%) is displayed as a label above its respective box.
Highlight Function: Large gaps above a set threshold (e.g., 0.5%) are highlighted with an emphasized color. 'Big gaps' can have a greater impact on the market, so they should be noted.
Chart Price Synchronization: The price of spot charts from other exchanges may differ from the CME futures price. This indicator adjusts the price of the gap boxes to the price level of the chart you are currently viewing via the "Chart_price" mode. By using the "Chart_price" mode, you can more intuitively grasp the price level of the gap box on the spot chart and make direct trading plans on the chart of another exchange you are viewing.
Real-time Alerts: You can receive real-time alerts when a new CME gap is detected. You can also set alerts to notify you only about gaps from a specific timeframe. This is extremely useful when you can't continuously watch the chart during weekends or specific times on weekdays.
3️⃣ Trading Strategies
💡Gap Fill Strategy:
When a Bullish Gap Occurs: If the price breaks above a bullish gap but then falls back into the gap area attempting to fill it, one might consider a long position near the bottom of the gap, or a short position if the price fails to rebound from the top of the gap. Alternatively, a strategy of considering a short position in a resistance zone before the gap is filled is also possible.
When a Bearish Gap Occurs: If the price breaks below a bearish gap but then rises back into the gap area attempting to fill it, one might consider a short position near the top of the gap, or a long position if the price fails to fall from the bottom of the gap. Alternatively, a strategy of considering a long position in a lower support zone before the gap is filled is also possible.
💡Utilizing as Support/Resistance Areas:
Old CME gap areas can act as strong support or resistance lines when the price retests those levels in the future.
Observe whether the price encounters resistance and falls again when it reaches the top of a bearish gap, or if it finds support and rises again when it reaches the bottom of a bullish gap. Gaps that overlap across multiple timeframes can hold even stronger significance.
💡Trend Confirmation and Reversal Signals:
If a strong bearish gap occurs and is not immediately filled, but the price continues to fall, this could indicate the start or continuation of a strong downtrend.
If a strong bullish gap occurs and is not immediately filled, but the price continues to rise, this could indicate the start or continuation of a strong uptrend.
You can use the price movement after a gap occurs to gauge market momentum and apply trend-following or trend-reversal strategies.
For example, if a bearish gap occurs but is quickly filled within a few days and breaks above the top of the gap, this could be interpreted as an early sign that the bearish market has ended.
💡Multi-Timeframe Analysis:
When looking for key support/resistance levels, check not only the gaps of the current timeframe you are viewing but also gaps from higher timeframes (e.g., 4-hour or daily gaps on a 1-hour chart).
Gaps from larger timeframes are areas of stronger market interest. When making trading decisions in smaller timeframes, consider the location of important gaps from higher timeframes for risk management or to set entry/exit targets.
Short-term Gaps (5m, 15m): Most gaps occur within 1% and can be utilized for short-term volatility, high-leverage scalping, or day trading. They are suitable for quick entry/exit strategies, with caution against whipsaws. They tend to be filled before the 4-hour candle closes after the market opens.
Medium-term Gaps (1h, 4h): Can be referenced for swing trading or position trading. They can become significant support/resistance areas depending on price movement after the gap occurs.
Long-term Gaps (1d): Can act as major turning points in market trends or as important support/resistance levels from a long-term perspective. If a 'big gap' occurs, the possibility of a shift in the market's overall direction should also be considered. They usually occur during the weekend off-hours, and sometimes large gaps of over 3% occur.
A weekday short-term gap that was filled 4 hours ago.
A weekend long-term gap that saw a trend increase after a 4% big gap occurred.
4️⃣ Conclusion
The 'Bitcoin CME Gap Multi-Timeframe Auto Detector' indicator is a powerful tool that helps you not miss crucial price fluctuation points in the market.
However, no indicator should be blindly trusted. Gaps may not be fully filled, or the price may immediately break out in the opposite direction after surpassing a gap. Instead of relying solely on gap filling, it is crucial to analyze it in conjunction with other indicators to increase your win rate.
We hope you utilize the information gained from this indicator and combine it with your existing analysis methods (chart patterns, auxiliary indicators, macroeconomic analysis, etc.) to build more sophisticated trading strategies.
📌If this content was useful, please support us with a boost and comments. Your small encouragement is a great strength for creating better analyses and content. By following, you can also receive notifications about our postings

BITCOIN Did the 1W MA50 just save the day again?Bitcoin (BTCUSD) just closed last week above its 1W MA50 (blue trend-line) even though it broke below it during the day.
Since the March 13 2023 break-out above the 1W MA50, this is the 4th time that BTC breaks below it but manages to close the 1W candle above it. All of those times (including the additional one of September 11 2023), marked market bottoms, Higher Lows for the 3-year Channel Up and initiated the Bull Cycle's strong rallies.
However every rally has been weaker and since the first one topped in March 2024, we have a huger Bearish Divergence on the 1W RSI of Lower Highs against BTC's Higher Highs, showcasing loss of strength for the trend. A natural feat however, as the Bull Cycle tends to be stronger on its start as it rebounds violently from the market bottom and less strong towards the end as it matures and big positions already start to take profits.
But is this the end of the Cycle? The 4-year Cycle Theory, the DXY bottoming, the 1W RSI Bearish Divergence among others, all say 'yes'. But the Bear Cycle can only be technically confirmed when the market closes that 1W candle below its 1W MA50 and so far it hasn't. Is that enough to rely your strategy on from this point onwards?
So has the 1W MA50 just saved the day again for Bitcoin? Feel free to let us know in the comments section below!
-------------------------------------------------------------------------------
** Please LIKE 👍, FOLLOW ✅, SHARE 🙌 and COMMENT ✍ if you enjoy this idea! Also share your ideas and charts in the comments section below! This is best way to keep it relevant, support us, keep the content here free and allow the idea to reach as many people as possible. **
-------------------------------------------------------------------------------
💸💸💸💸💸💸
👇 👇 👇 👇 👇 👇

Bitcoin Correction Eyes $108,800FenzoFx—Bitcoin rebounded from $99,300.00 and is now trading near $106,000.00. This upward move is likely a corrective phase, with potential to fill the liquidity void up to $108,800.00.
The equal lows at $99,326.00 remain vulnerable after repeated tests. We expect the downtrend to resume once BTC reaches the bearish fair value gap near $108,000.00. If confirmed, the next bearish targets are $100,000.00 and $90,000.00. The bearish outlook remains intact as long as the price stays below $116,576.00.

Bitcoin Daily Outlook: Support and Resistance in FocusHey Guys,
Looking at Bitcoin on the daily chart, the 105,000 to 98,000 levels are strong support zones. This means that as long as the price does not fall below these levels, a sharp decline in Bitcoin is unlikely.
The price touches these areas, but whales prevent it from breaking lower with strong buying, pushing it back up again.
The 113,000 – 116,000 levels are strong resistance zones.
As long as Bitcoin does not fall below 98,000, my target remains 113,000.
Currently, Bitcoin is trading at 105,887. Once my target is reached, I will provide updates.
Every single like I receive from you is my greatest motivation to share these analyses. I sincerely thank everyone who supports me with their likes.🙏

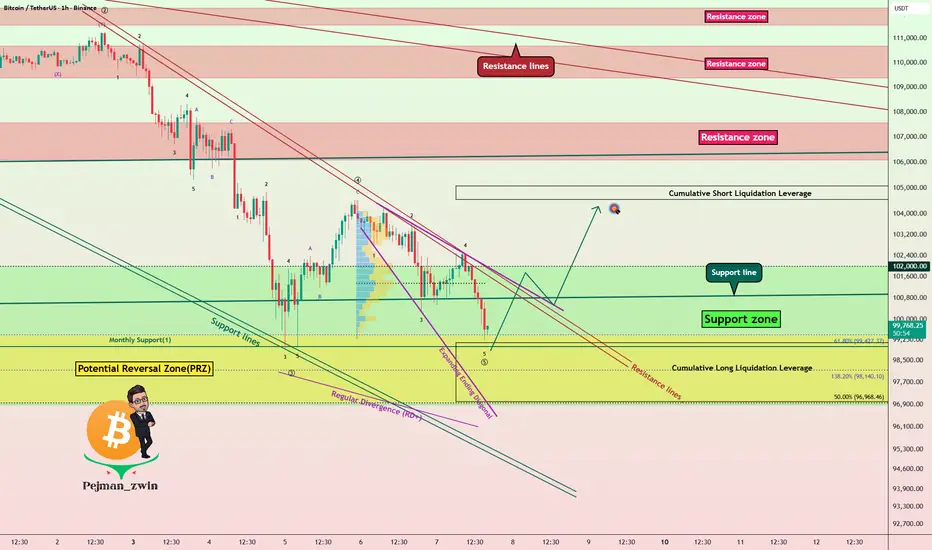
Bitcoin Bulls Defending $97K – Reversal Loading!Before diving into the Bitcoin analysis , it’s worth noting that Bitcoin has had a strong correlation with the SPX500 index ( SP:SPX ) in recent weeks. So, alongside analyzing Bitcoin, it’s a good idea to keep an eye on the SPX500 chart these days.
Currently, Bitcoin( BINANCE:BTCUSDT ) is moving in a Support zone($10200,980-$96,880) near a Potential Reversal Zone(PRZ) and a Cumulative Long Liquidation Leverage($99,145-$97,208) .
From an Elliott Wave perspective, it looks like Bitcoin is forming an Expanding Ending Diagonal to complete the microwave 5 of the main wave 5 .
Also, we can see a Regular Divergence(RD+) , which is a good sign of a potential reversal.
Given my expectation that the SPX500 Index will start to rise again, I also expect that Bitcoin will follow suit and could climb at least to around $104,200 .
Cumulative Short Liquidation Leverage: $105,074-$104,551
Stop Loss: $96,178
Please respect each other's ideas and express them politely if you agree or disagree.
Bitcoin Analysis (BTCUSDT), 1-hour time frame.
Be sure to follow the updated ideas.
Do not forget to put a Stop loss for your positions (For every position you want to open).
Please follow your strategy and updates; this is just my Idea, and I will gladly see your ideas in this post.
BITCOIN HIGH PROBABILITY SETUP SOON!!!🚨 BTCUSD HIGH PROBABILITY BUY SETUP 🚨
* Here We Can See Clearly The Next Potential Moves For BTC Coming Hours/Days.
* Keep Your Eyes Close On Your Trading Positions.
* Happy PIP Hunting Traders.
FXKILLA.

BITCOIN 's Bear Cycle has started according to the Dollar.It is one of the oldest charts around. Bitcoin (BTCUSD) vs U.S. Dollar Index (DXY). And perhaps one of the most accurate or to phrase it better, one of the most informative.
As you can see, every time the DXY (black trend-line) bottoms and rebounds (green Arcs), BTC tops and corrects (red Arcs), initiating its Bear Cycle.
Right now the news are far from favorable for Bitcoin's Bull Cycle case as the Dollar has broken above the previous Lower High and continues to rebound. That's a potential bottom, hence high probabilities for BTC to start a new Bear Cycle.
Would you trust this chart? Feel free to let us know in the comments section below!
-------------------------------------------------------------------------------
** Please LIKE 👍, FOLLOW ✅, SHARE 🙌 and COMMENT ✍ if you enjoy this idea! Also share your ideas and charts in the comments section below! This is best way to keep it relevant, support us, keep the content here free and allow the idea to reach as many people as possible. **
-------------------------------------------------------------------------------
💸💸💸💸💸💸
👇 👇 👇 👇 👇 👇

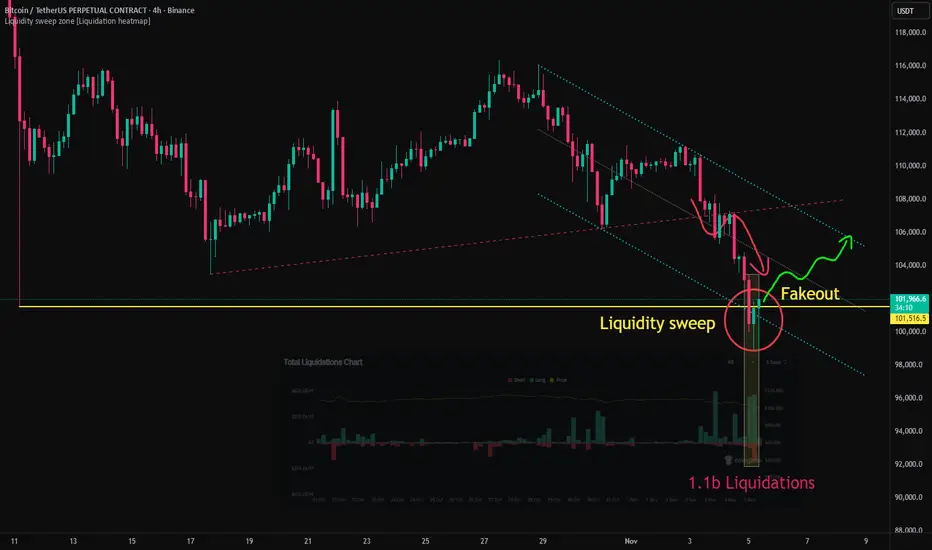
Bitcoin Drops Below 100K, Reversal Signal EmergingAfter breaking below the 107K support level, Bitcoin retested the area and then extended its decline.
As the downtrend intensified, the price broke through 102K, which was the low recorded during the large-scale liquidation event on October 11, and subsequently lost the psychological support level at 100K.
During the eight-hour period of this decline, approximately 1.1 billion USD worth of long positions were liquidated, accompanied by both a liquidity sweep and a fakeout pattern.
The simultaneous occurrence of large-scale liquidations, increased trading volume, a fakeout pattern, and the process of filling the CME gap indicates that multiple short-term reversal signals emerged in this zone.
From a technical standpoint, there is an increasing likelihood of two consecutive bullish candles with long lower wicks forming on the 4-hour chart, while the 12-hour chart also shows a high probability of developing a bullish candle with a long lower shadow.
This suggests a growing possibility of a short-term rebound, with the potential upside target near the upper boundary of the descending parallel channel.
How to use BTC Coinbase premium index indicator on tradingview1. What is the Coinbase Premium Index?
The Coinbase Premium Index is a metric that measures the price difference between a specific cryptocurrency listed on Coinbase and the price of Bitcoin on other major exchanges (especially Binance).
⌨︎ Calculation method:
(Coinbase BTC price - Other exchange BTC price) / Other exchange BTC price * 100
Positive premium: Occurs when the Coinbase price is higher than on other exchanges.
Negative premium: Occurs when the Coinbase price is lower than on other exchanges.
📌 If this content was helpful, please show your support with a boost and comments. Your encouragement is a great motivator for creating better analysis and content.
We will continue to upload various content such as chart analysis, trading strategies, and Bitcoin short-term signals, so please follow us.
2. Causes of Coinbase Premium
✔️ The main causes of Coinbase Premium are as follows:
Institutional investor demand: Coinbase is one of the largest regulated cryptocurrency exchanges in the U.S., and many institutional investors (hedge funds, asset management firms, etc.) purchase cryptocurrencies through Coinbase.
Large-scale buy orders from institutional investors can temporarily drive up prices on Coinbase, creating a premium.
Fiat currency inflow: Coinbase primarily facilitates USD-based transactions and is the most accessible platform for U.S. investors.
When new fiat currency flows into the cryptocurrency market, a strong inflow through Coinbase can lead to a premium.
Market sentiment and liquidity: If U.S. market investor sentiment is stronger than in other regions at certain times, or if liquidity on Coinbase is temporarily low, a price difference may occur.
Restrictions on fund movement: Due to anti-money laundering (AML) regulations, there may be time and cost restrictions on fund transfers between exchanges.
This limits arbitrage opportunities and helps maintain the premium.
Network congestion and fees: During cryptocurrency network congestion, transaction speeds may slow down or fees may increase, making rapid arbitrage between exchanges difficult.
3. How to Use the Coinbase Premium Index in Trading
The Coinbase Premium Index can primarily be used to predict market trends for major cryptocurrencies like Bitcoin (BTC).
📈 Bull market signal (positive premium):
Institutional buying inflow: A consistently high positive premium may indicate sustained buying pressure from institutional investors.
This can be interpreted as a signal of an overall market uptrend.
Trend reversal: If a negative premium persists in a bear market and then suddenly turns positive or its magnitude increases, it can be seen as a signal that a trend reversal is imminent, along with the inflow of institutional investors and improved market sentiment.
Bottom buying opportunity: If the Bitcoin price is falling and the Coinbase premium starts to rise above 0%, and at the same time, the daily net inflow into ETFs like BlackRock iShares Bitcoin Trust (IBIT) or Fidelity Wise Origin Bitcoin Trust (FBTC) significantly increases, this could signal a strong buying opportunity at the bottom.
📉 Bear market signal (negative premium):
Institutional selling pressure or decreased interest: A consistently low negative premium may indicate high selling pressure from institutional investors or decreasing interest in Bitcoin.
This can be interpreted as a signal of a market downtrend.
Bearish reversal signal: If a positive premium persists in a bull market and then turns negative or its magnitude sharply increases, it could be a top signal, indicating that institutional investors are taking profits or new buying inflows are decreasing.
Overbought/Correction signal: For example, if the Bitcoin price is soaring and the Coinbase premium turns negative, and at the same time, large net outflows are observed from ETFs such as BlackRock IBIT or Fidelity FBTC, it can be judged that the market is overbought or there is a possibility of correction, and a sell position can be considered.
4. Points to Note
🚨 When using the Coinbase Premium Index, pay attention to the following:
Combination with other indicators: The Coinbase Premium Index is just one auxiliary indicator.
A comprehensive judgment should be made by analyzing other technical analysis indicators such as moving averages, RSI, MACD, trading volume, as well as on-chain data and macroeconomic indicators.
Importance of ETF inflow/outflow data: Bitcoin spot ETFs from major asset managers such as BlackRock and Fidelity are one of the most direct indicators of actual institutional investor fund flows.
Analyzing these ETF's daily net inflow/outflow data along with the Coinbase premium can provide a more accurate understanding of institutional buying/selling pressure in the market.
Short-term volatility: The premium can fluctuate rapidly due to subtle changes in the market in the short term.
It is important to observe long-term trends rather than reacting too sensitively to temporary premium changes over a short period.
Changes in market conditions: The cryptocurrency market changes very rapidly.
There is no guarantee that patterns that were valid in the past will necessarily be valid in the future.
Various factors such as regulatory environments, policy changes of major exchanges, and the emergence of new market participants can affect the premium.
Limited scope of application: The Coinbase Premium Index tends to reflect the demand of institutional investors, mainly for Bitcoin. Its influence may be limited for altcoins.
5. Using the Coinbase Premium Index in TradingView
TradingView is a popular platform that provides various technical indicators and chart analysis tools. On TradingView, there are many custom indicators that can monitor the Coinbase Premium Index in real time.
These indicators usually calculate the price difference between Coinbase and Binance spot assets (e.g., BTCUSD/BTCUSDT) and display it in a separate panel at the bottom of the chart.
📊 TradingView indicator usage tips:
Search for indicators: Click the 'Indicators' button on the TradingView chart and type keywords such as 'Coinbase premium' or 'Coinbase vs Binance' in the search bar to find relevant indicators.
Real-time monitoring: These indicators retrieve real-time Bitcoin spot price data from Coinbase and Binance, calculate the premium, and visually display it on the chart. This allows investors to instantly confirm market price differences and incorporate them into their trading strategies.
Combination with other indicators: A powerful advantage of TradingView is that multiple indicators can be overlaid on one chart.
You can add the Coinbase Premium Index indicator along with the Bitcoin price chart, and if necessary, refer to BlackRock and Fidelity ETF inflow/outflow data separately to attempt multi-faceted analysis.
Alert settings: Use TradingView's alert function to set alerts when the Coinbase premium exceeds a certain level or enters/exits a certain range.
This helps to grasp market changes in real time and respond accordingly.
In conclusion, the Coinbase Premium Index is an indicator that can offer insight into the movements of institutional investors in the U.S. market, one of the major players in the cryptocurrency space.
When combined with Bitcoin spot ETF inflow/outflow data from major asset management firms such as BlackRock and Fidelity, it can significantly help to more clearly understand the actual flow of institutional funds and to judge market strength and the possibility of trend reversals.
However, rather than blindly trusting it, it is wise to use it as a supplementary tool to enhance a comprehensive understanding of the market by utilizing it with other analysis tools.

Bitcoin SHORT AnalysisBitcoin SHORT Analysis
Our sell zone aligns with the Point of Control (POC) and an unfilled H1 Order Block (OB) & SIBI, which serves as our Point of Interests (POI).
This zone was established following a displacement and the formation of a CISD (Change in State of Delivery), indicating a potential shift in market structure.
Currently, there is a significant draw on liquidity on the sell side, with the previous day’s low (PDL) forming equal lows, suggesting a liquidity pool beneath this level.
I anticipate that price may sweep this liquidity before initiating a substantial move towards the buy-side liquidity.
Given that there have been no major liquidity sweeps thus far, I expect price to respect the H1 Order Block.
Should the appropriate confirmation signals appear, I plan to enter a short position targeting the PDL as the primary objective. 🎯

BTC Correction Possible Before Further DropFenzoFx—Bitcoin continues its downtrend after dipping below the bearish fair value gap, now trading around $104,150.00. Immediate support sits at $103,400.00. A daily close below this level could trigger further downside, with thin liquidity below.
Technically, a correction may occur first, potentially pushing BTC toward $108,800.00 before resuming the decline. If $103,400.00 is breached, the next support levels are $100,000.00 and $98,000.00.

BITCOIN and stocks, 2021 vs 2025...Bitcoin (BTCUSD) could be entering a new Bear Cycle and as we've mentioned a few times recently, the 1W MA50 (blue trend-line) will play a big part at deciding that. This is basically the level that BTC is testing right now.
What may seem surprising to some, is that while Bitcoin has been correcting, the stock market (S&P500 illustrated by the black trend-line) has been rising making All Time High (ATH) after All Time High. This is not uncommon towards the end of Bull Cycles and has been particularly relevant during the Top of the previous (2021) Cycle.
As you can see, Bitcoin topped 7 weeks before stocks did, as we witnessed heavy profit taking and rotation of those (extraordinary) crypto gains towards stocks. Even the 1W RSI Lower Highs structure is similar between 2021 and 2025. The 4-year Cycle Theory in full confirmation (so far).
If the pattern plays out the exact same way time-wise as in 2021 (often it doesn't), we should be expecting stocks to top around the week of November 24. As for Bitcoin's trend after, following the 2022 blueprint wouldn't be unreasonable at all, as a 1W candle closing below the 1W MA50 would open the way to a 1W MA100 (green trend-line) test, multiple months of ranged price action between the two and then violent crash towards the 1M MA100 (red trend-line).
So do you think Bitcoin has topped and if yes, are stocks about to follow soon? Feel free to let us know in the comments section below!
-------------------------------------------------------------------------------
** Please LIKE 👍, FOLLOW ✅, SHARE 🙌 and COMMENT ✍ if you enjoy this idea! Also share your ideas and charts in the comments section below! This is best way to keep it relevant, support us, keep the content here free and allow the idea to reach as many people as possible. **
-------------------------------------------------------------------------------
💸💸💸💸💸💸
👇 👇 👇 👇 👇 👇

Bitcoin at the Brink: Breakdown or Breakout?Bitcoin is on the edge of a cliff . If this channel breaks downward, Bitcoin could fall below $100,000. But if the price respects this PRZ (Potential Reversal Zone), we can expect a solid rally toward $111,000, then $117,000, and eventually $125,000.
What do you think—will Bitcoin fall or rise?

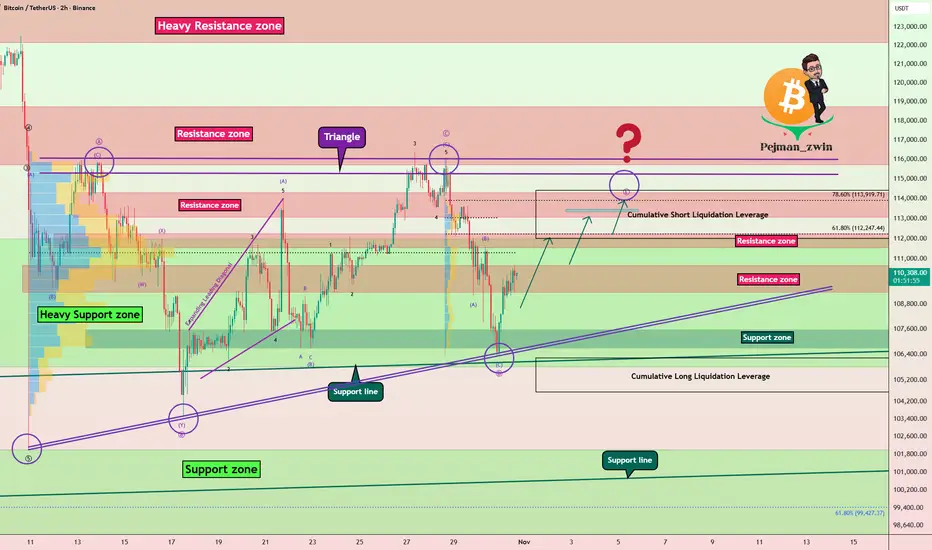
Bitcoin Correction Forming a Triangle – Which Way Next?Bitcoin ( BINANCE:BTCUSDT ), just as I expected in the previous idea , started to decline and reached its full target .
Over the past 20 days , Bitcoin has been moving in a ranging pattern that seems to be forming into a triangle shape .
From an Elliott Wave perspective , this corrective structure also appears to be a triangle , with its wave E potentially completing around the Resistance zone($114,300-$113,000) and the Cumulative Short Liquidation Leverage($114,424-$112,000) .
I expect that in the coming hours, Bitcoin can rise at least up to about $112,800 . If the upward momentum is strong enough , we might even see it reach the upper lines of the triangle .
Cumulative Long Liquidation Leverage: $106,231-$104,648
Please respect each other's ideas and express them politely if you agree or disagree.
Bitcoin Analysis (BTCUSDT), 2-hour time frame.
Be sure to follow the updated ideas.
Do not forget to put a Stop loss for your positions (For every position you want to open).
Please follow your strategy and updates; this is just my Idea, and I will gladly see your ideas in this post.
Please do not forget the ✅' like '✅ button 🙏😊 & Share it with your friends; thanks, and Trade safe.
How to use bitcoin CME gap auto finder indicator on tradingview📊 Bitcoin CME Gap Auto Detection and Visualization Indicator
The Pine Script-based indicator Bitcoin CME gaps multi-timeframe auto finder is a TradingView tool designed for cryptocurrency traders and investors to automatically identify and visualize Bitcoin CME (Chicago Mercantile Exchange) futures market gaps across multiple timeframes.
The Bitcoin CME futures market often creates price gaps after weekends or holidays when trading resumes. These gaps typically represent market imbalances, and many traders believe that price levels where gaps occur are likely to be revisited in the future.
This concept is known as the "Gap Fill" theory, where such gaps are considered key price zones that may act as support or resistance levels.
Traditionally, manually identifying these gaps requires checking multiple timeframes and verifying weekend/holiday sessions, which is both tedious and time-consuming.
Indicator Link: Bitcoin CME gaps multi-timeframe auto finder
🔑 Key Features of the Indicator
Automated Gap Detection: Saves traders the time and effort of manually searching for and marking gaps.
Cross-Exchange Synchronization: CME gap boxes are displayed in sync on other Bitcoin charts such as BTCUSDT, BTCUSDT.P, and BTCUSD.
Multi-Timeframe Analysis: Displays gaps simultaneously across various timeframes (5m, 15m, 30m, 1h, 4h, 1D), providing multiple market perspectives.
Visual Clarity: Clearly highlights gap zones, with major gaps emphasized for quick trader recognition.
Strategic Trading Support: Provides essential information for developing and executing gap fill-based trading strategies.
CME Gap History: Allows users to review all past CME gaps formed in historical candles.
Alert Functionality: Sends real-time notifications when new gaps are detected, helping traders respond promptly to market changes.
⚙️ Main Functions and Usage
This indicator provides a wide range of customizable input options, allowing traders to adapt it to their specific analytical needs.
CME Gap Settings:
CME Symbol for Gaps: Specifies the symbol used to fetch CME futures data. The default is “BTC1!” (Bitcoin CME Futures).
Minimum gap percentage (%): Sets the minimum price movement recognized as a gap, allowing users to filter out minor fluctuations and focus on significant ones.
Display Timeframes:
Enables or disables gap visualization for each timeframe (5m, 15m, 30m, 1h, 4h, 1D). Users can activate only the timeframes they prefer to analyze.
Box Colors:
Customizable colors for each timeframe and gap direction (upward/downward), allowing easy visual distinction between gap types.
Box Extension Lengths (Bars):
Sets the number of bars the gap box extends to the right for each timeframe.
This visually illustrates how gap zones can remain relevant as future support/resistance levels.
Label Settings:
Show labels: Toggles the display of percentage labels for gaps.
Label position: Adjusts where the label appears inside the box.
Label text size: Controls the label font size.
Highlight Settings:
Highlight gap % (>=): Emphasizes gaps larger than a specified percentage, providing visual alerts for major gaps.
Highlight label text color: Sets the text color for highlighted gap labels.
Highlight box color: Defines the color for highlighted gap boxes.
Highlight box border width: Adds adjustable border thickness to highlighted gap boxes, making significant gaps stand out even more.
Alert Settings:
Enable Alerts: Toggles alert activation when gaps occur.
Alert Timeframe: Choose specific timeframes for receiving alerts or enable alerts for all timeframes.
🚀 How It Works
The indicator retrieves CME futures data (BTC1!) and compares the previous bar’s close/high/low with the current bar’s open across multiple timeframes to identify gaps.
It is specifically designed to detect gaps that occur when the market reopens after weekends or holidays.
Once a gap is detected, the indicator draws a box to visually mark it on the chart.
If the gap size exceeds the user-defined threshold, the box is emphasized using a highlight color and thicker border for greater visibility.
💡 Trading Strategies and Applications
Support and Resistance Identification:
CME gap zones often act as strong support or resistance levels.
Unfilled gaps may indicate potential price return zones, serving as signals for possible reversals or trend continuation.
Gap Fill Strategy:
Many traders believe that gaps tend to be filled eventually.
This indicator can help identify potential entry and exit points for gap fill trades.
For example, after a downward gap, traders might consider entering a long position when the price begins to recover toward the upper boundary of the gap and close the trade once the gap is filled.
Market Sentiment Analysis:
The size and frequency of gaps can reflect strong market movements or uncertainty.
Large gaps often indicate intense buying or selling pressure, and highlighted gaps help quickly identify these significant market events.
Multi-Timeframe Confirmation:
When gaps occur simultaneously across several timeframes, it underscores the importance of that price zone.
For instance, if a gap appears on both the 1-hour and 4-hour charts, traders should pay close attention to potential price reactions at that level.
Opportunity Detection via Alerts:
By enabling alerts, traders can monitor market changes in real time and act immediately when new gaps form — particularly useful for short-term or high-frequency strategies requiring fast decisions.
🚨 Cautions
Gap fills are not guaranteed: While gaps often tend to be filled, not all of them will, and some may take a long time.
Time zone configuration: Since the CME operates in specific trading hours, make sure the indicator’s GMT+9 timezone matches your local trading setup on TradingView.
Avoid using in isolation: Combine this indicator with other technical tools (e.g., moving averages, RSI, volume indicators) to enhance reliability and accuracy.
※ If you found the Bitcoin CME gap auto finder indicator helpful, please give it a like and follow.
BITCOIN 's worst Uptober in 11 years. Will selling continue?Bitcoin (BTCUSD) just closed October on a -3.89% loss, marking only the second red October since 2018 (-3.83%) and the worst since 2014 (-12.95%). This comes against the popularized 'Uptober' moniker, which relates to BTC's historically strong gains for this month.
So what's next? Things may get even worse if BTC repeats the Jan - Feb 2025 fractal and breaks below its current Higher Lows trend-line. As you can see, since the August 14 2025 High, the market has been on a similar pattern as December 2024 - February 2025.
Right now we are on the rejection made on the Lower Highs 2 trend-line (blue circle) on the 1D MA50 (blue trend-line) and on the 0.5 Fibonacci retracement level. With the first Lower Highs 2 rejection being similar among the two fractals (around -17%), we can expect an equally symmetrical sell-off if the Higher Lows break.
On February 24 2025, that break-out completed a -32% fall from its All Time High (ATH) just below the 2.0 Fibonacci extension. If the Higher Lows break-out does happen on the current sequence as well, we may see another -32% decline, which this time is exactly on the 2.0 Fib ext. This time we have the 1W MA100 (red trend-line) to be mindful of, where we can expect contact to be made around $87000.
Do you think BTC can dip this low? Feel free to let us know in the comments section below!
-------------------------------------------------------------------------------
** Please LIKE 👍, FOLLOW ✅, SHARE 🙌 and COMMENT ✍ if you enjoy this idea! Also share your ideas and charts in the comments section below! This is best way to keep it relevant, support us, keep the content here free and allow the idea to reach as many people as possible. **
-------------------------------------------------------------------------------
💸💸💸💸💸💸
👇 👇 👇 👇 👇 👇

BITCOINS - ANOTHER OPPORTUNITYTeam,
last week we went long BITCOINS at 108k, then add more at 107500, with target at 109-111k
TARGET HIT
We are now entered at 107.5k, will add more at 107k
WITH STOP LOSS AT 105K
Target 1 at 109-111.5k
Target 2 at 113-115k
Once it hits 1st target, take a partial 70% and bring the stop loss to BE for the next target.

BITCOIN Has this huge Bearish Divergence started the Bear Cycle?Bitcoin (BTCUSD) continues to be under heavy pressure in the past 4 weeks since the October 06 All Time High (ATH) and finds itself battling to hold the 1W MA50 (blue trend-line) as Support. That trend-line has been basically the Support of this Bull Cycle since March 2023, and acted as the most optimal long-term buy level.
** Has the Bull Cycle ended? **
However this Bull Cycle may have very well come to an end already as the 1W RSI has been long exhibiting the same kind of bearish pattern (Lower Highs trend-line), while also having completed the 4-year Cycle, that all previous Bull Cycles formed on their respective tops. This is a huge Bearish Divergence formation as it goes against the price's Higher Highs, indicating trend exhaustion.
As you can see that 1 RSI Lower Highs trend-line formed the November 2021, December 2017 and December 2013 Cycle Tops. Even worse, the current Lower Highs trend-line has been going on since the March 11 2024 High. If BTC closes a 1W candle below its 1W MA50, it has greater probabilities to confirm the start of the new Bear Cycle as all previous ones did on such break-out.
** If yes, how much can it drop? **
Now, it might not be too relevant at this time yet, but as far as how low the Bear Cycle can go to before it bottoms, there are three potential levels of interest where long-term investors can Dollar Cost Average (DCA).
The January 2015 Bear Cycle bottom was formed on the 1W MA200 (orange trend-line). Then the December 2018 Bear Cycle bottom was formed on the 1W MA200 and the 0.382 Fibonacci retracement level from the previous bottom. The last Bear Cycle has its bottom below the 1W MA200 and on the next Fib in line, the 0.5 level. The decline on each Bear Cycle that followed decelerated and was less than the previous (-86.70% to -84.19% to -77.22%).
If the new Bear Cycle has already started then the first level for a potential bottom is again the 0.382 Fib around $58000 where contact may potentially be made with the 1W MA200 as well. If it follows the previous Bear Cycle and bottoms on the 0.5 Fib, it will also be below the 1W MA200 around $45000. If on the other hand it goes a Fib level further, as the last two Cycles did, we are looking at the 0.618 Fib as a potential strong bottom candidate around $35000. That will also be a -70.76% decline from the Top, which will be -7% less than the previous Bear Cycle, which is also the difference that the 2022 Bear Cycle had from the 2018 one.
So what do you think? Has the Bull Cycle ended already and if yes, how low can the new Bear Cycle go? Feel free to let us know in the comments section below!
-------------------------------------------------------------------------------
** Please LIKE 👍, FOLLOW ✅, SHARE 🙌 and COMMENT ✍ if you enjoy this idea! Also share your ideas and charts in the comments section below! This is best way to keep it relevant, support us, keep the content here free and allow the idea to reach as many people as possible. **
-------------------------------------------------------------------------------
💸💸💸💸💸💸
👇 👇 👇 👇 👇 👇

BITCOIN This is what separates 128k from 104k.Bitcoin (BTCUSD) just broke above its 1D MA50 (blue trend-line) for the first time in 2 weeks and only days after it got rejected there. A 1D candle closing above it will be a strong bullish signal.
As BTC has been trading within a Megaphone pattern similar to the December 2024 - April 2025 one, a closing above the 1D MA50 might put the structure in a similar situation as April 17. As you can see that Megaphone also had a 1D MA50 rejection preceding the break-out and before that also, two Lower Lows near the 1W MA0 (red trend-line).
What it hasn't had (so far?) is a clear touch of the 1W MA50 (as on April 07) and a 1D MACD Higher Lows Bullish Divergence.
As a result, both scenarios are open for now. Until it closes above the 1D MA50, a 1W MA50 test remains possible around $104000. A closing above the 1D MA50 though strengthens the probability of a 1.1 Fibonacci extension rally at $128000.
What do you think is more likely to happen? Feel free to let us know in the comments section below!
-------------------------------------------------------------------------------
** Please LIKE 👍, FOLLOW ✅, SHARE 🙌 and COMMENT ✍ if you enjoy this idea! Also share your ideas and charts in the comments section below! This is best way to keep it relevant, support us, keep the content here free and allow the idea to reach as many people as possible. **
-------------------------------------------------------------------------------
💸💸💸💸💸💸
👇 👇 👇 👇 👇 👇

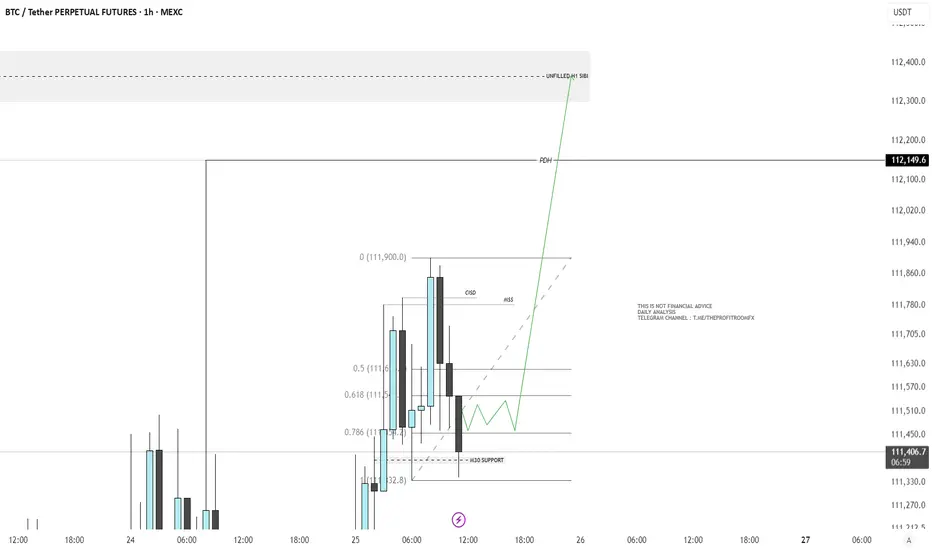
Bitcoin Weekend AnalysisIf the current H1 candle closes within the range of the previous candle, we may anticipate a potential movement toward the buy-side.
There is a notable draw on liquidity, with the Previous Daily High (PDH) and an unfilled H1 SIBI (Sell-Side Imbalance, Buy-Side Inefficiency) serving as key areas of interest.
Recently, we’ve also observed a Market Structure Shift (MSS) alongside a Change in Short-Term Direction (CISD)on the H1 timeframe.
In addition, price has shown multiple rejections from a support level formed by a M30 Fair Value Gap (FVG), reinforcing this area as a short-term accumulation zone.
Based on this structure, I expect price to accumulate between the 0.786 and 0.618 Fibonacci retracement levels, before redistributing toward our Draw On Liquidity (DOL).
Overall, my bias remains bearish, anticipating a sell opportunity after the SIBI imbalance has been filled and the PDH liquidity has been swept.