BITCOIN Did the 1W MA20 just save the day??On one of our recent analyses we talked about the importance of the 1W MA20 (red trend-line) for Bitcoin (BTCUSD) and the continuation of its non-stop bullish trend since the April 07 2025 Low.
As mentioned then, BTC was likely to extend the trend as long as the 1W candles keep closing above the 1W MA20. The three times a candle didn't, since June 2023, the price declined more to hit (or come very close to) the 1W MA50 (blue trend-line).
Last week was again a successful 1W candle close above the 1W MA50, third time in a month (since August 25) to do so. Technically that solidifies it as a Support and as long as it holds, Bitcoin has more probabilities to repeat at least a +96.38% rally ('weakest' rally it had on this Bull Cycle) and test $145000.
So do you think the 1W MA50 just saved the day and a new rally is ahead of us? Feel free to let us know in the comments section below!
-------------------------------------------------------------------------------
** Please LIKE 👍, FOLLOW ✅, SHARE 🙌 and COMMENT ✍ if you enjoy this idea! Also share your ideas and charts in the comments section below! This is best way to keep it relevant, support us, keep the content here free and allow the idea to reach as many people as possible. **
-------------------------------------------------------------------------------
💸💸💸💸💸💸
👇 👇 👇 👇 👇 👇
Bitcoinsignals

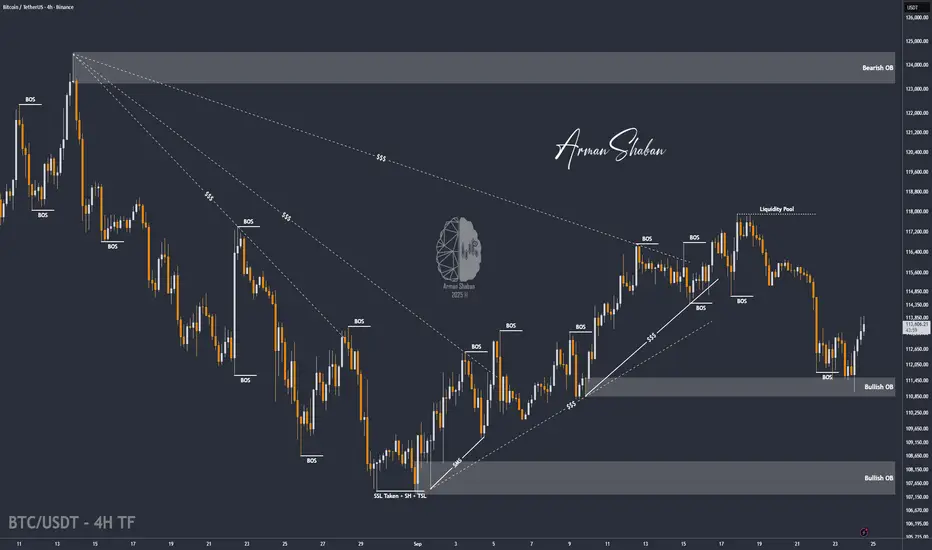
BTC/USDT | BTC Bounce After $111K Dip – Liquidity Gap in FocusBy analyzing the Bitcoin chart on the 4-hour timeframe, we can see that after a heavy correction down to $111,000, the price found demand again and is now trading around $113,600.
I expect Bitcoin to continue rising to fill the liquidity gap, with the first target at $114,150. Other targets and scenarios will be shared tomorrow!
Please support me with your likes and comments to motivate me to share more analysis with you and share your opinion about the possible trend of this chart with me !
Best Regards , Arman Shaban
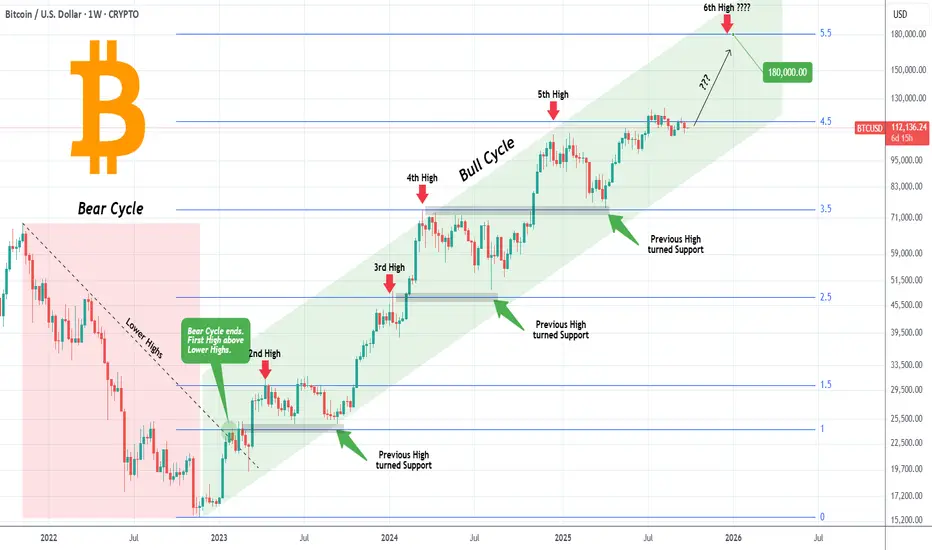
BITCOIN Is there time left for one final run??Bitcoin (BTCUSD) has been trading within a Channel Up pattern through the entirety of its Bull Cycle. The key characteristic of this pattern, which has also helped us at taking profits during each phase in timely manner, has been that every High since the Bear Cycle's Lower Highs trend-line broke, has been on a +0.5 Fibonacci extension interval.
As you can see, starting from Fib 1.5 ext, BTC has fulfilled the pattern by making Highs on the 2.5, 3.5 and 4.5 Fibs so far. What technically remains plausible until the end of the year is the 5.5 Fib ext, which sits at $180k.
With the 4-year Cycle theory suggesting a Cycle Top a little before the end of the year, is it realistic to expect this Target? Do you think there's time for BTC to make one final run like this? Feel free to let us know in the comments section below!
-------------------------------------------------------------------------------
** Please LIKE 👍, FOLLOW ✅, SHARE 🙌 and COMMENT ✍ if you enjoy this idea! Also share your ideas and charts in the comments section below! This is best way to keep it relevant, support us, keep the content here free and allow the idea to reach as many people as possible. **
-------------------------------------------------------------------------------
💸💸💸💸💸💸
👇 👇 👇 👇 👇 👇
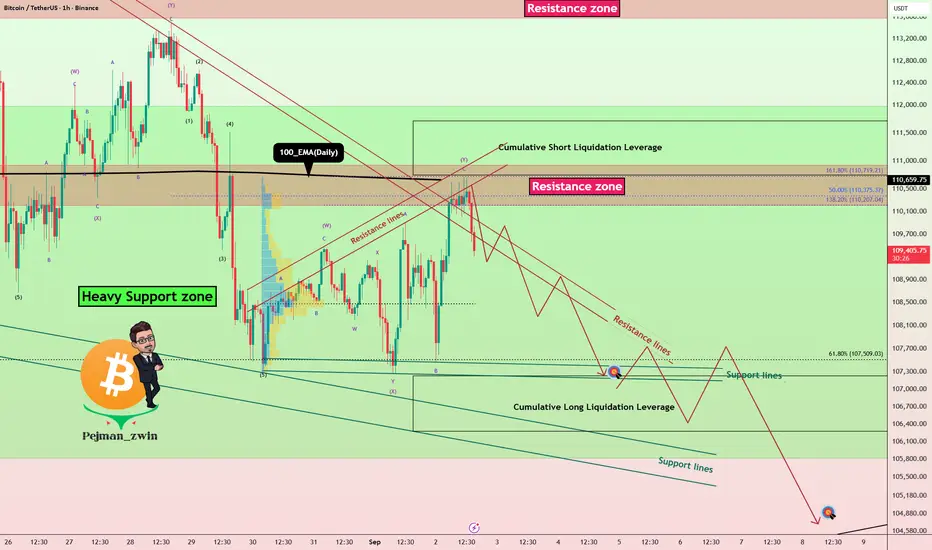
Bitcoin Roadmap: Can BTC Hold the $108K Before Next Big move!?Bitcoin( BINANCE:BTCUSDT ) managed to break the Support zone($110,920-$109,900) and Support lines yesterday with the help of a Bearish Marubozu Candle(the Marubozu candle volume was acceptable).
Bitcoin is still moving in the Heavy Support zone($112,000-$105,800) and near the important Support line, Potential Reversal Zone(PRZ) , Cumulative Long Liquidation Leverage($108,165-$107,000).
In terms of Elliott Wave theory, Bitcoin appears to be completing microwave 5 of the main wave 3. Microwave 4 of the main wave 3 is of the Contracting Triangle type, and the main wave 3 is of the extended type.
I expect Bitcoin to start rising and attack the Resistance lines after completing the main wave 3 from the Potential Reversal Zone(PRZ) , Support zone($108,200-$107,240), and Important Support line.
Cumulative Short Liquidation Leverage: $110,624-$109,836
Note: If Bitcoin touches $106,800, we can expect a break of the Heavy Support zone($112,000-$105,800).
Note: If Bitcoin goes above $111,000, we can expect a renewed rise in Bitcoin.
---------------------------------------------
One of the indices that helps the Roadmap of Bitcoin and other tokens is the USDT.D%.
USDT.D% currently seems to have managed to break the heavy resistance zone and this is NOT good news for Bitcoin and other tokens, and perhaps a further correction in the crypto market is on the way.
USDT.D%’s roadmap for me is that it is almost in line with today’s analysis of Bitcoin.
---------------------------------------------
Please respect each other's ideas and express them politely if you agree or disagree.
Bitcoin Analysis (BTCUSDT), 1-hour time frame.
Be sure to follow the updated ideas.
Do not forget to put a Stop loss for your positions (For every position you want to open).
Please follow your strategy and updates; this is just my Idea, and I will gladly see your ideas in this post.
Please do not forget the ✅' like '✅ button 🙏😊 & Share it with your friends; thanks, and Trade safe.

Bitcoin Outlook: From Support Bounce to Short Liquidation TargetBitcoin ( BINANCE:BTCUSDT ) moved as I expected in my previous idea ( Long and Short positions hit their targets ).
Bitcoin is currently moving near the Resistance zone($114,820-$113,170) , Resistance line, and the Monthly Pivot Point , and seems to have failed to break 100_EMA(Daily) .
In terms of Elliott Wave theory , Bitcoin completed wave 5 as I expected by attacking 100_EMA(Daily) and Heavy Support zone($112,000-$105,800) , and we can expect more bullish waves .
I expect Bitcoin to break the Resistance line in the coming hours and attack the Resistance zone ($114,820-$113,170) and the Cumulative Short Liquidation Leverage ($114,334-$113,400) .
Cumulative Long Liquidation Leverage: $110,950-$110,350
Note: If Bitcoin goes above $115,000, we should expect Bitcoin to rise again.
Please respect each other's ideas and express them politely if you agree or disagree.
Bitcoin Analysis (BTCUSDT), 1-hour time frame.
Be sure to follow the updated ideas.
Do not forget to put a Stop loss for your positions (For every position you want to open).
Please follow your strategy and updates; this is just my Idea, and I will gladly see your ideas in this post.
Please do not forget the ✅' like '✅ button 🙏😊 & Share it with your friends; thanks, and Trade safe.
BITCOIN Can this pattern hold one last time?Bitcoin (BTCUSD) is holding (so far) its 1W MA20 (red trend-line) as mentioned on our previous analysis, which is critical for the continuation of the bullish trend.
Today however, we bring you a pattern that may have gone unnoticed and as long as it holds, the market should be expecting a new High.
That is the transition of a former Resistance level (formed from a previous High) that turns into Support (new Low), which generates a rally that so far has measured a minimum +45.73% (from the High).
However every such Low was priced at or very close to the 1W MA50 (blue trend-line). This time the 1W MA50 is at 100k and a way for this pattern to be fulfilled, BTC should at least trade sideways until it comes close to the 1W MA50.
In any case, as long as the Support level holds, a +45.73% rise, would take us to $157000.
Do you think we have chances for that? Feel free to let us know in the comments section below!
-------------------------------------------------------------------------------
** Please LIKE 👍, FOLLOW ✅, SHARE 🙌 and COMMENT ✍ if you enjoy this idea! Also share your ideas and charts in the comments section below! This is best way to keep it relevant, support us, keep the content here free and allow the idea to reach as many people as possible. **
-------------------------------------------------------------------------------
💸💸💸💸💸💸
👇 👇 👇 👇 👇 👇

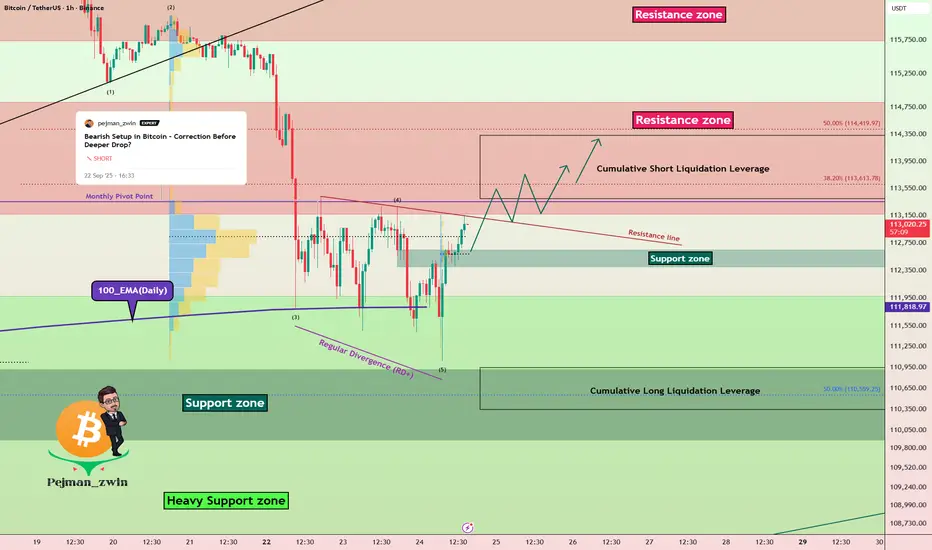
Bearish Setup in Bitcoin – Correction Before Deeper Drop?Bitcoin ( BINANCE:BTCUSDT ) started to decline and broke the ascending channel and Support zone($114,820-$113,170) with the help of the Bearish Flag Pattern , as I expected in the previous idea update .
Do you think Bitcoin can go below $105,000 !?
Bitcoin is once again approaching 100_EMA(Daily) and the Heavy Support zone($112,000-$105,800) .
From the perspective of Elliott Wave theory , Bitcoin appears to have completed the Zigzag Correction(ABC/5-3-5) in the ascending channel, and now it seems that we should expect bearish waves .
I expect Bitcoin to FAIL to break the 100_EMA(Daily) with one attack and have an upward correction to Fibonacci levels and Cumulative Short Liquidation Leverage($114,098-$113,229) , and then re-attack the Heavy Support zone($112,000-$105,800) and 100_EMA(Daily) .
Cumulative Long Liquidation Leverage: $111,850-$110,421
Note: If Bitcoin goes above $115,000, we should expect Bitcoin to rise again.
Note: There is also a possibility that the SPX500 index( SP:SPX ) will also correct and, given Bitcoin's correlation with this index, cause Bitcoin to correct further.
Please respect each other's ideas and express them politely if you agree or disagree.
Bitcoin Analysis (BTCUSDT), 4-hour time frame.
Be sure to follow the updated ideas.
Do not forget to put a Stop loss for your positions (For every position you want to open).
Please follow your strategy and updates; this is just my Idea, and I will gladly see your ideas in this post.
Please do not forget the ✅' like '✅ button 🙏😊 & Share it with your friends; thanks, and Trade safe.

BITCOIN The hidden pivot of the Bollinger Bands (140k or 100k?).Bitcoin (BTCUSD) is testing again the basis (black trend-line) of the 1W Bollinger Bands (BB), just 3 weeks after it held and initiated a rebound.
On this chart you can see that since July 2023, every time BTC closed a 1W candle below the BB basis level, the price pulled-back to its 1W MA50 (blue trend-line) and then rebounded. That is its ultimate long-term Support so far.
As a result, all eyes should be on this week's closing. Below the BB basis, we should most likely seek the 1W MA50 a little above the $100000 mark. Ideally, it should coincide with a 1W RSI Support Zone test (holding since September 2023).
If the BB basis holds though, we should extend the BB top within the $130-140k Zone.
What do you think will come first? Feel free to let us know in the comments section below!
-------------------------------------------------------------------------------
** Please LIKE 👍, FOLLOW ✅, SHARE 🙌 and COMMENT ✍ if you enjoy this idea! Also share your ideas and charts in the comments section below! This is best way to keep it relevant, support us, keep the content here free and allow the idea to reach as many people as possible. **
-------------------------------------------------------------------------------
💸💸💸💸💸💸
👇 👇 👇 👇 👇 👇

BITCOIN Drop back towards 100k or rise to $130k? What's next?Bitcoin (BTCUSD) is at critical crossroads as it is pulling back today towards its 1W MA20 (red trend-line). We've discussed before of the importance of this level as a technical Support that has fueled the final BTC rallies during past Cycles. As this held on August 25 and closed the candle above it, we expected that to be this confirmation.
Today's decline however jeopardizes this model, in fact the Parabola pattern of the current (2023-2025) Bull Cycle, has always been tested when Bitcoin closed below its 1W MA20. As you can see it has always declined and touched its 1W MA50 (blue trend-line) to form a Support and start the next Bullish Leg.
The 1W MA50 is currently just below the $100k level so an aggressive drop below the 1W MA20 (candle closing) can take us around that area in a matter of 2-3 weeks. If however the 1W MA20 holds, it is more likely to see a rise to $130000 at least. And that is what the Sine Waves Tops imply (red Rectangle peak formation, with a 1W MA50 test more likely to occur in late January 2026.
So what do you think? Is $100k or $130k next for Bitcoin? Feel free to let us know in the comments section below!
-------------------------------------------------------------------------------
** Please LIKE 👍, FOLLOW ✅, SHARE 🙌 and COMMENT ✍ if you enjoy this idea! Also share your ideas and charts in the comments section below! This is best way to keep it relevant, support us, keep the content here free and allow the idea to reach as many people as possible. **
-------------------------------------------------------------------------------
💸💸💸💸💸💸
👇 👇 👇 👇 👇 👇

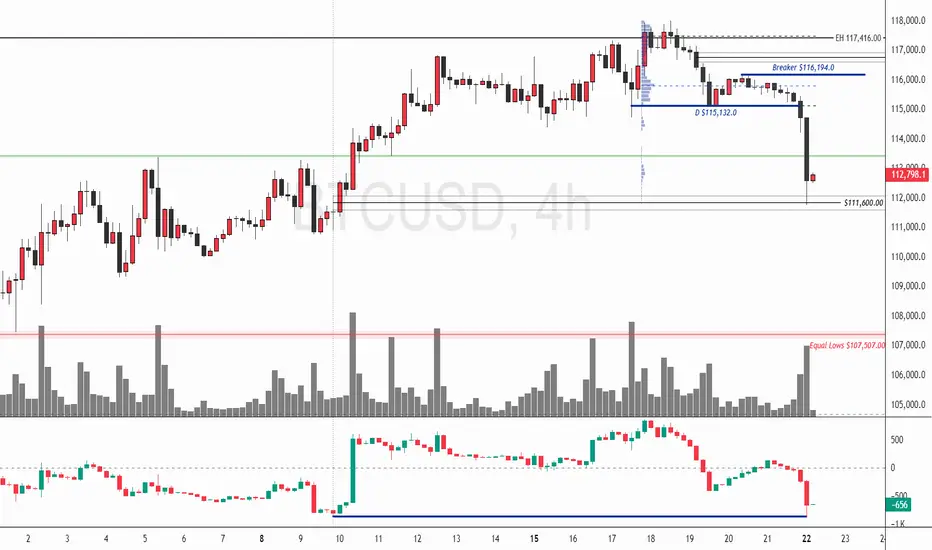
Bitcoin: Volume Spike Signals Temporary ReliefFenzoFx—Bitcoin sold off early in the week, now trading near $112,670.00. A high-volume 4-hour candle tapped the bullish FVG and ended with a wick, suggesting partial profit-taking by bears.
The short-term trend remains bearish due to displacement below $115,132.00 and active bearish FVGs. BTC/USD may consolidate near resistance before resuming its downtrend. If price rises toward the low-volume node near $115,132.00 and holds bearish momentum, it could target the equal lows at $107,507.00.
The bearish outlook is invalidated if BTC/USD closes above the breaker block at $116,194.00.
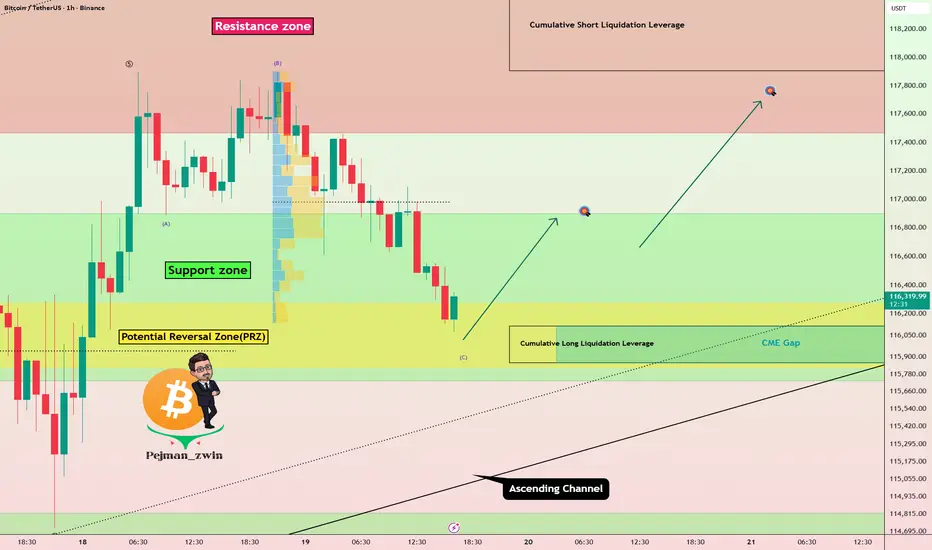
Key PRZ Ahead for Bitcoin – Bounce or Breakdown?Bitcoin ( BINANCE:BTCUSDT ) moved as I expected in my previous idea and rose to the Resistance zone($118,580-$117,460) .
First of all, let me say that this is a short-term Bitcoin analysis .
Bitcoin is filling the CME Gap($116,115-$115,860) and is moving near the Support zone($116,900-$115,730) [, Cumulative Long Liquidation Leverage($115,555-$114,424) , Potential Reversal Zone(PRZ) , and the lower line of the ascending channel .
In terms of Elliott Wave theory , Bitcoin appears to be completing a wave C of the Expanding Flat(ABC/3-3-5) .
I expect Bitcoin to rise to at least $116,910 if it even manages to break the ascending channel.
Second Target: $117,760
Stop Loss(SL): $$115,300
Cumulative Short Liquidation Leverage: $118,965-$117,906
Please respect each other's ideas and express them politely if you agree or disagree.
Bitcoin Analysis (BTCUSDT), 1-hour time frame.
Be sure to follow the updated ideas.
Do not forget to put a Stop loss for your positions (For every position you want to open).
Please follow your strategy and updates; this is just my Idea, and I will gladly see your ideas in this post.
Please do not forget the ✅' like '✅ button 🙏😊 & Share it with your friends; thanks, and Trade safe.
BITCOIN This is where the fat lady sings..Well this is o secret. We've pointed that out many times before but it couldn't be more relevant than now as Bitcoin (BTCUSD) is approaching the end of its 4-year Cycle.
So where does the 'fat lady sing'? According to the 1M RSI, at the top of its historic 15-year Channel Down. Which by the end of this year it should be above (the vastly oversold condition of) 90.00.
Is there enough time to left to do so? Feel free to let us know in the comments section below!
-------------------------------------------------------------------------------
** Please LIKE 👍, FOLLOW ✅, SHARE 🙌 and COMMENT ✍ if you enjoy this idea! Also share your ideas and charts in the comments section below! This is best way to keep it relevant, support us, keep the content here free and allow the idea to reach as many people as possible. **
-------------------------------------------------------------------------------
💸💸💸💸💸💸
👇 👇 👇 👇 👇 👇

BITCOIN 1W Stoch RSI completed a Bullish Cross. Expect new ATH.Bitcoin (BTCUSD) just completed a Bullish Cross on its 1W STOCH RSI and that's the first time it does so since April 07 2025. That was as we know, the previous market bottom of the Trade War correction.
In fact, every 1W STOCH RSI Bullish Cross has been a buy signal within this Bull Cycle's Channel Up (since November 2022), most of which huge. The April 2025 Bullish Leg rose by +65.92% and that has been the 'weakest' one of this Channel Up.
As a result, if we get the bear minimum of +65.92% this time around too, expect a new High around $175000, which should be the Cycle Top and in our opinion the absolute maximum that this Cycle can give.
Do you think we will go that high? Feel free to let us know in the comments section below!
-------------------------------------------------------------------------------
** Please LIKE 👍, FOLLOW ✅, SHARE 🙌 and COMMENT ✍ if you enjoy this idea! Also share your ideas and charts in the comments section below! This is best way to keep it relevant, support us, keep the content here free and allow the idea to reach as many people as possible. **
-------------------------------------------------------------------------------
💸💸💸💸💸💸
👇 👇 👇 👇 👇 👇

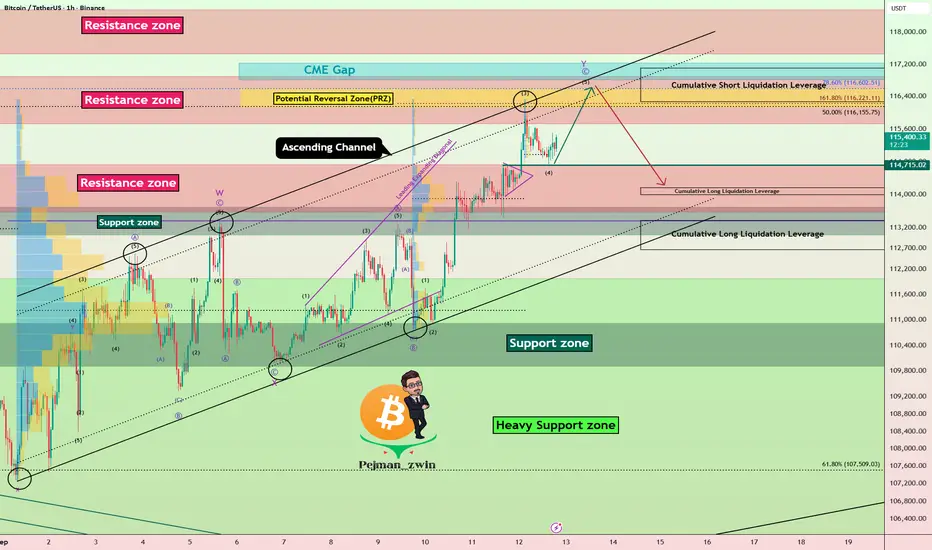
Bitcoin Roadmap | Short termBitcoin ( BINANCE:BTCUSDT ) has been experiencing a lot of volatility over the past 10 days, and the reasons for these movements could be the announcement of US indices + geopolitical issues Those who were in favor of Bitcoin caused Bitcoin to pump .
Bitcoin's movements over the past 10 days have managed to form an Ascending Channel .
In terms of Elliott Wave theory , Bitcoin appears to be completing microwave 5 of microwave C of the main wave Y .
I expect Bitcoin to try to complete main wave Y , and if we find signs of a reversal in the Resistance zone($116,900-$115,730) and Potential Reversal Zone(PRZ) , we can expect a further decline . Also, it is expected that the CME Gap($117,235-$116,820) will eventually be completed in the main wave Y .
Cumulative Long Liquidation Leverage: $114,165-$113,989
Cumulative Long Liquidation Leverage: $113,370-$112,664
Cumulative Short Liquidation Leverage: $117,102-$116,266
Please respect each other's ideas and express them politely if you agree or disagree.
Bitcoin Analysis (BTCUSDT), 1-hour time frame.
Be sure to follow the updated ideas.
Do not forget to put a Stop loss for your positions (For every position you want to open).
Please follow your strategy and updates; this is just my Idea, and I will gladly see your ideas in this post.
Please do not forget the ✅' like '✅ button 🙏😊 & Share it with your friends; thanks, and Trade safe.
BITCOIN Will it pull back??Bitcoin (BTCUSD) just formed a 4H Golden Cross, technically a bullish pattern, which usually emerges at the start of uptrends.
Such a formation emerged on both main Channel Up patterns since the April 07 Trade War bottom. The interesting feature however is that, following every 4H Golden Cross, the price always pulled back to its 4H MA200 (orange trend-line).
With BTC having started the week on the back foot, the 4H MA200 currently stands at $113600. Ahead of the Fed Rate Decision this week, a 'volatility' pull-back would align the news with this technical need.
Do you think we'll get that pull-back? Feel free to let us know in the comments section below!
-------------------------------------------------------------------------------
** Please LIKE 👍, FOLLOW ✅, SHARE 🙌 and COMMENT ✍ if you enjoy this idea! Also share your ideas and charts in the comments section below! This is best way to keep it relevant, support us, keep the content here free and allow the idea to reach as many people as possible. **
-------------------------------------------------------------------------------
💸💸💸💸💸💸
👇 👇 👇 👇 👇 👇

Bitcoin: Bullish Bias Strengthens FenzoFx—Bitcoin remains bullish, targeting recent highs at $117,416.00. Currently, BTC is consolidating near $115,000.00, aligning with a bullish fair value gap and support at $114,464.00. Today’s liquidity sweep below the FVG’s mean threshold reinforces the bullish bias.
Immediate resistance stands at $115,652.00. A break above this level may resume the uptrend toward $117,416.00. However, if price drops below $114,464.00, the bullish outlook should be reconsidered.

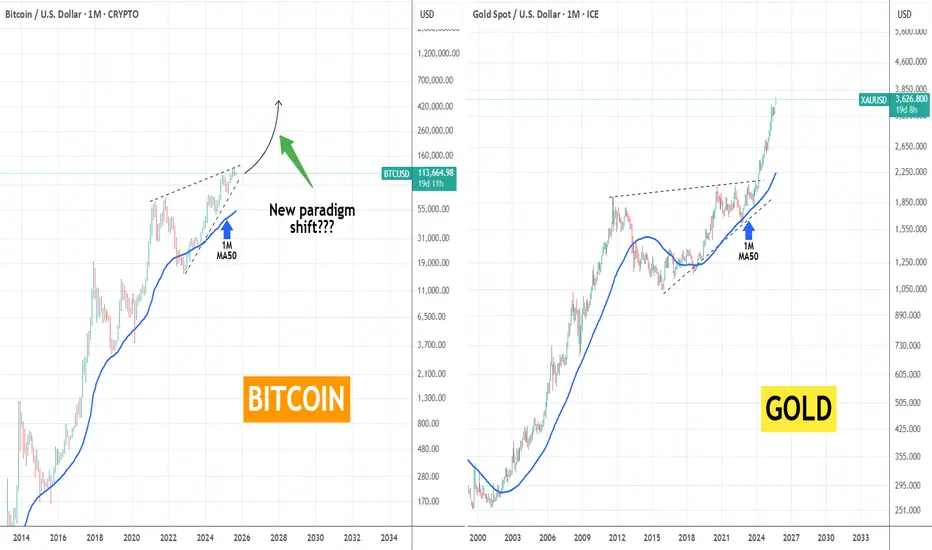
BITCOIN vs GOLD Is something like that inevitable?Bitcoin (BTCUSD) has been often described as the digital Gold, mainly due to its scarcity (fixed supply), compared to Gold's value as a safe haven asset. So what's the deal with this comparison chart?
If you follow us for long, you should know that we are strong believers of BTC's 4-year Cycle theory, which has served us so well and helped us buy and sell near cyclical bottoms and tops respectively.
However, as the market matures (remember Bitcoin is 'only' 16 years old), it could/ should eventually break this pattern upwards into aggressively higher valuations, which could be the shift to a new paradigm as mass adoption kicks in.
As a result, could it make a vicious bullish break-out above this Triangle in a similar way as Gold past 2024? Essentially, can we argue that Gold is leading the way as the traditional asset? Or the 4-year Cycle will go on for much longer than many think?
We are very interested in your thoughts. Feel free to let us know in the comments section below!
-------------------------------------------------------------------------------
** Please LIKE 👍, FOLLOW ✅, SHARE 🙌 and COMMENT ✍ if you enjoy this idea! Also share your ideas and charts in the comments section below! This is best way to keep it relevant, support us, keep the content here free and allow the idea to reach as many people as possible. **
-------------------------------------------------------------------------------
💸💸💸💸💸💸
👇 👇 👇 👇 👇 👇
BTC – Base Before Break?After the ATH at 125k on 25 Aug, BTC pulled back to 107k and has been consolidating. The latest structure looks more like a base for reversal than a continuation pattern: price is back into the 113.3k zone, which coincides with resistance, and we’ve printed a sequence of higher lows—a classic pressure build under supply.
What I’m watching
• Bullish trigger: A clean break/close above 113.3k opens the path toward 120k (both a technical target and a psychological level).
• Continuation potential: If 120k is reclaimed with momentum, a 123–125k retest comes into play.
• Support: 110k is the line in the sand; below it, risk shifts to 100k zone (the correction low).
Trading plan
• Breakout: Look for acceptance above 113.5k and a successful retest to validate upside toward 120k.
• Buy-the-dip zone: If we pull back, watch 111–112k for signs of bid absorption and continuation.
Bias: I’m bullish while 110k holds. A failure below 110k would likely send us back to 107k and even 100k.

BITCOIN Is this the last rally of the Cycle??Bitcoin (BTCUSD) has held its 1W MA20 (red trend-line) to perfection and closed last week in green for the first time after 3 straight red 1W candles.
As discussed in previous analyses, the 1W MA20 is critical to BTC's bullish trend as it is the trend-line that supported every final parabolic rally on its previous Cycles.
Even on the current Bull Cycle, it has been the first (and main) level of Support during the entirety of the 3-year Channel Up. The second one is the 1W MA50 (blue trend-line) and was the ultimate Buy Signal on all three occasions it was hit (or approached), which coincided with a 0.382 Fibonacci retracement test.
Since the last contact the market had with both the 1W MA50 and 0.382 Fib (April 07 2025 Low), Bitcoin has been trading within the Channel's 0.236 - 0.618 Fibonacci range, which is the zone that has dominated the price action for most of the Bull Cycle. It broke below or above it 4 times, twice below it in the early stages of the Channel Up and as the Cycle's strength accelerated, twice above it to form Higher Highs.
Those Higher Highs have been the mid-Cycle 'Profit taking Zones' (red Triangles), where traders/ investors were encouraged to book quarterly profits and wait for a lower buy opportunity o the 1W MA50/ 0.382 Fib Support Cluster.
Once again, this is were we expect this upcoming final BTC rally to peak. Technically, even if we see a highly aggressive rise starting now, this Zone should be at $140k and above. Profit taking is a personal matter to each trader, depending on their risk tolerance and how low/ soon they entered the market, but this chart can serve as a reminder on their profit taking strategy.
So are you booking your profits soon for this Cycle? Feel free to let us know in the comments section below!
-------------------------------------------------------------------------------
** Please LIKE 👍, FOLLOW ✅, SHARE 🙌 and COMMENT ✍ if you enjoy this idea! Also share your ideas and charts in the comments section below! This is best way to keep it relevant, support us, keep the content here free and allow the idea to reach as many people as possible. **
-------------------------------------------------------------------------------
💸💸💸💸💸💸
👇 👇 👇 👇 👇 👇

Bitcoin: Liquidity Below $107K Signals Bearish RiskFenzoFx—Bitcoin formed a double top at $113,480.00 and is trading lower, up 0.80% today.
The chart shows equal lows at $107,507.00, indicating unabsorbed liquidity below. Technically, Bitcoin may drop to fill the bullish fair value gap near $103,500.00, if BTC/USD closes below the $109,993.00 resistance.
This bearish outlook is invalidated if Bitcoin closes and stabilizes above $113,480.00. In that case, the next bullish target could be $117,416.00.

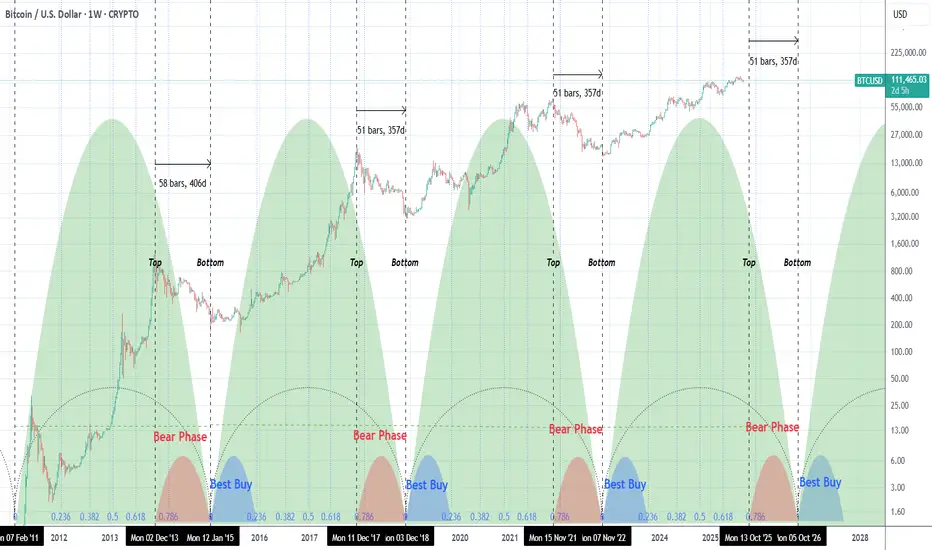
BITCOIN Is the end of the Bull Cycle approaching?Bitcoin (BTCUSD) may be approaching the end of its current Bull Cycle and a few weeks ago we have issued a first reminder of the dynamics of this Cycle in relation to all previous. The historic symmetry is high and this time we've presented it using the Time Cycles and Time Fibonacci levels.
As mentioned on previous studies, measuring the Super Cycle from bottom-to-bottom, the Top tends to be formed around the 0.786 Time Fib. Naturally the distance from the 0.786 Fib and 1.0 is the Bear Phase (red). What follows next is the Bear Buy (blue) of the Bull Phase from Fib 0.0 to Fib 0.236.
What concerns us most at this stage is the fact that 0.786 Time Fib is on the week starting December 01 2025. To make things more alarming, if the next Bear Phase follows the last two that measured 51 days from Top-to-Bottom, since the Super Cycle ends on October 05 2026, the next potential Top of this Cycle could be on the week starting October 13 2025!
Certainly food for thought, surely the current Cycle got derailed/ delayed a few months by Trump's tarrifs but above all this serves as a reminder that booking profits in trading is key. And especially since very few actually manage to do so on Tops.
So are you booking profits for this Cycle or not yet? Feel free to let us know in the comments section below!
-------------------------------------------------------------------------------
** Please LIKE 👍, FOLLOW ✅, SHARE 🙌 and COMMENT ✍ if you enjoy this idea! Also share your ideas and charts in the comments section below! This is best way to keep it relevant, support us, keep the content here free and allow the idea to reach as many people as possible. **
-------------------------------------------------------------------------------
💸💸💸💸💸💸
👇 👇 👇 👇 👇 👇
Bitcoin’s Heavy Support Zone Under Attack–Will It Finally Break?Bitcoin ( BINANCE:BTCUSDT ) currently appears to have completed its pullback to the 100_EMA(Daily) , and Bitcoin has failed to break the Resistance lines with high momentum. The Resistance zone($110,920-$110,200) , Resistance lines , and Cumulative Short Liquidation Leverage($111,711-$110,745) could prevent Bitcoin from rising.
In terms of Elliott Wave theory , Bitcoin appears to have completed the wave Y of the Double Three Correction(WXY) .
I expect Bitcoin to decline at least to the Support lines and Cumulative Long Liquidation Leverage($107,230-$106,277) . And there is a possibility that Bitcoin will eventually break the Heavy Support zone($111,980-$105,820) in this attack .
Do you think Bitcoin can finally break the Heavy Support zone($111,980-$105,820)?
CME Gap: $117,235-$113,800
Stop Loss(SL): $111,880(Worst)
Please respect each other's ideas and express them politely if you agree or disagree.
Bitcoin Analyze (BTCUSDT), 1-hour time frame.
Be sure to follow the updated ideas.
Do not forget to put a Stop loss for your positions (For every position you want to open).
Please follow your strategy and updates; this is just my Idea, and I will gladly see your ideas in this post.
Please do not forget the ✅' like '✅ button 🙏😊 & Share it with your friends; thanks, and Trade safe.
BITCOIN 4H Bullish Cross formed. Can it sustain a rally to 124k?Bitcoin (BTCUSD) just completed its first Bullish Cross on the 4H time-frame between the MA20 (red trend-line) and the MA50 (blue trend-line). Following a rejection after marginally breaching above the 4H MA100 (green trend-line), this pattern looks very similar to the Bullish Cross of June 25.
Both took place after a strong medium-term correction is the form of Channel Down patterns, with the Bullish Crosses getting formed after a Lower Highs break-out. If fact even the August 07 MA20/50 Bullish Cross led to a strong rally.
As a result, if BTC manages to turn its 4H MA100 into a Support, we expect it to initiate a new rally to test at least the previous High above $124k, similar to the July 03 High test. The 0.786 and 0618 Fibonacci levels can be used as Resistance and Support levels upon break-outs and pull-backs respectively.
So do you think this 4H MA20/50 Bullish Cross can kickstart a new rally? Feel free to let us know in the comments section below!
-------------------------------------------------------------------------------
** Please LIKE 👍, FOLLOW ✅, SHARE 🙌 and COMMENT ✍ if you enjoy this idea! Also share your ideas and charts in the comments section below! This is best way to keep it relevant, support us, keep the content here free and allow the idea to reach as many people as possible. **
-------------------------------------------------------------------------------
💸💸💸💸💸💸
👇 👇 👇 👇 👇 👇
