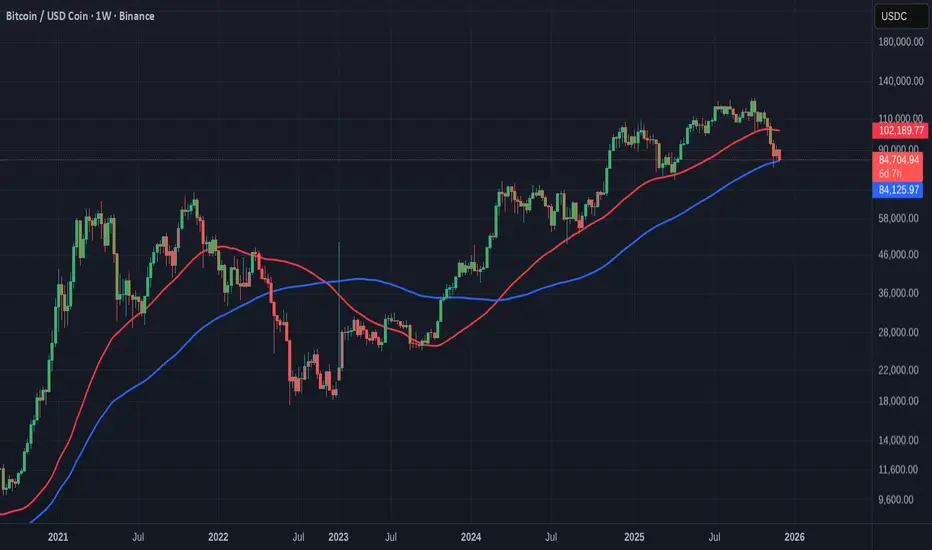
Really Simple Clue to "Is Bitcoin in a BEAR or BULL"
It is as simple as this.
If PA falls below that BLUE 100 WEEK SMA, Bitcoin is in a BEAR
While we remain above it, we have Hope of returning back to a BULL RUN
The RED line is the 50 Week SMA, which was the first warning Shot.......
We will find out this month I hope.........................
Bitcointechnical
TODAY is the day Bitcoin Needs to React and has the strength to HEIKEN ASHI candles on the charts, take out the noise of change and show Trends better.
Bitcoin Daily Chart showing VRVP on the right. The lines mentioned below can offer Resistance, Support.
Horizontal Dashed Yellow - Value Area High VAH currently around 128K usdt
Horizontal Dashed Red - Value area Low VAL currently around 95K usdt
Horizontal Dotted Red line - POC, Point of control currently around 110k usdt
Horizontal Dashed Blue line - Current ATH
Notice the "Pocket" on the right, in the VRVP, just above the VAL. This is a price range that has little Trading volume and tends to attract PA. We are also currently in a little one and PA has risen in it.
The one just above us now, after the VAL line Could Take PA up to the POC around 110k
Likely to meet strong resistance there but PA is Very oversold right now..PA has the ability to push a lot higher
But it is TODAY that we really need to pay attention to.
See the Diagonal lines dropping down from left to right.
These Are FIB CIRCLES> and that Red one is a 236. Those that follow me will understand that I have always said to be careful of them.
And it is THAT that has been dropping PA since ATH.
And TODAY, we need to break through it or face a Stiff push lower.
I think we will break through but that VAL line could be a problem. Nervous day BUT with confidence.
DAILY MACD
MACD has crossed Bullish. WE do need to keep this going to renew sentiment but, as you can see, There is a long way to go before PA become OverBought..THIS alone could take PA back up to the 120k + zone..But there is a LOT of resistance en-route.
But this is a good sign
DAILY RSI
VERY Strong push up from OverSold on the RSI and, again, this shows some very good possibilities ahead as we come to month end.
So, Bitcoin PA has the ability to push high.
The 4 hour Bitcoin chart shows the shorter term
So, here it is...PA pushing up against that 236 Fib Circle, right where the VRVP has a line of resistance.
THIS is why today is so important. WE NEED TO BREAK THROUGH
On this 4 hour chart, you can see how PA is above the POC..that is support if we get rejected off the 236 fib circle.
The VAL is just below that and we bounced off that once before already
So, TODAY, watch this carefully....
In th elonger term, I do not expect BTC PA to Roar up just yet. Thge November candle will close RED, December will be Green as confidence returns and I am thinking that January will be EPIC.
But..we need to break this resistance today...
Hang on You Lot

Is BITCOIN in a DIP OF DOOM or Are the Bears having Fun ?
This is a Crunch time for Bitcoin and Many people Are running scared.
Me, I am sitting tight, NOT selling.
In Fact, I am BUYING
Why ?
Because we are Still in Channel and Above a long Term line of support.
Lets have a Look.
There are two major lines we need to pay attention to...The BLUE ARC that has rejected Every Bitcoin ATH since the beginning and the Line of support that was created in 2011.
And the problem we have right now, is that PA is getting Squeezed between the Two.
PA MUST React.
You can see how tight it is getting and PA is nearly on the lower trendline.
Lets look closer
Same chart as a Weekly chart
See how that Blue Arc has rejected PA and how the White long term support has supported PA>
And it is THIS image of this chart that Give me Hope.
A number of things to note here.
Most importantly is that the Bulls DID break over that Blue Arc once. This shows intent to do so. That was the First time that line of resistance has ever been broken.
And PA was Overbought when it did so and so we did not have the strength to remain above.
PA has retreated and as a consequence, PA is now Oversold.....and with in striking distance.
PA has the strength to attack that Blue Arc again and WIN
PA is currently on the 0.5 Fib Retracement
Should this support fail, we will Visit 89700 on the 0.618 retrancement. But that will only happen if we fall through a line of Support that HAS NEVER BEEN CROSSED
For Me, I remain VERY BULLISH
This is a Dip of Doom and has scared people but we are near the end....So long as we remain above that line of support, I remain positive.
As I mentioned at the beginning of the month, I am expecting this month to close RED but then we Rise....Have a look at the Month Candle Colout chart post.....all will be explained.
Stay safe

Various things point to a Bitcoin Move higher within next 9 days
There are a number of simple things, basic YA, that points towards A Move from Bitcoin.
The Pennant being printed Right now, with PA squeezed between the 2.618 Fib and a Long Term line of rising Support, could be seen as Bearish
The rising line of support is Strong however and we last touched it back in April 2025 and bounced well.
We arrived there after a long sustained Drive by the Bears to push us down, as is the case right now.
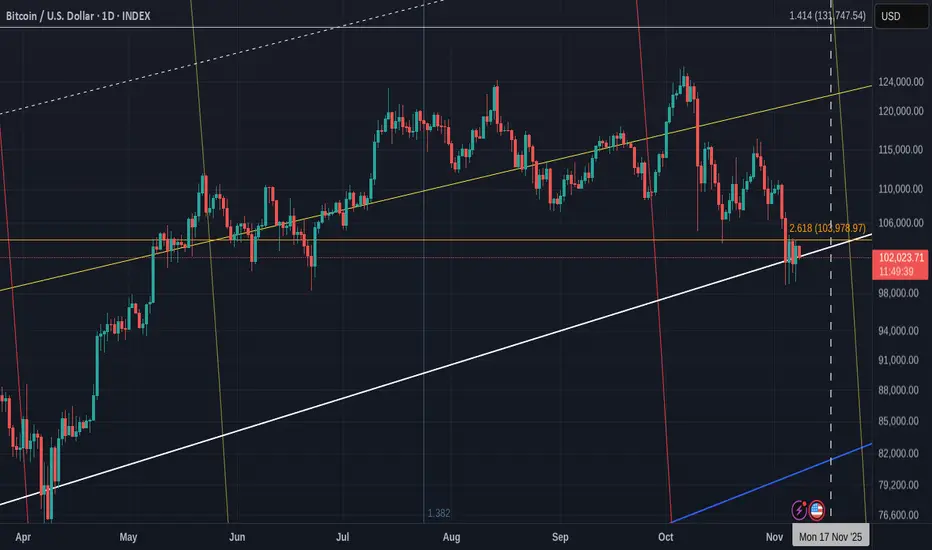
If we zoom into the 4 hour, we see more detail
There is a sustained Ceiling (2.618 fib ) and each time PA gets rejected the Bulls step in and we now are working with in a decreasing Range.
But the Bears ARE in control right now and this is why we are were we are now.
PA being Squeezed and heading to an Apex.
PA Always reacts BEFORE the Apex and I expect the latest this could happen to be around the 17Th November.
But the MACD Always shows us another side, a trend formation.
Lets look at the Weekly first
So we see how the Weekly MACD is falling Bearish still and will likely do so until it meets its first line of support around.....17 November. See the Vertical blue cashed line on the PA 4 hour chart and then look where that is on this MACD chart
Then see the rising dashed line that previous MACD Lows seem to have bounced off.
NOTE, there is a possible inaccuracy here as trends require 3 touches to be Valid....This has had 2. So, we wait to see..........
Otherwise, the projected MACD arriving at Neutral is around 22 December......
The Daily MACD
The Fact that Naily MACD has not been this low for a Long time, also points towards a Move in the near future.
In fact, the last time MACD was this low, was March 2025, just beofre PA hit long Term Support and bounced....
Bitcoin Dominance is approaching a local line of support
Conclusion
While there are Bullish signs, it should be remembered, we can still drop lower while sentiment fall and the Rotation of Money towards ALTS gains momentum. But as had happened so many times this cycle, Things can turn VERY quick and if you are selling to Buy ALTS< Remain Very cautious
As mentioned in my monthly Candle colour report, I mentioned that November could close Red......But it may not.....it is honestly a very difficult market right now....
But one thing is Certain.. BTC PA will make a bigger move soon......We just do not know for sure, in which direction but for me, the odds are that it will go higher.
Time will tell
One year in BITCOIN- easy graphic may show whats next
Nothing complicated here.
The Box on the left is October Last year
Hardly UpTober was it ? PA dived towards the end of September and it recovered 10% by the end of October.
It also had a Red start as can be seen if you look close
This year, we have gone a little deeper into the Red but we do seem to be climbing back out of it and, so, we may well see a Big Take off in the near future.
However, at time of writing, we are still at -7% off the high at end of September before PA dived.
So we do need to remain CAUTIOUS and the fact that we currently have a DOJI Green candle, just recovered from RED on the monthly chart adds to the need to take Care
Last year, we reached the ATH in December as is the traditional Habit in Bitcoin Cycles.
I see no reason as yet why we cannot try this again.
BEAR signals do exist but they are not as strong as the Bullish ideas
It is the Blue line on the chart below that we need to cross and remain above
Time will tell
Lets see what happens after the FED annoucement tomorrow But, again, remain cautious.
The initial response from markets may be False.

Bitcoin is approaching a make or break decision, It MUST Rise
It may be best to show you THIS chart
The Chart is the Entire history of Bitcoin. (Yellow Line )
Easy to see how EVERY All Time High has been rejected off ONE line.
A Fibonacci Spiral
There is one line of support that has Never been broken just below.
PA is now getting Squeezed between these two lines.
PA MUST REACT
And it is VERY easy to understand that unless Bitcoin PA rises above this spiral, the line of resistance, VERY VERY Strong Resistance could push PA i descent.
The Zoomed Weekly shows more detail
The Blue line is that Spiral,
The Daily chart shows us where we are Right now.
We need to break over and remain above.
The rising lines of support meet that Blue Arc, the spiral, in Late December.
PA tends to react before the apex of a Squeeze.
As we enter November 2025, we may see some strong Moves in Both directions.
PA is currently rising, trying to close October Green, it is currently RED
We had a red October in a Bull run only once before, in 2012
November is going to be Fun.

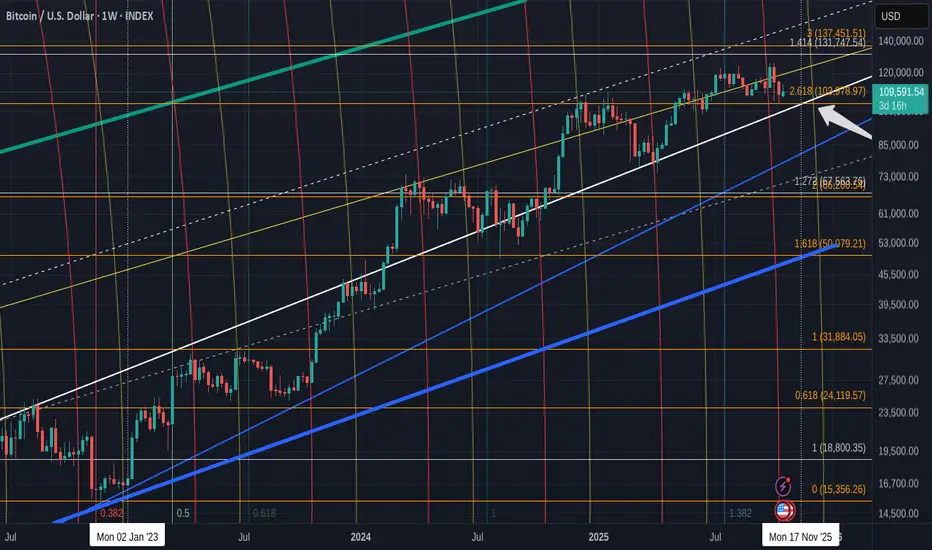
BITCOIN Weekly chart shows strength with potential to extend
This chart is one of my oldest and most trusted charts.
Thhis main chart is Weekly and from the end weeks of the Bear in 2022. You can see wre January 2023 is marked and so we can see the rising channels that developed.
The Blue Bold line is a Long term line if support from 2013 that we may never visit again.
There are 2 lines I want to draw your attention to.
The rising bold White line that acted as strong resistance in August 2022 and was turned in to Support in early 2024.
It has been strong support ever since.
The other is the 2.618 Fib extension ( Arrow ).
This line was resistance in early 2025 and remained so until crossed in around June this year.
It has been support ever since.
PA is heading towards the intersection of these two lines in Mid November ( around 17th ). PA could react before this date but it is very possible that PA will rise to a new ATH from this point.
The 2.618 Fib was tested recently in that Sudden Drop and we can see this on the daily chart below.
See that last wick down ? For me, the fact that this Snowballing liquidation was stopped by that line, shows massive strength of support there.
We can also see that rising line of support worked well in April this year.
These are 2 very strong lines of support and PA is above both of them and heading to the intersection of the two in November.
But what supports this idea further ?
The Weekly RSI is in a zone that previous occasions have bounced from, though it could fall a little further, giving a delay in PA rising.
November 17 is just over 3 weeks away. We may see RSI rise, Dip, rise
The weekly MACD also offers some insights
The weekly MACD is dropping bearish and its projected line till it reaches support is around end of November. Later than the 17th November
The Daily MACD may show us the idea of a bounce for the short term
MACD is turning up from OVERSOLD but we need to see what happens over the next few weeks closely. The idea that a short term Bounce in the Daily MACD also supports the idea of the RSI bouncing up down up, as mentioned above.
Something that I do find very interesting is the change in MVRV this cycle.
I have never seem MVRV rising in a channel like this and what is more interesting is how the Z Score ( yellow ) has bounced off the lower trend line twice previously.
And it is heading towards that line again, with a projected Touch around 27 November.
SO, all in all, we have Bitcoin Above Strong Support, heading to a point of intersection that has the potential to push PA higher.
That push could then be supported a little after with strong support from Technicals.
This may Push Bitcoin PA in a sustained rise with next major resistance levels at 137K
We need to get above and Hold that level.
BUT, as ever, MACRO could take over and we have, next week, the FED interest rate decision.
However, NOVEMBER is the focus here.
The Federal Reserve does not have a scheduled FOMC meeting in November 2025. The next meeting after October 28-29, 2025, is scheduled for December 9-10, 2025
This could be VERY INTERESTING Q4
Stay safe
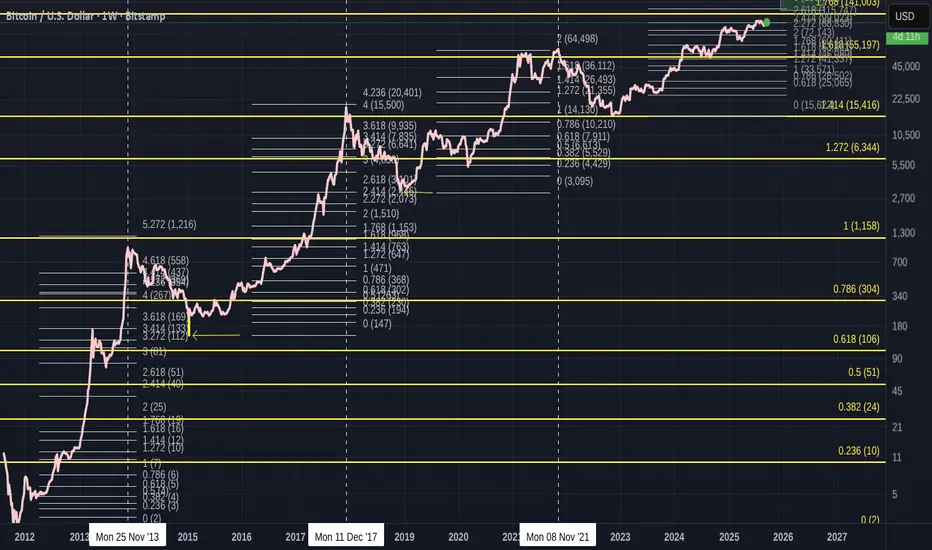
Bitcoin Global / Local Fib Levels point to the TOP area to watch
Each Low to ATH has a "Local" Fib extension Set
And the Yellow Fib extension is from the 2011 Low to the 2013 ATH and I use this as a "Global" Fib as that was, in reality, the first ever Low to ATH before a sustained draw back.
Please Note that as Candles would not show very clearly at this scale, I have used a Line. This has some inaccuracy as to true candle Ends. As a result, it looks like some Fibs are misplaced but I assure you, each are placed accurately, using candles and then the Line is used.
The Fibs are accuratly placed.
Local Fib extension ATH Fib number
2013 November - 5.272
2017 December - 4.236
2021 November - 2
2025 Current just above 2.618
Global Fib extension ATH number
NOTE- See on chart how ATH is just above this Fib level, except for Fib 1.
2013 November - 1
2017 December- 1.414
2021 November - 1.618
2025 Current Fib just below 1,758 - if we follow trend, I expect ATH to be using this 1.768 line, the next in sequence of Fib numbers.
Local Fib charts
2011 low to 2013 ATH
2015 low to 2017 ATH
2019 low to 2021 ATH
2023 low to current position
To me, there are a number of things to see here.
More than anything, what is plain to see is how Bitcoin has used the Global Fib numbers like stepping Stones. Currently just below the 1.768, which is the next in sequence. ( Yellow lines )
All but the First ATH were recorded just above the Global Fib lines ( the First was on the line ) and I have little doubt we will do this again.
And if we look at the pattern of the Local Fib lines, we can see that we missed the 3.236 line in 2021
We went from 5 to 4 to 2. ( ignoring the 236 bit for now.)
We missed 3
See how the first 2 Local Fibs dropped by nearly one complete Fib number, from 5.272 to 4.236
By the time we headed towards the 2021 ATH, the market accelerated hugely, mostly due to the idea of Get Rich quick and no tax rules..GREED WAS UPMOST.
Even at the time, I considered this cycle Abnormal. Many charts show why, and I will not expand further here.
The Local Fib level for that run was distorted by the swift recovery from the low in 2019.
While this was not a bad thing, it changed the cycle dynamics.
This cycle, currently, we have returned to a more sensible approach and we appear to be heading to the 3 local Fib zone, maybe as we should have done in 2021.
This also happens to be just above the 1.768 Global Fib line, The next expected Global ATH line.
So, we are currently approaching that 1.7668 Global Fib line and we can expect the ATH to be above this, if we follow the previous 2 ATH.
And if we go above that Global line the same as we have in the last 2 previous cycles, we find the Local 3 Fib extension.
IF we were to follow previous, this could be expected ro be the 3.236, at around 190K
I think this is doubtful and maybe the 3 itself is more realistic at 155K
So, there you have it.
Bitcoin and its Fibs have a pattern, it get broken and it looks like it is trying to regain that pattern.
And this is all done by Humans trading........
Astounding.
and that 2 Global Fin line in 2029 ? Will we get there ?
Given the introductions of ETF and Corprate Long term holders....Will we see a bear market before we rech that 2 Global Fib ?
So many questions...
One real answer is BUY BITCOIN AND HOLD ON TO IT
Bitcoin 2013 Fractal chart UPDATE = Nailed the PA target
Been posting this chart for the last few years and drew that Circle that PA hit, back in Feb..Way befppre PA arrived there.
I also drew that dashed Arrow line at the same time ad, as we can see frm the Daily chart beow, PA is bang on that line.
Why is it importnat that you know this ?
Because those Circles and Dashed lines are transposed from teh 2017 - 2021 fractal !
We do seem to have moved from one Fractal to another.
This has yet to be fully confirmed and the July Candle Close will certainly help identify this if we get a large green candle.
So, for now, we wait.
I will post more details about this later but fir now, if we follow this line, we can expect a cycle ATH of around 270K - 322K in Q4 2025
And then the BIG question is "What is next ?" because, as I have pointed out n another posts, we are also leaving a long term cycle (2009 - 2025 ) line of resistance....that we just broke free of...but need to remain above.
Judy is CRUCIAL

Bitcoin - value of S2F model and TA on 1MMany bitcoin investors believe in the S2F (Stock to Flow) model and expect bitcoin to rise to 100,000+ USD any time soon. The model advocates that an asset has a production/supply limit, for example, like gold and silver and therefore, in the long run, such an asset will only grow in value. This is all true!
Hard asset
Bitcoin has a limited supply of 21 million. This makes it a hard currency, so by 2040 one can expect it to be worth 1 million USD per unit. By that time, Bitcoin will mainly be used as a banking transactions' instrument, while for investment purposes a new fork will be created most likely.
What's the buzz?
If you are a long term investor and time is on your hands, then simply wait another 15-20 years and you'll collect your jackpot. However, if you are a trader on 1D, then you should take into account that bitcoin is a high-risk asset due to its volatility, it runs in cycles that are determined by macroeconomic factors and its drop to 10,000-7,000 USD is more than real. If in doubt, then take a look at US Binance on October 21, where the price of bitcoin fell by 87% from 65,000 USD to 8,200 USD within a minute.
It's important to remember that the cost of bitcoin is primarily the cost of electricity used for mining + the cost of its farm's infrastracture. For large industrial farms, such as Poolin, Bitmain, Crypto Scientific etc. that make up the main share market - the cost per bitcoin is around 3000-5000 USD. Everything else is mere speculation and the belief in hard asset. So ask yourself - under what circumstances can the price of bitcoin fall in the S2F model?
A simple example of a cycle
Take any famous artist. During his life, he can create only a certain number of paintings. The price of a painting grows progressively as the artist becomes more famous and demand for his work increases. This is a S2F model. A painting's cost bottom remains unchanged - it includes the canvas, paints for drawing and the time it takes to create the masterpiece. All of a sudden a global war arrives. There is misery and hunger! This is a cycle. During this period, an artist's painting loses its value and is sold for a loaf of bread.
Recession
In this insance, bitcoin's war is a global recession that has already begun. This is confirmed by US bonds' price inversion. As in the last 9 recession cycles over the last 60 years such course was always followed by a market crash. Based on previous cycles, the recovery of the US economy took an average of 9-16 months. Hence, we are looking into 2023 at least before any further growth!
TA on 1M
The blue curve is now flat at the top. The upward blue trendline was broken back in November 2018. In June 2021, the price exited the green wedge and bounced off it in October 2021. Two days ago the price broke through the second pink wedge, so far only as a shadow, but it is only the beginning of the month. RSI has a clear price divergence. MACD is at the peak of a rising wedge. RVI has broken through 50. Vertical volumes keep falling while price rises.

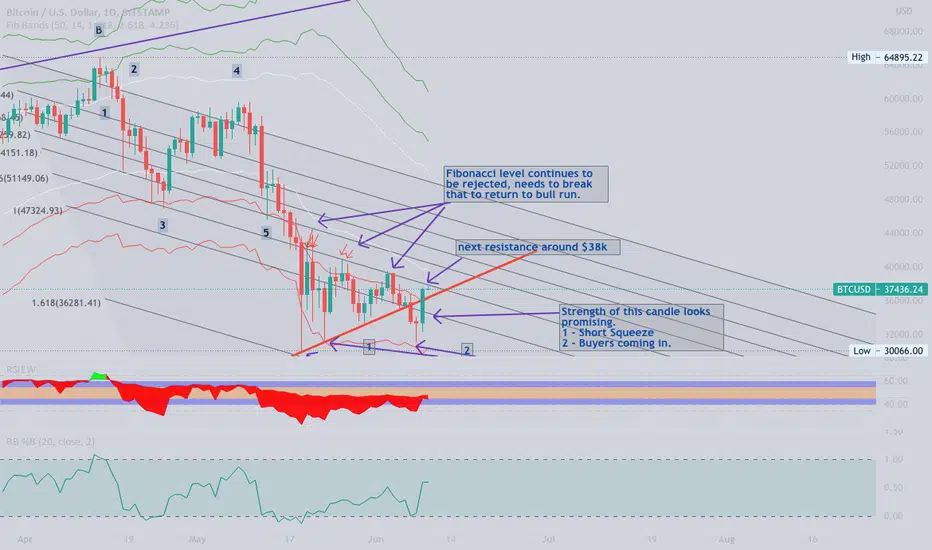
#BTC - Bitcoin return to Bull Run?Hi Guys,
The way we've been going up from the recent pull back to next Fibonacci resistance around $38k, we need to close above 38k on daily candle to invite more buyers to join in. Also, media has been spreading the #FUD regarding Bitcoin going back to $20k, usually 100% retracement doesn't happen that often unless fundamentals are very poor, not the case with Bitcoin.
Still Neutral but towards bullish side.
~Happy Trading
Bull Flag in 4 Hour Bitcoin May be 17500Bull Flag in 4 Hour Bitcoin May be 17500 Bitcoin might be hit 17500
