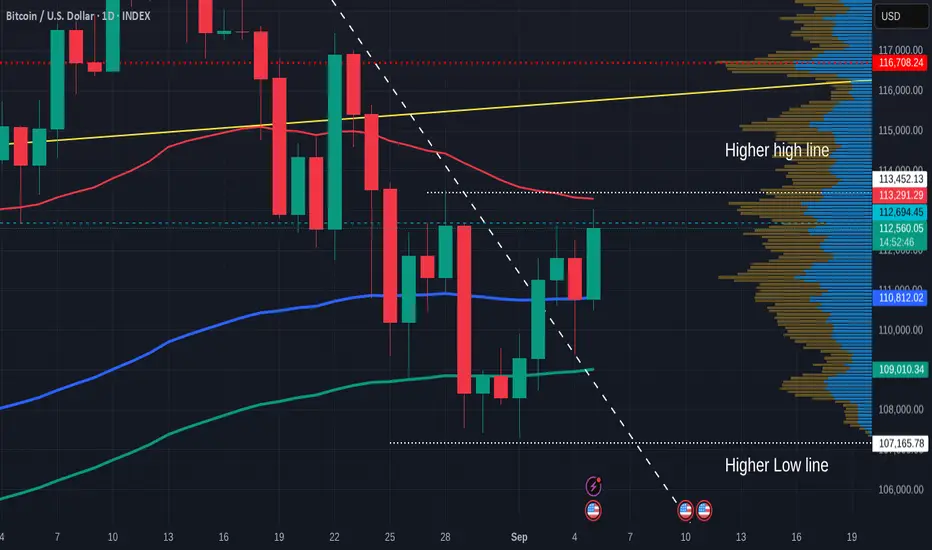
Bitcoin Daiy SMA UPDATEThis chart uses the SMA, Simple Moving Average
Red = 50, Blue = 100, Green = 128, Yellow = 200
The weekend was calm and very low trading.
PA is ranging along the 100 SMA and sitting, waiting.
PA has the potential to move in either direction right now but the Bulls are certainly present, Keeping PA static.
Daily MACD remains Bulish with room to move higher, Histogram is Green
On the shorter term 4 hour, we can see how the 50 SMA is supporting PA while the 100 is currently the line to cross at 111582
PA has support below and is avobe the VRVP POC ( red dots )
Shorter term certainly appears more Bullish
The 4 hour MACD also shows this
The MACD came down and tested neutral line as support and the Histogram here is alo Green.
But understand, this does NOT guarantee a rise further.
The lines of Resistance abive are growing.
Currently, beginning aroun 113K
The Blue line on the Daily chart is the ultimate Goal to be crossed.
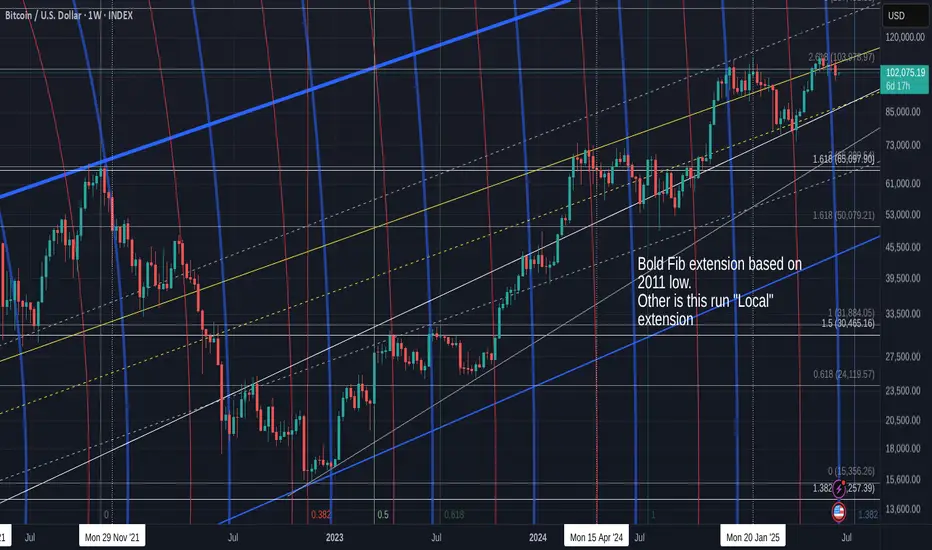
This is a LONG Term line of resistance that has rejected EVERY ATH since 2011.
It is the only line that has done this and what is important to know, this is a Calculated Arc, part of a Fibonaccj Spiral ( as explained in a previous post)
This is the Bigger picture, PA from November 2009, the year after Bitcoin Was born
As you can see, PA is being Sqqueezed and HAS to react before January 2026 or face stiff rejection below that Long Term line of support ( dashed line)
What ever happens, this IS the beginning of a New Era, Cycle of Bitcoin.
And this is why we need to pay so much attention to Bitcoin right now.
We MUST rise above that blue Arc of resistance....
And Curently, we are HERE....shown in the chart below.
This is a daily chart from November 2024
PA has been trying to get above this blue Arc since then.
And we are right under it again now,
Target price to get to and hold Above this Blue Arc is around 117K
We may wait till the FED tells us its decision on interest rates this month.
Bitcointechnicalanalysis

Quick Bitcoin Daily SMa update - PA getting rejected
As you can se, PA is getting rejected off the 50 SMA ( red)
If this rejection is confirmed, this could create a double Top and may push PA back down to create a Lower Low.
Watch this closely, it could turn if the bulls step in.
Just be Very cautious right now.
oshorter term 4 hour MACD is showing us that MACD did cross above the signal line however, this could turn down quickly as it did over on the left of the chart
Caution is advisable
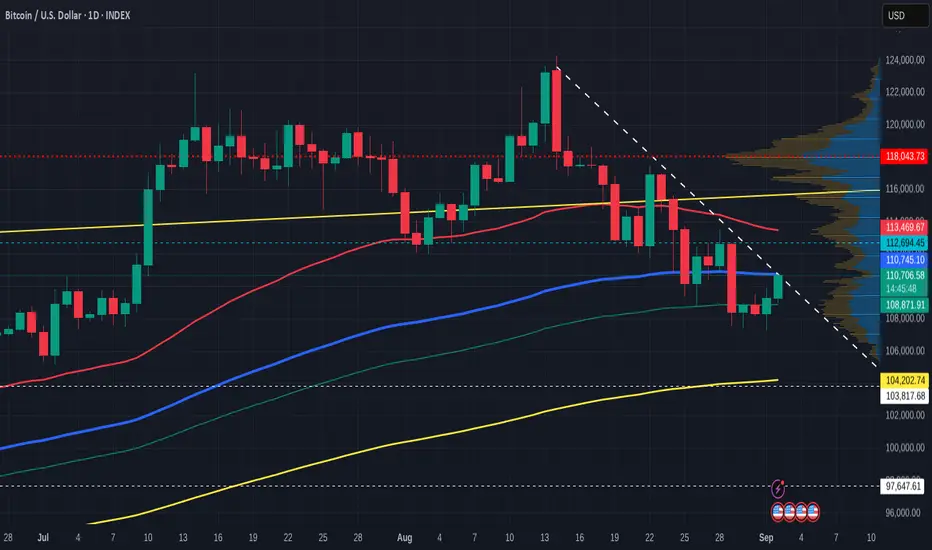
Bitcoin Daily SMA UPDATE
This daily chart uses the SMA, Simple Moving Average
Red = 50, Blue = 100, Green = 128, Yellow = 200
Yesterday, PA broke through the descending line of resistance it had been under since 13 August.
As yet, this does not mean PA will now rise, though on a daily chart, the MACD certainly has the room to move higher, as seen below
However, given where we are in a traditionaly quiet month, I do still see PA sliding down this line in the bear future...testing it as support
This maybe supported by the fact that the shorter term 4 Hour MACD has Crossed Neutral but the Hitogram is showing White bars and not Green. This shows a weakening and the MACD line moving closer to the red signal line.
The Daily RSI is also turning over but remains above its MA for now
So for now, we see PA has broken over the Daily 100 SMA and is testing as support.
Above, we have the 50 at 113300
This could be the next line of resistance if PA rises now.
Should PA turn down now, we have the 100 SMA at 110762.
Below that , the 128 sits at 108194
To remain above that descending trend line, we need to Range in the area we currently are in and stay above that 100SMA at 110K for at least the next 24 hours
If we look at the Bitcoin 4 hour chart, we see this maybe possible
PA sits in a very tight range between the 50 and the 100 4 hour SMA and is currently sitting on the VRVP Point of control ( red dotted line )
This is all support but we have to wait and see if it remains so.
There is Very little action trading right now...we just waiting.

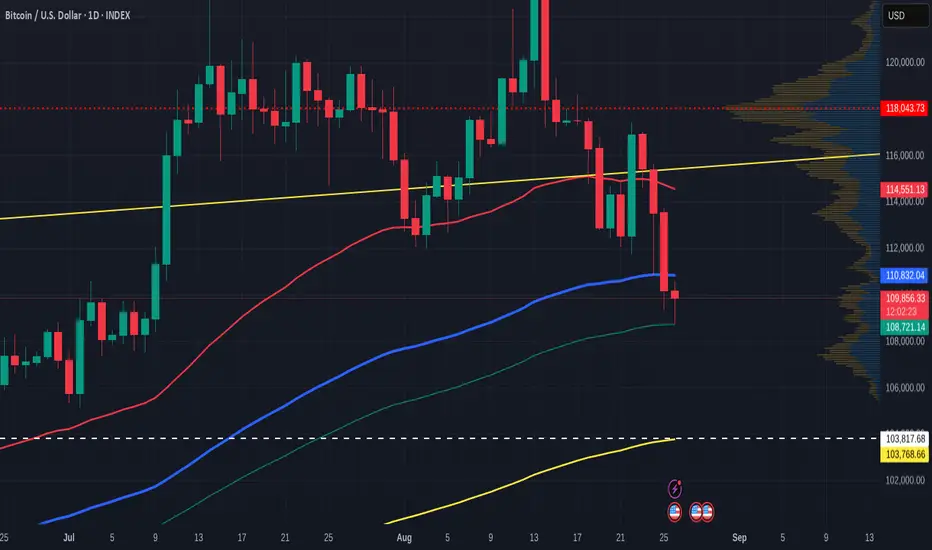
Bitcoin Daily on Lower Low Lower high again -till ?
This chart uses the SMA. Red - 50, Blue - 100, Green - 128 and 200 - Yellow
PA is absolutely in a descending channel with repeated Lower Low Lower high on a daily chart
Today, we will see if we break that or not as PA reaches resistance on a Trend line.
The 50 SMA is descending as potential resistance when the day comes were PA breaks out and reaches higher.
This will happen as I do not believe we are entering a Deep Bear..This is a Local "Cool off" but we may hit a tough one at that 50 SMA at around 113K
Till then, we are hitting the 100 as resistance and the 128 as support.
This may break today as we hit that line of resistance with the 128 SMA not far below.
The DAILY MACD offers some hope of strength as we see it bouncing off oversold
We will have to watch today close to see where we go
If we get rejected today, Next stop down could be the 200 SMA at around 103K low
This line needs to hold to show use confidence in the Bulls.
My line of concern will be reached if e go to 95K and fall through.
This daily chart below shows a number of things to support what is written above.
On this , we see the 2.618 Fib extension around the same area as the 200 day SMA @ 103900 usd
The circle highlights a point where a 236 Fib circle crosses over a rising line of support.
This is around 97K and just below this is another line of support around 95K
People that follow me will know that I often highlight 236 Fib circles as lines of strong resistance and on this occasion, this maybe Exactly why we see PA dropping now.
The intersection is near the end of September, a usually slow month that has a majority of RED Candle Closes on a month chart ( 9 red to 5 Green since 2013)
I am not saying we will get to this level but the potential does exist while we remain in a down trend....
I would hope that PA bounces off the Fib extension on that 200 SMA if we get near that 104K line.
On a longer term, we should take note of the WEEKLY MACD
Should this continue down the line drawn, that takes us to Late October before a bounce ur a more sustained push higher.
We should keep this in mind
I welcome any comments ( Sensible ones..)
Quick Bitcoin Update with SMA's
PA is currently finding support off the 126 day SMA (Green) having falling through the 100 days SMA ( blue)
The 50 dayy SMA is falling fast and we need to watch this does not act as a line of resistance in the near future.
PA may drop further and we could hit the 200 day SMa ( Yellow ) on around 103k
For me, I am happy to Hit 100k again towards the end of the month..
BUY MORE BITCOIN AT 100K
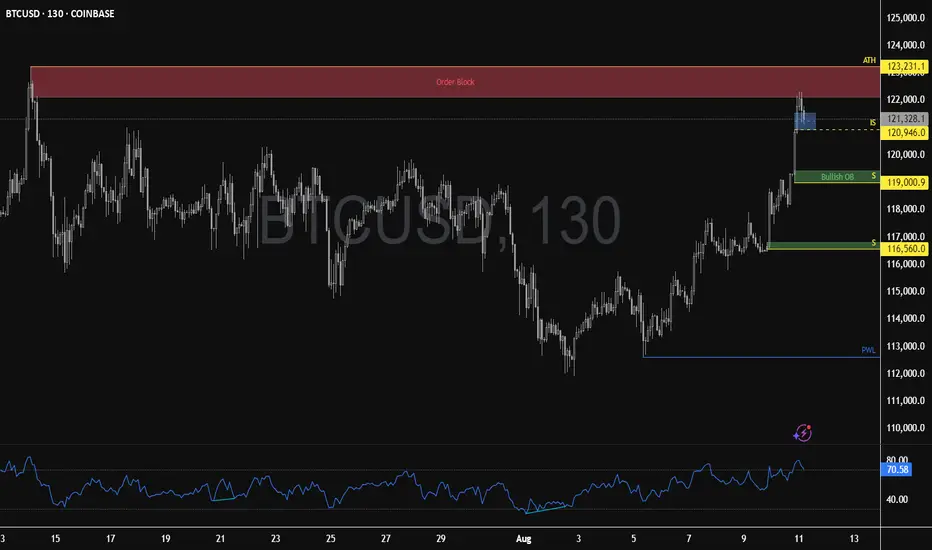
Bitcoin Pulls Back After Testing Bearish BlockFenzoFx—Bitcoin hit the bearish order block and pulled back as expected. RSI 14 dropped below the overbought zone to, signaling increased selling pressure.
Immediate support lies at $120,946. A close below this level could extend the downtrend, targeting the bullish order block at $119,000.00. No bullish setup is expected until price consolidates near discount levels at $119,000.00 and $116,560.00.
BITCOIN has broken Free - The Next cycle type begins- WHY ?
I have been talking about the Blue Arc of resistance for a while now.
The ARC that has rejected EVERY ATH since Bitcoin began its true rise in Value back in 2011.
I am not going to get to technical right now as I have had only 1 coffee..lol..
Lets begin
I have 3 charts with this Arc on , all slightly different so as to allow for small errors in plotting or calculation.
ALL charts now show PA Above the Arc.
Why is this so important ?
As previously explained, that Blue Arc is a part of a Calculated Fibonacci Spiral.
Calculated from Each ATH to the next and using the difference as a part of that calculation, I was able to pinpoint the centre of this Arc.
And here is the Full picture.
What I am finding a little interesting is how that centre is on MARCH 2020 - That Sudden and worrying COVID CRASH !
But that is a subject for another time.
The Two important things to take of here is how PA began rising on this spiral as soon as PA entered it ( Left ) and unless we broke out of it now, PA would have been dragged back down by December. The time spent inside this spiral are the cumulative years of Bitcoin.
It is also very interesting how the 3 "Cycles " we have had in this channel. have ended perfectly at that intersection of the Blue Arc and the underlying line of support, that PA has not dropped below since we entered the channel back in 2012
To me, that is more than just a coincidence.
And if we look at a smaller time frame, we can see that PA has broken over this Arc, with strength.
The Daily chart above does show us that we do still have challenges ahead.
For instance, there is that line of local resistance just above, that could , under the right circumstances, push PA back down with vengeance should the Bears take over.
But I do not think that will happen yet but it would be nice if we could climb over that and use it as support.
We have done on 2 previous occasions this cycle but each time, we got pushed back under.
3rd time lucky ?
The 4 hour chart gives hope.
Here we can see how that Blue Arc was used as support but once it failed, the Bulls were Quick to get back over.
To me, this shows us that the Bulls have every intention of keeping Bitcoin High and above that Blue Arc.
But the longer we wait to get over that local line of resistance above, and use as support, the further away it Gets.
Currently, the Target to get over that lline is around 140K
Near Term projections of PA, in a bullish run, are around 160K -> 180K
This would give PA that underlying line of support.
So, we wait to see how this plays out but THE MOST IMPORTANT THING ?
We Must remain above that line, the Blue Arc....that currently sits around 115 -118K
The Next Few weeks are VITAL and I remind you..August has nearly twice as many RED monthly closes as Green..Unless it is in a Bull run....;-)
The Daily RSI has room to move still but is High
The Weekly RSI is Similar in hieght, with room to move.
So, We could be in a good position to start that New Cycle type, out of the Spiral that Created Bitcoin as we now know it. The 4 year Flow could change as mass adoption takes pace and People simply do not Buy / Sell as we used to do.
But it is impossible to really know whats coming.
We can only watch and learn. We may well end up having the 4 year cycles again.
After all, that gave us superb profit making opportunities.
Or will Bitcoin become the Store of Value, the Digital Gold ?
Time will tell.
Have a good week and stay safe

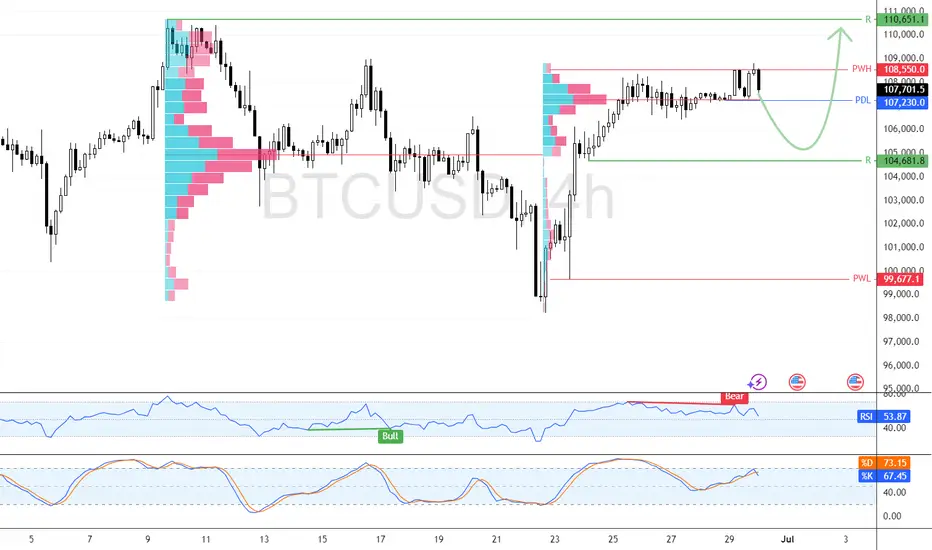
Bitcoin daily showing short term rejection Long Term Gains
The descending diagonal "line" is another of those 618 Fib circles.
You can see very clearly on this chart what happened the last 2 occasions PA hit one of these.
I have little reason to expect things to be any different this time.
As a result, we could revisit 107K
HOWEVER, we do have the 50 day SMA just below, around 112K, and this could act as support in which case, we will continue to rise through the Fib circle.
To some extents, this idea is supported by the daily MACD
Currently bouncing off Neutral and with plenty of room to move higher. The 4 hour is also rising Bullish
But the Daily RSI is showing possibilities for Both
RSI has risen above its average ( yellow line), having been rejected by it repeatably recently.....We need to watch this also to see if it finds support or not.
So we have an open Chance of Bullish or Bearish this weekend and my opinion heads towards the short term Bearish till PA hits lower trend line, due to this Fib circle..
I remain Extremely Bullish longer term
Have a great weekend
Lets see

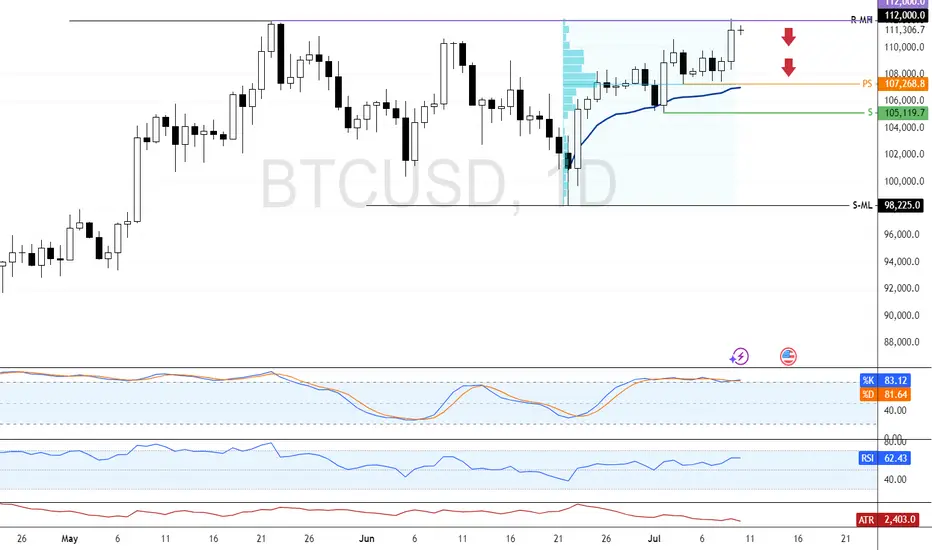
Bitcoin: Support at $112K Holds Key to Bullish ContinuationFenzoFx—Bitcoin is bullish, trading above $112,000.0 after forming a new all-time high at $123,231.0. The current dip may offer a strong reentry if $112,000.0 holds as support, aligning with a bullish fair value gap.
Price remains above the ascending trendline, reinforcing the bullish outlook. If momentum continues and BTC breaks past $123,231.0, the next target could be $130,000.0.
A fall below the trendline would invalidate the bullish setup.

Bitcoin Tests Record High as Momentum FadesBitcoin is bullish, testing the all-time high at $112,000.0. Stochastic shows an overbought reading of 83.0, indicating momentum may stall.
As of now, BTC trades slightly below this level. Since it's the first test of $112,000.0, consolidation could follow. If bulls fail to break higher, price may dip toward $107,268 and $105,119.0 supports.
Something for the weekend? Bitcoin Daily-last for 2 weeks
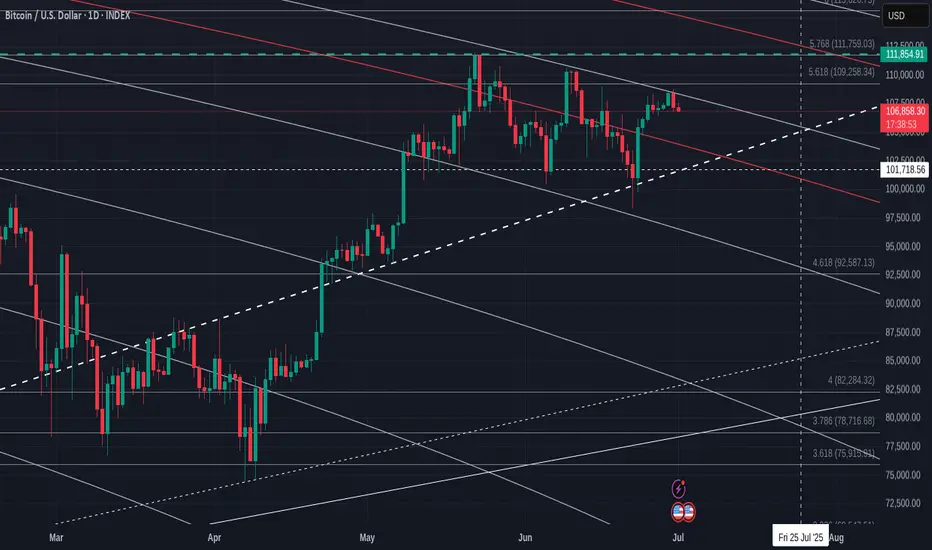
PA has finally risen above that Fib circle ( falling diagonal arc) that has rejected us since Early June.
PA is currently retesting this as support now and we will hopefully manage to remain above.
Should this fail, we have the lower trendline of the newly formed rising channel to use as support.
Should that fail, we have the 236 Fib circle (Red) and the next rising support line around 102k, depending on sharp the drop is.
If we find support where we are now, we have a good run back to the current ATH line ( Blue Dash line)
The real test is that 236 Fib circle that is dropping form around 114K
99% of the Time, a 236 Fib circle is resistance and if it rejects PA, the Current ATH line is very close below.
This will either create a bounce or a sharp drop. If we get stuck between the 2, we have that APEX around 25 July..PA always reacts BEFORE the Apex
And I am back on the 19th Jully, just in time I hope ;-)
So, The MACD is currently above neutral on the Daily (Below)
The weekly is much the same but on the 4 hour, we are currently dropping towards Neutral and Tomorrow ( sunday) will tell us if it bounces or not.
We are early in July, As mentioned in the monthly report I posted earlier this week, we could see a larger Green candle by month end, though is is not a promise obviously.
But the MACD could support this idea
We just have to wait and, for me, that is what we will do until around Q4
We could still see smaller gains over the summer period but the Bigger moves are in Q4
That is what I am waiting for....and yet, at the same time, I am ready if it comes earlier
stay safe

BTC Eyes $105,119 Support Before Targeting $112,000FenzoFx—Bitcoin is trading just below the previous monthly high at $109,110.0, while the Stochastic remains overbought for the third consecutive day, signaling short-term overheating.
Although the broader trend is bullish, a pullback toward the anchored VWAP at $105,119.0 is expected. This level may offer a low-risk reentry, with a potential move toward the all-time high at $112,000.0.
Bitcoin Monthly Candle Close colour and patterns since 2011
At the beginning of June , I wrote this
""On only 2 occasions have we had a GREEN JAN, RED FEB, RED MARCH, GREEN APRIL
And Both of them were on the way to ATH. (Boxes )
On both those occasions we also had a GREEN MAY, though the gains were minimal and one was followed by a Green June and the other by a Red June."
We just got the GREEN June and so this draws my eye to the sequence on the left, ( arrow )
If we are to follow this, then July should be a larger Green (Arrow) - BULLISH
In-fact, in both the sequences we have been following ( boxes), July was GREEN- BULLISH
And using just the month candle colours, we have a higher chance of another Green candle, with July having had 9 Green to 4 Red previously. - BULLISH
However
Of the previous 8 Green June Closes , only 3 went to a Green July - BEARISH
And I have to say, on NONE of the previous Green Junes were we so close to the current ATH.
July 2021 being the closest with a price at 41K, around 18K below the current ATH at the time.
We are currently only around 200 usd below Current ATH
This adds enormous resistance to the ability to rise
I wanted a RED June because I felt it was more sustainable and would lead to a cycle ATH at the end of the year. As can be seen in the middle Box
If we look back toward the 2012 Box on the left, we may now get a Hot July / August , September and then a Cool off for October, November & December.
But something tells me this will not happen.
The Candles for our current cycle in April, May and June are diminishing in size, the opposite of 2012
But they are similar to the 2020 box, except for the red June close.
This could lead to the desired "Cooling" in August & September and a new lift off in autumn.
And if you look at the chart Candle Colour Count, , August and September are usually RED by some majority
This also gives us the Bigger Green July candle that the "Odds" point towards.
So, as ever, we have to wait and see how this plays out.
Odds in favour of a Green July using previous cycle Data
PA position just below current ATH could lead to a slightly Bearish out look in the short term.
And if you are hoping to see ALTS Rally, PLEASE keep your eye on the BTC.D chart
This also points to wards BTC ATH in Q4 this year
And then, we have the BIG question.......Will we ever see a Classix Bear again ?
With so many Holding Bitcoin LongTerm.....How would a Bear market arrive ?
BUY BITCOIN
HOLD BITCOIN
But, as ever, we just have to wait and see,

Bitcoin Daily in a large pennant with apex end of July
Bitcoin is once again getting rejected off the Fib circle just above.
This is also just under a 618 Fib extension and so a combined rejection zone.
Beneath this, we have support on that Bold dashed line. This is a Local line of supprt but has strength.
And so, we find outselves in apennant again and that apex is around 22 July.
PA tracts before the apex.
As will be explained in the monthly chart I iwll post later, this all points towards a Calm July, possibly RED month.
PA does however, have the ability and strength to push higher if the Bulls decide to make a move.
The MACD
The Daily MACD is just above Neutral and has enough room to move.
So, if we drop, support is arouns 103K
If we loose that then 100K and then we land on that red 236 Fib circle that will offer a sliding line of support.
But I do not think we will get there just yet
Enjoy
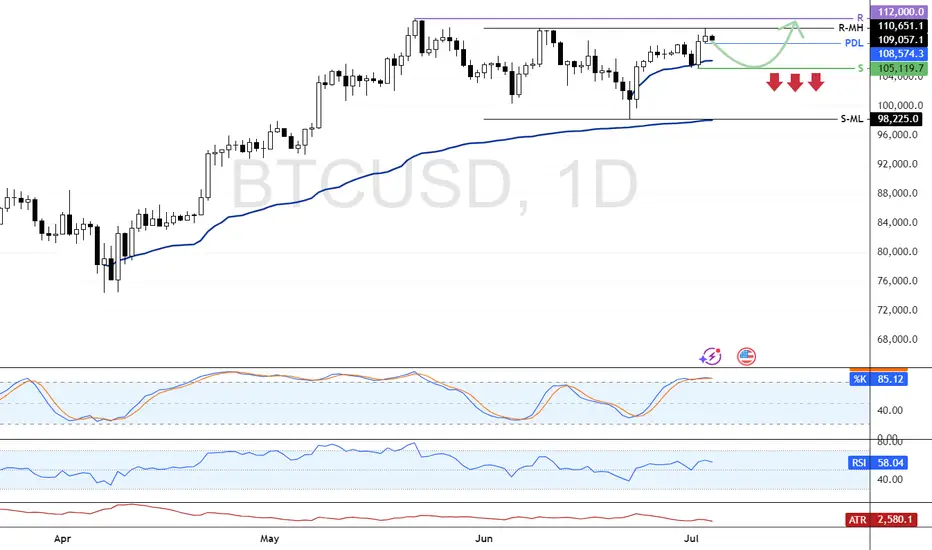
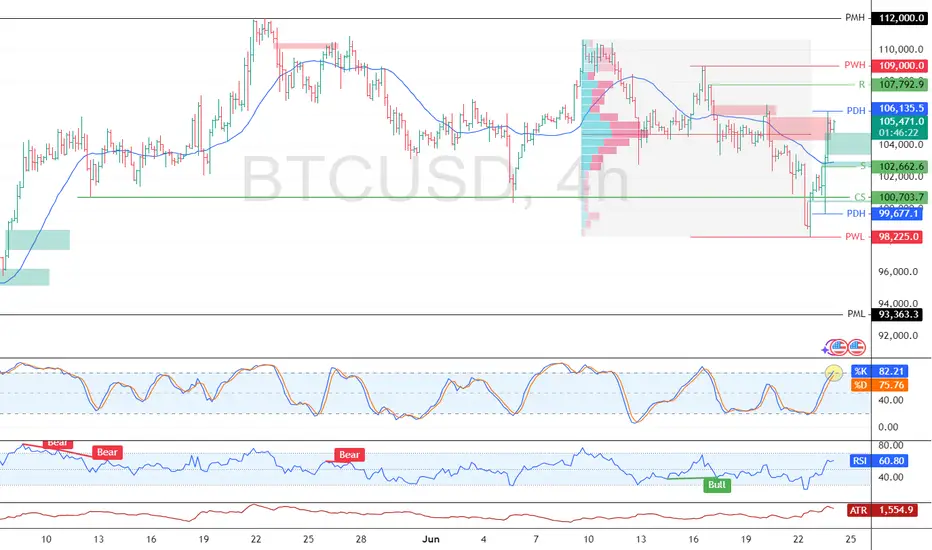
Bitcoin Eyes $110K Target Above Key Support LevelBitcoin trades slightly below last week’s high near $107,660.0, while RSI 14 shows bearish divergence without a clear downward move.
Immediate support is at $107,230.0, and resistance at $108,550.0. If BTC closes above resistance, a rally toward $110,651.0 may follow. The bullish outlook remains valid as long as the price stays above $104,681.0.
Bitcoin Climbs Above $107K with Overbought Signals in PlayBitcoin closed above the 107,792 resistance after breaking the previous day's high. RSI and Stochastic indicators show overbought conditions, signaling short-term overpricing.
BTC may test the $109,000.00 resistance next, followed by a potential pullback toward $104,618.00, offering a favorable entry point for bulls.
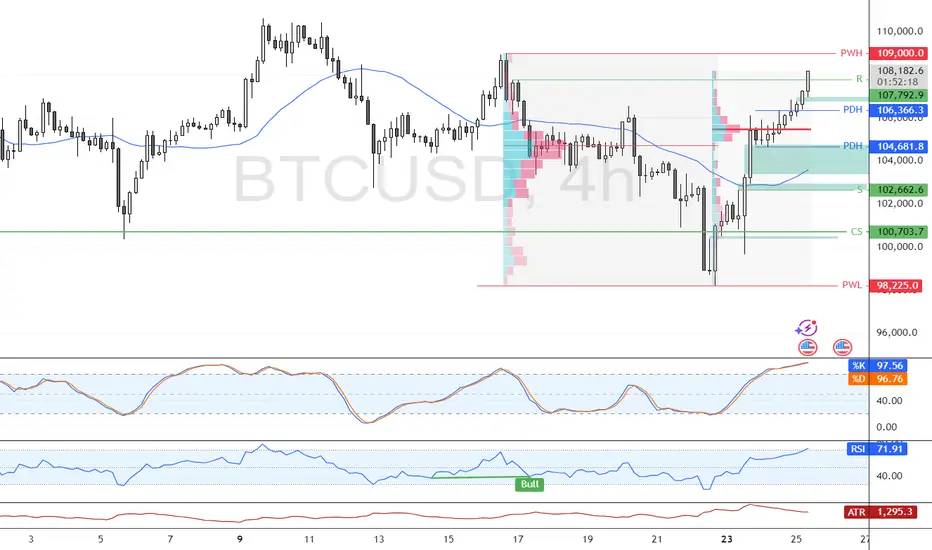
Bitcoin Rebounds Above $105K After Liquidity SweepFenzoFx—Bitcoin swept liquidity below $100,703.0 and rebounded to around $105,400.0, just above the volume profile point of interest.
Immediate resistance lies at $106,135.0. A break above this level could lead to a retest of $107,702.0. However, if resistance holds, BTC may consolidate toward $102,662.0, supported by Stochastic overbought signals.
Bitcoin Closed week RED and opens Green but is back in channel
As the title says, BTC PA has fallen back in channel that offers a potential low in the High 80K should confidence fail.
PA also lost support on the Local 2.618 Fib extension.
This is a shame and poses potential problems reclaiming that.
I will say, that I do not consider this a long term Bearish beginning but it could certainly add to the "Calm" Summer I have talked about.
I say "Calm", that does depend on the world not entering a level of Madness.
The Zoomed chart below shows more detail
Here we can see clearly how PA got rejected off that upper trend line, fell through the 2.618 and is currently being rejected by it.
The potential for a further drop does exist and if we repeat the "Pattern" we have since the beginning of 2024, of bounce off Lower trend line, get rejected from Upper zone, re test lower as support and bounce again, we can expect to revisit 89K
This idea is supported from this LINEAR Daily chart
The dashed Trend line that is arrowed has origin in Sep 2024 and was also used again in April 2025.
That intersection the arrow points to is the intersection with the current supporting Fib circle at around 88500 USD
None of this is certain but these levels exist as support.
PA also has the ability to move higher
The Weekly MACD below shows us how MACD is turning down towards its signal line ( red)
We did this before in Jan 2024 ( Arrow) and The MACD bounced.
We talked about this possibility a few weeks ago But on a Daily MACD, things do look a little different.
The FEB 2024 looked like this, Bullish, rising and above Neutral
Currently, the Daily MACD looks like this
We just fell below Neutral and the Signal line just hit it
We may seea bounce but we need to have the idea that this may continue to drop a little further.
But the White bar on the Histogram shows us some recovery is currently in progress
We will have to watch the rest of this month closely. This time next week is last day of month.
I have mentioned a number of times that a small RED Month candle would be potentialy good.
We are currently Only just GREEN, so a further Drop in price is actually almost expected this week.
Interesting days ahead
Bitcoin Daily, Something for the weekend Sir / Madame ?This will be the main chart and 3 indicators that could be telling us something.
Main chart is the Heiken Ashi. Each candle starts in the centre of the previous one and so we get rid of noise and get a good understanding of possible Trends.
And Right now, CALM is not the word ! Candles are getting smaller and smaller.
However, we do seem to be forming a bullish pennant with an Apex at the end of the month.
PA always reacts before the Apex.
Other things to note here is that we are now using the previous line of resistance as support. Look back to Dec 2024 to Feb 2025. It was this line that put as back down to 75K
We have tested this 4 times in a small way But not in a real Meaningful Way yet.
Do remain Cautious.......but that 2.518 Fib extension should hold us in place if we drop but there could be a much deeper drop.
But lets take this step by step as there are some Very Bullish signs to.
The ADX chart below shows us that Change is near.
Remember, ADX ( yellow ) NEVER shows trend direction, just trend strength. As you can see, it rarely drops much further below this point and does not spend to long here.
SO, current trend is Weak and a new trend is likely in the near future ( this could be tomorrow or in 3 weeks..near future is a wide window..but it is not 2 months or more)
The DI + ( orange ), positive Directional price Index, and the DI - ( red) , negative Directional price Index, are also low, showing no real price action.
This can happen for longer periods of time and it is impossible to say which will rise, However, as we can see, the price movements have not been huge and so to expect a sudden Massive Dive, as some are suggesting, is not really backed by anything.
But we should never say never. Be cautious
Accumulation / Distribution chart below
What is nice about this, is simply that Accumulation is still the MAJOR movement. The majority are still accumulating and so the idea that we maybe in a Bear market is almost Dismissed. People would not accumulate an asset that is about to Dive for a long eriod of time....Normally.
There has been distribution, as marked by the RED zones. This is heavier distribution and as you can see, this Stopped at the beginning of this month, having begun when we reached the high towards end of 2024.
So many thought that was cycle ATH
They have seen the error of their ways BUT, Again, remain Cautious till we see a bigger move higher.
And now my favorite, MACD
And for me, this is where we will see the decision being made. We are approaching the Neutral zone
Last time we bounced off this area was in October 2024 and we went from 70K to 109K
BUT remain cautious, we have every possibility that we may fall through the neutral zone for a while too....But we are in an area that could show us a time to move.
This is a LINEAR Bitcoin Daily chart
And those descending lines are FIB Circles and you can see how PA often runs along them.
You can also see how we are in a Pinch, a tight Squeeze right now ( arrow) with Horizontal line of support and the rejecting red 236 Fib circle.
That Apex is, again, at the end of the month.
So, to conclude, we are certainly heading towards a Move and possibly a new trend.
I like to think this will be Bullish but there are plenty f reasons for Caution.
I will remain with my Monthly charts that suggest June may be RED and that after than we will see more Green.
A Dip is possible and I have New Buy orders around 98K incase PA wicks down to them but there is NO guarantee this will happen...OR if it does, that it will stop there....
We just have to be prepared.
Stay safe

BTC/USD Faces Key Support—What’s Next for Bitcoin? FenzoFx—Bitcoin dipped from its $112,000 monthly high, now trading near $104,900. Liquidity was swept, forming immediate support at $102,746.
Stochastic signals an oversold market, suggesting potential consolidation or an uptrend resumption. BTC/USD must close above $105,706 for bullish momentum, targeting $112,000.
A rejection at $102,746 may invalidate bullish outlooks, driving BTC toward $100,377.

Bitcoin life cycle-stage One ending-Next cycle has to start NOW
There are 3 things to see in this chart
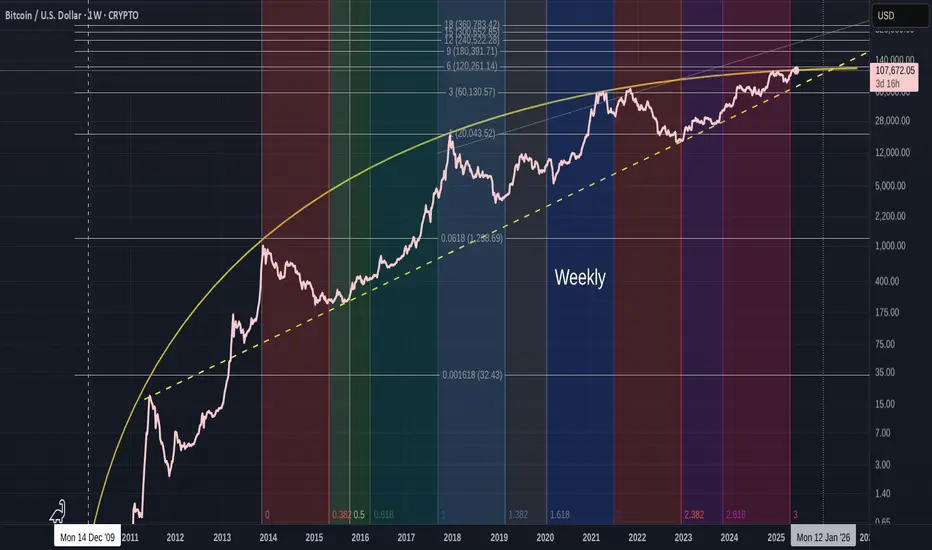
1) The Orange Arc of resistance. I have talked about this previously but to recap a little, it has its origins in Oct 2009 and has rejected EVERY ATH since then, as you can see on the chart. The Arc itself is part of a Fibonacci Spiral.
This Arc has begun to Squeeze PA against the lower trend line, that was formed in 2011.
And we are now in a position where PA MUST react or get pushed below the Long Term line of support.
This could be called Make or Break time for Bitcoin.
The Apex of this pennant is around Jan 2026
PA always reacts before the Apex.....99% of the time.
2) The Vertical Coloured bars are Trend Based Fibonacci Time, It begins on the 1st ATH in the channel that Bitcoin created. This channel is shown in the chart below
See how the Runs to the 2017 & 2021 ATH were all in a Bullish Green zone and how PA never retouched the lower trend line of support in this time
Since Mid 2021, we entered a Bearish Zone.
On the main chart, you will notice how this Fib Time has just ended.
3) The Trend based Fibonacci Extensions. Every single ATH rejected off a Fib extension.
The Root is at the 2009 Low and 1 is at the First ATH in the Bullish Fib time Zone.
The numbers here are all based off the 3,6,9 number sequence.
Lets look a little closer at the weekly chart
As we can see, PA got repeatably rejected off this orange Arc of Resistance and Current PA has been up there, trying to break through since 2024.
Many people have also commented on how PA has been so subdued this cycle and could this be reflected in the Fib Time showing us that we are in a Red Bearish Zone.
See how, from Mid 2021, when we entered a Strong Red zone, PA took a Deep dive off the Nov 2021 ATH.
Also note how this zone ended in late 2022 and in Jan 2023, PA began its current cycle Run. See the change in Colour ?
And Currently, while Bitcoin tries to break out of this squeeze, we were in a Red zone again....that just ended.
AND we can also see that we have not yet reached the 6 Fib Extension at 120,251 usd
The situation we face here is that if PA gets rejected off that Fib line, having just broken through the Arc, we could get pushed right back down under the Arc again. It is VERY STRONG RESISTANCE
This next move from Bitcoin HAS to be strong enough to take us up to the 9 fib line at 180,391 usd at a minimum. This way we can use the 6 Fib extension as support when PA cools off from a big push and so remain above the Arc and begin the Next long term cycle.
The Daily chart below shows us where we are right now
You can see how PA has repeatably tried to break above the Arc and been rejected Firmly Every time...so far, PA has avoided going right back down to the Lower trend line and has remained in near distance to this Arc..But we are running out of Time.
Recent attempts by PA have been Strong and I am sure that we will make it over but the real question is can we also get over that 6 Fib extension and stay above.
The weekly MACD certainly has enough strength to cope
Should we have a subdued Summer trading on Bitcoin, we will see this MACD cool off and be stronger before a sustained push near Autumn maybe.
To conclude, Bitcoin is under pressure to move out of its First Full Cycle.
It is getting Squeezed and now it is time for Bitcoin to prove it can cope with its new found "Adulthood"
The Next Big push, maybe later in the year, could very realistically reach 200K or more and this would place us Above that 9 Fibonacci extension I talked about earlier.
Of course, events could change and we could see PA collapse back below the Arc.
If this happens, all is NOT lost but it would certainly weaken the case for Long Term holders to continue doing so.
This then could create a Snownall effect and prices may tumble....And I will buy MORE....
Either way, we are in a HUGE moment for Bitcoin and I am privileged to be able see this all unfold...
Lets see what happens but, for me, I am Still VERY Bullish though Cautious....
We may have to revisit low 70K in the near future if Pa cannot get over this Arc and the 6 Fib extension
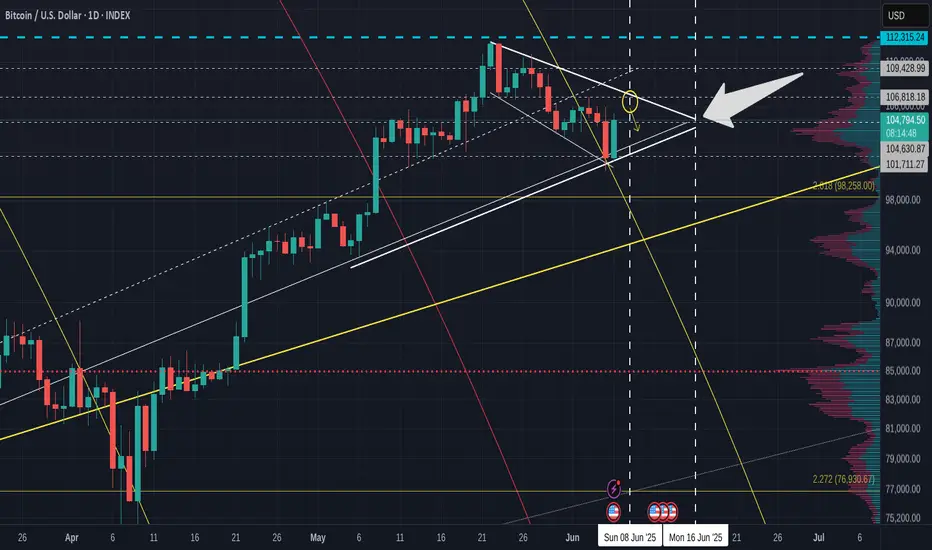
Bitcoin DAILY & 4 hour charts show possible push in 10 days ?
First of all SORRY for all the lines.
This is a working chart but they are all relevant to this post.
Main chart is DAILY and shows ua the Pennant that we appear to be printing with the descending channel inside. The diagonal line falling is the Fib Circle we recently broke through.
See how, once above the fib circle, we slid down the outside, using it as support, as we often do.
Then we hit another line of support and that created this recent push higher.
Should we continue, we will most likely go to the upper trendline, towards that circle. Circle center is around Sunday 6th.
While we are still on the daily, see that Pennant Apex...that is a Week on Sunday, the 15th.
99% of the time, PA reacts BEFORE the apex.
Should things continue, we can expect to see a rise till end of weekend, Rejection back to lower trend line and then a Rise and maybe a push Out of the pennant to new highs.....OR, and I think this is very probable, we go back to around the ATH line ( blue Dash) and Dip back down again.
It is worth remembering that we have inflation data being released in the USA next week.
People will likely wait to hear ths before making to many big moves.
The Daily MACD offers some guidence on this also
MACD nearly back on Neutral and could bounce. The Dashed line is this sunday.
MACD could continue to drop below neutral, we shall have to watch this closely.
As I mentioned, in the short term, BTC likely to reach for this circle in the 4 hour chart below.
I will admit, I expected PA to reach this point in a differnent way as posted earlier in the week, But, Hey, we still getting there..
Should we get rejected there, as I expect we will, then a revisit to 103K before a push back.
But given the inflation figures, things could get very volatile next week so CAUTION
We can see on the 4 hour MACD how we have already been rejected of Neutral once and we are heading there again
The potential to push through the neutral line exists but.......
I do expect some volatility and so we need to be aware things could change rapidly.
The inflation data is a key. Depending on if it is drooping, rising or flat, this WILL effect the situation with regard to the FED Rate decision later this month.
So, we wait, with caution and expectations
Quick BITCOIN update using old Fractal chart - a small red June
Bitcoin appears to be taking a rest when it is strictly not required.
We are heading towards the 2nd dashed arrow, which as I pointed out months ago is a very possible and more realistic path for Bitcoin to take this cycle.
We have left the 2013 - 2017 Fractal and yet are likely to follow the idea of moving higher to a new ATH from this level off the Fractal.
PA entered that circle I drew back in Feb and is still in it right now, as we can see in the chart below
We can also see how PA has bounced off the 50 SMA on this daily chart.
This does NOT guarantee a continued move higher but it may offer some levels of support.
Should this fail, we do have various levels of support down to around 94K
I will refer back to a previous post and mention that to some extents, I am expecting a RED June. This does not need to be a Big candle, just 1 usd less than the open price wil create that.
104648 was the open price, so, we can easily stay above 100K and create that red candle.
Why do we want a red candle..?
Because, to put it simply, statistically, we have a better chance of continued monthly Green candles after a red june this time
I will attach the chart below so you can read about this in more detail.
This may or may not be good for ALTS>.... but I do not have many now.....just my preference
