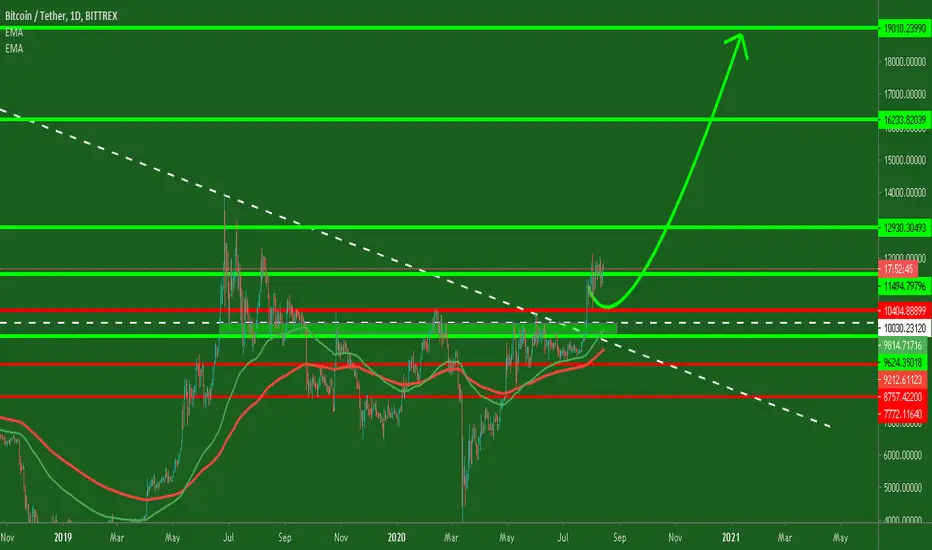
My take on BTCUSDMy analysis of BTCUSD is simple and straightforward. We should watch and see if it's going to break above 14.5k or the bears will jump in at the longer-term resistance line. Bitcoin is more likely going to drop to the 13.6k support on the 4HR chart if 14.5k is not broken. If that happens, we might see a further drop to 12k.
However, closing daily candles above 14.5k is a sign that Bitcoin will head back to 16k and 17k eventually.
I'm more bearish, but the news and the USA elections may not respect technical analysis.
Bitcointechnicalanalysis

Bitcoin Price Action Technical Analysis of Bitcoin price action as you could see on the chart, bitcoin is on a uptrend; not for long however.
Due to the strong resistance at area 1470.00 price might fall all the way to the 10600.00 or even lower.

Long Position: Bitcoin into the descendent triangle!!!IN H1 timeframe there is a good opportunity to buy Bitcoin just for gains limited, because Bitcoin is formed a descendent triangle and trend is becoming morbearish!!! Now, we are in this simetric triangle flag, but as reference we touch an important support that bulls are make resistance on this zone!!!
Remember that in H4timeframe there's a limited gains until the $11,540 USD. And approximately in this price, we turn to put in short position approximately at $11,500-$11,600 that is a good zone to short position until the $10,500 USD to pick down benefit on Bitcoin.
And rememebr that we're here into this simetric triangle of re-accumulation, but for the next days we hope htat Bitcoin is leading to the $10,500 USD to then, put long position!!!
Good luck on this long posiiton trade.
I put a buy order limit at $11,260 USD wiht a SL at $11,080 USD and my target profit will be $11,540 USD.
Good luck!!!

Bitcoin Technical Analysis: BTC Retreat Imminent
Bitcoins bullish momentum loses steam on encountering the 50-day EMA resistance.
Declines linger as long as BTC cannot climb above the 50% Fibonacci level.
Bitcoin explored levels in the key support range between $10,000 and $10,200 earlier this week. The last few days have been used by the bulls to correct the retracement from the resistance at $11,200. Initially a hurdle at $10,600 sent buyers back to the drawing board. However, Bitcoin sprung upwards once again on Thursday. This time the hurdle at $10,600 was easily pushed into the rearview. Unfortunately, bulls seem to be struggling with the resistance at the 50% Fibonacci taken between the last swing high of $12,484 and a swing low of $9,050.
The Relative Strength Index (RSI) has recovered from levels closer to the oversold but is holding ground at the midline. A sideways movement suggests that bulls are getting exhausted. It is essential that the resistance at $10,788, a confluence formed by the 50-day Exponential Moving Average (EMA) and the 50% Fibonacci level is overcome.
The movement to the north will give the flagship cryptocurrency energy to bring down the resistance at $10,800. Buyers will also get an opportunity to shift their focus to $11,000 and $11,200, respectively.
It is worth mentioning that the failure to rise above the immediate resistance at the confluence could culminate in Bitcoin settling for a retreat in order to create demand at lower levels. On the downside, support is envisaged at the 100-day EMA. If declines overshoot this zone, the support range at the beginning of the week will come in handy. Note that, September’s primary support at $9,800 remains intact and the last resort that could be used to halt declines eyeing $9,500 and $9,000.
Bitcoin Intraday Levels
Spot rate: $10,706
Percentage change: -0.32%
Relative change: -0.34
Trend: Short term bearish bias
Volatility: Low

#BITCOIN/USDT TECHNICAL CHART ANALYSIS & PRICE ACTION MOVES#BITCOIN/USDT TECHNICAL CHART ANALYSIS & PRICE ACTION MOVES

Golden Cross, Death Cross, and Halving - Time ComparisonsUsing a 50/200 MA I've laid out time frames between the various occurrences of golden crosses, death crosses, and halvings.
Wanted to share with the community and see what theories any of you may have from seeing this and if you're noticing any patterns.

REMEMBER THAT WE ARE STILL UNDER A DEATH CROSSTHESE ARE THE FACTS
We are still under a death cross
We have not made a higher high yet.
We have not surpassed major resistance.
Volume is only moderate.
Even though we saw a massive green candle we are still on a downtrend, so short term traders make sure to use your stop losses. If I was in for short or midterm trading I would be nervous that he death cross could yank the leash any second.
Please hit the Like button and Subscribe so that I can keep bringing this daily TA to you.
WHAT IS HAPPENING RIGHT NOW
This is the "Total Market Capitalization" chart. Price has not been able to get over the 200MA over the last 4 days, which is how an asset behaves during a death cross. Typically what happens is that it will try to go over the 200MA or 50MA until it becomes clear that there are no buyers and then it will fall to the nearest strong support. There's mad support just below where the price action is sitting but it may not be enough.
I'm not liking the looks of it at all. If I had short term goals I would close my position right now. Why? Too much resistance and not enough volume. We can always hop back on the pullback and upon confirmation.
SPECULATION
That big up move was just to cash in on short positions and what we see left is the carcass, with no real buyers BTC's price may start to come down and behave more like it should while under a death cross.
Also, there's the 50MA on the 3D still stopping any further move up. Just something to think about for mid to short term traders.
You can still jump in but set Stop losses and make sure they are not too low.
This is a link to my live chart so you can keep an eye on that battle. www.tradingview.com

BTCFinal destiny to the buying level for this year 2019. Level watching is 7274 ( personally i have a buy order at 7300). While this is not the perfect support level, the major one is at 7022. It would be really disastrous if it breached this level and closed below it. Still riding the sell signal which is close to turning into a buy signal. Not a good price to short now. This could happen before Oct 30th with probability of it happening on the 27th/28th of Oct.

BTCUSD Failing to Rally Past 21EMACurrent trading path showing signs to break to the downside, unless a surge to the upside is realized. We failing to rally past the 21EMA, even if that is breached we would need to blast past the 55EMA to register any bullish movement.
Bull Targets:
10500, 10800, 11500 so much confluence on the way up we will likely not rally past that unless some magical volume pushes us past that
Bear Targets:
10000, 9700, 9000, 8500 (Unfilled CME gap) very strong resistance on the 10000-9000 range a clear pass of these range is needed for further lows.
As always Trade Safely, Happy Trading!

BTCUSD Housekeeping, Zoom out for clarity!Been a while since we looked at bitcoin, that's cause a lot of sideways move makes for boring reviews. So here we go after the recent dump we have removed some clutter out of the chart and zoomed out for a bigger picture type of trade opportunities.
What's new?
-Bitcoin is approaching what we believe is the strongest resistance line going back to its first ever parabolic move
-Failure to hold this line will see us crashing hard into yet lower lows and most likely revisit 7000 ranges
-As time passes with more and more drops we being squeezed into an ever tight channel and 10000 becomes support the bulls don't wanna drop
What's the Good News?
-Well, one could short until 10000...will take some balls, or paws!
-A trend reversal is always looming, the RSI is extremely oversold, flirting below 30
-Targets for the Bulls should that rally come 10900, 11400, 11800
-Breaking the sloping resistance could see us retesting 12300 failure to breach it would see us rinsing and repeating the same old trend
As always Trade Safely, Happy Trading!
Words from the skeptical: Bitcoin is nothing but a Ponzi Scheme for the moonboys, this is not financial advise, I am nothing but a moonboy!

BTCUSD...Guess that was the top...for now!Like text book we failed to breach 11000-11200 range and we now as of writing back to 10600 and falling, play your cards close to your chest though as this may very well be a fake-out to squeeze longs out as well. My last post has the whole story, it may be found on the chart itself or related posts, be kind to have a look, not much to say right now.
BEAR TARGETS aka support ranges:
10400,10200,9700, worst case 9000
BULL TARGETS aka Resistance ranges:
10700, 11000, 11500, best case scenario 12000. Please note that 11300 to 11500 has so much confluence is not even funny.
A word from the Greats: Rome was not built in a day, take your time with this Trades.
As always Trade Safely, Happy Trading!

BTCUSD Either way we going up...What's the Top Though?!No matter how we look at it we look at it the bulls are in control after breaking the 10700 mark on the first attempt. We now well poised to climb towards 11000, breaching this could see us on our way towards 11500 and possibly the holy grail of the current rally at most likely 12000, anything above this should be considered a bonus. Please note this would needs to be catalyzed by a breach of 11000-11200 marks.
Now onto the bear side, failure to hold 10700 might see us tussling with 10400 again probably ascend from there, failure to hold 10400 will see us drop further towards 10200 and hopefully hold fort there otherwise 9800 isn't too far away. Rinse Repeat i guess.
Words for the wise: This might happen all in one swift long fast candle as well, so have your running boots while you sleep! This is by no means Financial Advice!
All things considered, Trade Safely, Happy Trading.

BTCUSD its a Candle Trend Line Love...until Whale! LOLDont you love it when candles make love to trend lines, they just meander as expected and every piece fall into place? Thats the beauty of technical analysis. Poetry aside, a re-cap of what happened:
1- A steady EMA
2- Slow climb towards 10200
3- A breach of Resistance at 10200
4- A rejection almost to the T on the sloping resistance and the extrapolation of the first parabolic break
Whats next?
1- We will trade on the apex of the triangle most likely in a steady fall
2- Current Resistance at 10500 and falling, a clear break would take us towards 11000
3- Current Support at 10200
My take:
1- As long we keep above 10200 we are bound to break to the upside
2- Should we breach 10500, next major Resistance would be 10700
3- The current Resistance and Support difference is so tight its best to trade massively bearish only if you bearish or massively bullish only if you bullish, eliminate half of the problem and focus on one.
Word of Advice: This is not Financial Advice!
As always Trade Safely, Happy Trading

BTCUSD Unnatural Dump is Matched by Natural Pump!?After the epic 6% dump and pump, yup dump and pump that brought coinbase to its knees for a moment, we are now followed by the actual natural breakout to the upside. We now looking healthy to either slowly descend again or break the sloping resistance towards the next horizontal resistance.
Targets:
-On the upside, 10200, 11100 and 12000
-On the downside, 9300, 9000 and 8500
My take:
We are still looking bearish unless you comfortable trading a squeezed pattern then we could break the sloping resistance and re-test no higher than 9800.
As always, trade Safely, Happy Trading.
A word of ADVICE: This is not Financial ADVICE :)

BTCUSD Heading towards 9000 and possibly below it!?We currently painting the mother of all dumps of a candle that will easy match the 10% crash seen not long ago, next target 9100 and below. A reverse will see us back again on the meandering uptrend and downtrend that plagued us the past two weeks.
As always, Trade Safely, Happy Trading!
A word from our sponsors: This is no financial advice!

BTCUSD Trapped in another slow downtrend!After breaking to 10200 as expected, we again trapped at yet another potential slow downtrend towards 9800, 9700,9600, 9400...bottom line we have created so much confluence with indecision there is no clear signs of a major break. Bitcoin is now trading more like a stable coin than the volatile monster that we came to know. I will be adjusting the orange slopping resistance as the trend paints a better picture of direction, the rest have been playing in line with the trend so far.
Play your cards close to your chest, buy what you can afford and dump only at a profit, do not feed the whales.
That said Trade Safely, Happy Trading.
A word from the greats: This is by no means financial advice, I am just but a foolish bull!

BTCUSD trend is your friend until it isn't!So far we following predicted moves, gradually moving down and respecting all supports, it may charge up at once or gradually keep crashing, so if you believe that we will bottom at 8000 wait for 8000 otherwise DCA at key points.
As always, Trade Safely, Happy Trading.
A word from the Greats: This isn't financial advice!

BTCUSD Head and Shoulders pattern, back to 10000?!We currently squared off the way up with a similar way down from the latest high. Whats next then? We will rise back up and re-test the sloping resistance, if rejected we will bounce back down and re-test the sloping support and a possible drop towards 10000 given the current Haed and Shoulder pattern. Bulls will be awaiting that range as well and if they fail to defend it we may crash as far as 9700-8000 ranges.
So far so good though, Trade Safely, Happy Trading!
A word from our sponsor: Let good old TA lead the way, this is not financial advice.

BTCUSD Past performance does not indicate future results?!Well, not much to be said here, looks a whole lot like the same scenario unfolding before us again, a long bull candle followed by a lot of indecision then came down crashing, but then as they always say:
Past performance does not indicate future results
As always Trade Safely, Happy Trading.

Near the buy zoneI drew a line in red, it is important because it connects the ending point of wave 1 and wave 3 and respectively there is green line parallel to red line but from ending point of wave 2
These lines are drawn professionally and are not simple channeling lines. So draw it for your self it is going to be a significant line in the future.
Back to elliott, i think we are in a complex corrective wave and i should ask, where is the best place for this kind of corrections ? The answer is wave 4
I did a lot of time in chart and i realized that this is most correct way to count. And i think we are not yet completed the 5 wave pattern and we are in wave 4.
So i think there is two options now.
1-we are forming a triangle
2-we are forming a complex WXY or WXYXZ
But also there is a chance to form more complex forms of correction or starting a new motive wave toward the downside but right now i dont see anything like that so i leave it there for more price action to have, to give a thought
Have fun
Stay tuned

BTCUSD Speculative move to the upside in 1h, 11700 Resistance!Should we maintain the current steady uptrend on the hourly and 5 minute charts we may re-visit 12000 by the end of the hour provided we break the 11700 sloping resistance line. Happy Trading.

BTCUSD Sloping channel serving as tentative upward resistance!Yesterday we broke down past 11500 in a tight hourly channel we, then move gradually on the 5 minute trend and have steadily embraced the 11500 sloping parallel channel, a break up could see us re-enter this channel towards 12000. Expect a lot of up and down movement in the next few hours and a lot of bot action. Best consider DCA for entry and exiting strategically for small scaling profits.
As always, trade safely, Happy Trading. I will be attaching only my last 3 posts as related links as time goes, you welcome to dig deeper on my files for the step by step analysis that got us this far.
