Is 16000 - 19000 Possible for BTC??BTC Analysis
CMP 66200.71 (05-02-2026)
Hit the Target of Cup & Handle around 120000 - 123000 & then crashed.
Now it may bounce back from 61000 - 63000 towards 80000.
However, breaking the important Support zone (61000 - 63000)
may drop the price further around 48000 & then around 33000.
For long term investment, the most attractive buying range is
around 16000 - 19000 (if it comes).
Bitcointrend

Bitcoin back in the fight and under pressure. MAJOR resistance
While we all remain ever so Bullish and LONGS increase, we REALLY need to remember just where Bitcoin PA is Right now.
In an area that could very easily turn into a Bear Trap, as it did in 2021
Why could this happen?
WE ARE UNDER MAJOR RESISTANCE.
Why ?
Looking at the chart justt above, we can see that rising Trend line..This is NOT a Weak line.
Here is the same chart zoomed out.
To Cross this line and remain above it Will be just the First Step towards a new ATH.
The MAJOR Wall is as we get near that 100K -> 106K line.
Remember this Chart ?
The Blue Arc of Resistance. The One thing that has rejected EVERY Bitcoin ATH since Bitcoin started.
This line MUST be crossed but is Obviously HUGELY STRONG
A Closer View of where we are now on this chart.
So, that current green candle we know is just under that Cycle line of resistance mentioned earlier.
The next step is that 50 SMA ( Red, Just around where we see that Blue Arc.
AND we see PA in a Squeeze.
We have come back up to this and approach a new APEX around end of March 2026.
PA always reacts before the APEX>
We now have PA snadwiched between the 50 SMA and the 100 SMA ( Blue )
That 100 is also around that LONGGGGG term line of support
We really do NOT want to loose that support.
But this may happen if we do not break through that Blue Arc.
But we have talk of New beginnings for Bitcoin......
New Cycle patterns appear to be forming
Super Cycles are possible as we see signals that the 4 year cyce pattern maybe ending,,Yet to be proved.
And this could happen with out Major change to long term PA patterns.
This would NOT involve dropping out of the Area PA has been in since 2017
PA can drop as low as 60K before long term Channrl is Lost.
So, here we are, New patterns maybe forming and we will not know for a Long time yet. Proof of change is onlly seen afterwards
Should PA break over that Blue Arc, It MUST be used as support after.
Fasinating Times......Watch that 50 Month SMA closely.
We Break that, Off we go
So, we wait

Quick 2 chart 4 hour BITCOIN UPDATE ] BULLISHMain chart shows that BTC PA has pushed well above the Blue line of long Term resistance / Support and now could come back down and test as support.
This could easily happen and we will see why when looking at the next chart-
4 hour Linear BTC chart
PA has come up and has hit the Fib circle I been talking about for the last couple of days.
PA has the ability to push through but it may not, and if not, we could see PA drop, Firstly to the 4.618 Fib Extension @ 90400 usdt and if that fails, maybe to the Red 236 Fib circle....around 87K
BUT if the Bulls get us above this Fib circle, then we face the rising line of resistance at arounf 95K...That one could be tough
We will have to wait and see...But the BULLS are here for sure

Monday morning BITCOIN Daily Update- Big day maybe..............
We got that push higher from Bitcoin that was talked about on Friday but it is now up against some tough resistance.
That Blue line is what we need to Cross and hold as support if PA is to move higher towards that expected New ATH this Quarter.
The weekly chart shows some of this long Term trend line.
AS you can see, this blue line was used to launch PA up from the Bear Low in Jan 2023
PA currently sits BELOW this line.
A Rare Thing
The Daily Bitcoin chart
THIS is the target this week, to get back over that line.....
It is Crucial.
The Daily MACD
MACD has leveled out and so has the histogram. This is Bullish as it shows the Bulls Are there, holding things level and NOT dropping and letting the Bears take it all back.
The Daily RSI
RSI continues to climb and back above its own Avaerage. Bullish but we need to watch that line above, the solid descending line has rejected RSI a number of times now. ( not shown )
I remain confident that Bitcoin CAN move higher, it is just a matter of waiting and seeing if the Bulls can beat the Bears on a longer term.
In the short term, we have this...........
The 4 hour Bitcoin chart
See the Wicks that go above the blue line...that shows the Bulls pushing PA pver that line of resistance and the Bears saying "NO" and pushing it back below.
THIS is the fight this week
We need to get above this line or face a deeper Drop
Stay safe and be nice to each other.

Bitcoin Daily update - support retest failed but all not lost
PA came back down to retest the previous resistance and it failed as support.
Bulls have caught the fall for now and we wait to see what happens today.
PA currently sitting on a line of Support on the VRVP
That is a shorter term 4 hour chart showing more details for the near term
The Orange dash line is the Value Area High. Hopefully this wil hold.
Below that, we have the POC, Point of Control at 87500 area.
The 4 hour MACD
We can see the MACD has fallen below neutral and the histogram shows that fall not enfing soon. Lets see what happens when IF the Red signal line hits neutral.
The Daily MACD
We can also see the daily MACD turning over a little as the Histogram has turned white for 2 days
A lot points towards PA maybe dropping back to the High to Mid 80K mark but I think we may see that reversed a little today.
We Just have to wait and See.....
Time always Tells

Bitcoin (BTC/USDT) – Monthly OutlookThe new 12-month candle has just opened with Bitcoin holding firmly above prior macro structure. Price is consolidating just below the previous All-Time High, showing acceptance at premium levels rather than rejection.
Monthly market structure remains bullish, with higher highs and strong candle bodies signaling continued demand. The lack of deep pullbacks suggests sellers are being absorbed, increasing the probability of a clean ATH breakout and continuation into price discovery.
As long as price holds above the yearly opening range, the bias remains bullish.
Bias: Bullish
Expectation: ATH break
Invalidation: Monthly close back below prior structure

Monthly Bitcoin Candle Colour Closes since 2011 - December closeDecember closed RED
If you have been following these posts over the months, you will know we have been following a colour sequence that has lasted 11 Months. This has NEVER happened before in Bitcoin History and it repeats the beginning of the 2023 Recovery / leading to Bull Run.
However. the Red December close ends that sequence....
As mentioned last month, The Red candle was the highest probability.
There were only 2 choices as to trying to predict the December Candle and the small RED candle was the better option..Because it may point to PA repeating what happened in January 2023, when Bitcoin came out of a Bear market.
This small red candle is the same size as the one we Had in December 2022.
Both the preceding November Red candles in 2022 and 2025, were the same size at around -28%
Dec 2022 was -10,6%
Dec 2025 is -11.6%
Remarkable similarities but only for 2 candle sequence so far.
Should this repeat the Mov. Dec 2022 and January 2023 pattern, we may expect the possibility of a large Green January.
The chances of us repeating that left box again are very VERY Slim, Mostly as we have just done so for 11 months previously..BUT statisticaly, Januarys are Green more often than Red.
Zoom into the main chart
But, lets be realistic, if we are in a a BEAR Market, then a RED January is highly likely,as in 2022 ( left dashed box) , But.......
If we look at the Dashed Box From JULY 2021 to the 2021 Nov ATH and then to Jan 2022, we have got a series of 2 x Green, Red, Green, 3 X Red ( the last Red candle was JANUARY 2022)
We have just done the same from June 2025, a month earlier, so our most recent 3rd Red candle is December 2025 ( right dashed box ).
In 2022, the candle after the 3rd red was Green...that, again points towards a Green January for us. IF WE FOLLOW PATTERN and it needs to be remebered, that this price action was a brief pause in the Deeper Bear that was yet to arrive.
The chances of us having a Red January and so making 4 Red candles in a Row is also slim. but not impossible.
Previously, we have only ever had 4 Red Candles ( or more) groupings :- ( Arrowed on chart )
August to Nov 2011, (previous PA unknown)
July to October 2014
August 2018 to January 2019 ( 6 months )
These were in a Bear Market. But in 2019, this was followed by 5 months of Green.
Previous JANUARY closes are 8 Green to 6 Red
4 of those Green Closes were after 2 or More Red months previous.
2 of the Red Closes were after 2 or more Red Months previously.
This also points towards a higher chance of a Green January.
7 of those Green January closes has a Higher price in the year, than the closeing January candle price.
5 were followed by a Green Febuary
All 6 of the Red January closes are followed by a small green Febuary
HAPPY NEW YEAR TO ALL

Here is How BITCOINs Historical Cycle Could Pursue.Hello There,
recently I spotted an important constellation within the cycle of Bitcoin, which caught my attention and is extremely crucial for the forthcoming of future price actions. While Bitcoin, in the short term, is still extremely bearish with many bears and whales dumping into the market, the middle-to-long-term perspective should be considered from a different angle. In this case Bitcoin could be about to pursue an extremely important cycle, which was already the origin of a massive peak expansion, boosting Bitcoin into massively high spheres.
Currently, Bitcoin could just be in the middle of this massively underlying cycle trend, which could repeat itself in a different shape to turn out with a fundamental reversal and increase of volatile price outbreaks. Such dynamics are always interesting to watch for traders when considering placing a trade in a breakout pattern and simultaneous setup for a high profit. This whole cycle mainly consists of 5 elements, of which 2 have already been completed in the current constellation.
You can watch all the important levels of cycle progress in my chart. What is highly important and a necessary factor for the current cycle to hold and continue as well is that when bearish volume increases in the short term within the next times, Bitcoin has the ability to continue seeking support within the range. If this does not happen and Bitcoin does not show the ability to hold the $45,000 to $50,000 range, then the potential for a downtrend continuation increases.
If this scenario happens, there are two possibilities. Either Bitcoin expands the current uptrend channel to lower levels in which it seeks support within the lower accumulation channel line marked in green, or a black swan event such as corona or a massive financial market crash like the one seen in 2008 could dismiss this whole cycle. Such possibilities would only increase if the bearish price action really accelerates to a point where there are no potentials for reversal.
Generally speaking, it will be highly important how Bitcoin reacts to the lower accumulation channel line of this gigantic uptrend channel. If there will be a stabilization and substantial bounce, the possibility of the repetition of the cycle almost increases above any bearish scenario. Also, the 9- and 21-MA are crucial signals here. If this cross down happens again, there is a likelihood that Bitcoin will continue with a cross up also. In any case, the upcoming short-term bearish trend dynamics are highly deterministic for any further price actions and cycle considerations.
Thank you very much for watching.

BITCOIN: Major Wyckoff Distribution Ongoing, Look for the Signs.Hello There,
the bitcoin price in the recent weeks has been very volatile, increasing crucial bearish price actions. Following these dynamics, I have spotted important signs that reveal in what state the bitcoin price currently is. These signs are important hints on where the price action is likely to move within the upcoming times. Also fundamentally, these dynamics are supported by major events and underlying market sentiments.
When analyzing the bitcoin dynamic, I am also looking at historical developments and how the price action moved. Therefore, a smart trader can spot these patterns over time and position oneself appropriately in the market. Connecting the dots to the current state of the market, I have spotted a crucial underlying pattern, which is called Wyckoff distribution. This type of pattern is an almost sure sign that the market is undergoing a trend-changing bearish reversal.
Considering the volatile price action here, bitcoin just dumped massively since testing the $123,000 level. From there on, massive bearish developments pushed the price below the $85,000 mark. This is also an important sentiment for the market. Because below the $100,000 price level is now a huge resistance. With round numbers always being massive resistance levels.
This crucial resistance of $100,000 was also confirmed since the Preliminary Supply (PSY) and Buying Climax (BC) the bitcoin price formed earlier. As this resistance was confirmed several times, there is a high likelihood that it will hold in the near future as well. With further inflection points such as the major descending resistance, the major upper resistance angle is formed.
As Wyckoff distributions move in several stages till a much more pronounced bearish move pushes the price far below established supports, bitcoin is already in the later stages of this distribution cycle. With rising short open interest, this will give fuel to unfold a main bearish price action towards lower levels. The Wyckoff distribution for Bitcoin consists of the following completed, ongoing, and upcoming parts/phases.
Phase A:
The bitcoin prior uptrend has stopped, which was a hint towards a reversal likely to happen.
Preliminary Supply (PSY): First evidence of supply entered the market with bitcoin short volume increasing.
Buying Climax (BC): An abnormal move into bullish spheres, which can’t go on forever, signals that the trend is likely to reverse.
Secondary Test (ST): This is very crucial for Bitcoin in this dynamic, as Bitcoin did not establish substantially higher highs; the price was rejected from the local levels. Marking the phase B in the distribution with clear signs of weak hands pushed out of the market.
Phase B
UT in Phase B: The upthrust above previous resistance levels marks a last try for Bitcoin to form significant higher highs. This did not happen, and Bitcoin pulled back again into the range. It is the most critical bearish sign here.
Phase C
In the next phase, C, several Last Points of Supply (LPSY) will be expected. We see a lot of bearish pressure in the market as whales throw their bitcoin into the market. Bearish volume increases. Short increases. All these bearish signs support the last points of supply. A final push below the support is determined by a Sign of Weakness (SOW), which shows that the market is likely to continue in the bearish direction.
In any case, the bearishness of this whole constellation should not be underestimated. As it is unlikely that this level holds and Bitcoin has the ability to continue to form new highs, a major bear market is likely to enter. Once the Wyckoff distribution pattern is completed, the bear market will unfold in its full determination.
Therefore, thank you very much for watching.

Bitcoin - Long idea1 target is $90,500.
2 target: $92,600
3 target: $94,000
4 target: $95,200
5 target: $96,000
Final target: $98,000.
After reaching the first target, I move the stop to break even.
BINANCE:BTCUSDT.P

This Bitcoin Pattern Usually Ends One Way₿ BTC/USD – Bearish Continuation After Breakdown
Bitcoin remains in a clear downtrend, trading inside a well-defined descending channel. The market structure continues to print lower highs and lower lows, confirming that sellers are still in control.
⸻
🔹 Descending Channel
• Price has been respecting the upper and lower bounds of the channel very cleanly.
• Multiple rejections from the channel top confirm strong overhead resistance.
• As long as BTC stays inside this channel, the trend bias remains bearish.
⸻
🔹 Triangle Consolidation
• BTC is now forming a triangle inside the downtrend, indicating consolidation, not reversal.
• This type of triangle is typically a bearish continuation pattern.
• A breakdown below the triangle support would likely trigger the next impulsive leg down.
⸻
🔹 Moving Averages
• Price is trading below the 50, 100, and 200 SMAs, reinforcing bearish pressure.
• The 200 SMA (~108.6K) remains far above price and acts as major resistance.
• Any bounce into these averages is likely to be sold into.
⸻
🔹 RSI Confirmation
• RSI is below 50, showing weak momentum and lack of bullish strength.
• No bullish divergence is present, supporting the continuation downside scenario.
⸻
🔹 Key Levels
• Resistance: 96K → 105K → 108K
• Support: 88K → 84K → 80K → low-70Ks (channel extension)
A confirmed breakdown could open the door toward the mid- to low-70K area.
⸻
🔹 Conclusion
This looks like bearish consolidation before continuation, not accumulation.
Until BTC breaks above the channel and key moving averages, the path of least resistance remains down.
⸻
🧠 “In a downtrend, consolidation is usually a pause — not a bottom.”
📜 Disclaimer : This is general information only and not financial advice.

Silent Waves Before the Surge The current BTCUSD structure shows the market completing a major impulsive wave, followed by a corrective phase that is still unfolding. The correction has taken the form of overlapping subwaves, suggesting consolidation rather than a sharp reversal.
Within this corrective movement, smaller waves are building a base that could serve as the foundation for the next impulsive leg. The pattern indicates that the market is preparing for renewed momentum once the corrective sequence is fully exhausted.
The overall wave count continues to favor a bullish continuation scenario, provided the corrective structure resolves in alignment with classical Elliott principles. Traders should watch for the transition from consolidation to impulse as the next defining move.

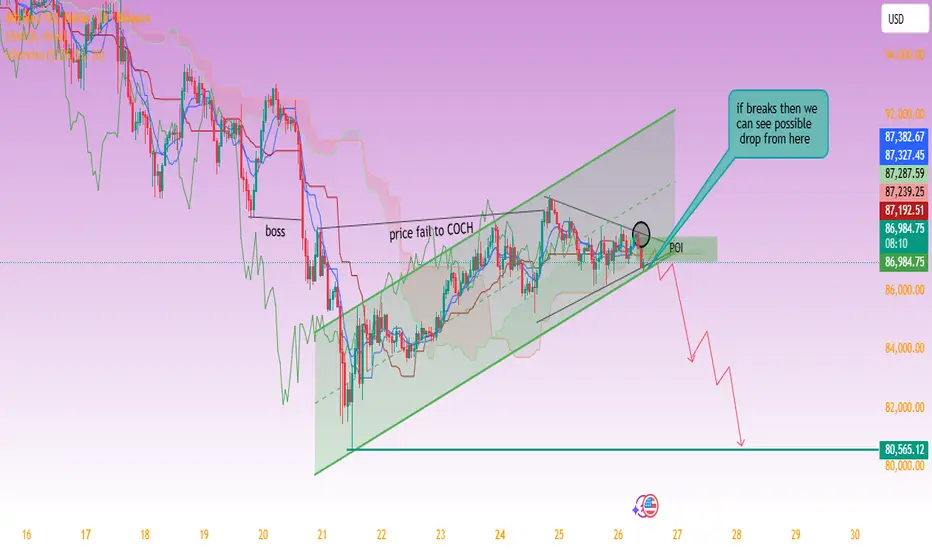
BTC Rising Channel Breakdown Setup – Bearish Continuation Possib1. Rising Channel (Bearish Structure)
Price has been climbing inside a rising wedge / ascending channel, which is typically a distribution pattern during a downtrend.
2. Price Failed to COCH (Change of Character)
You labeled “price fail to COCH” — this means buyers failed to flip the trend into bullish structure.
This is bearish confirmation.
3. BOS (Break of Structure) earlier
There was a clear BOS on the left side — confirming macro bearish flow.
4. Compression into the Channel
Price is moving slowly upward with weak momentum, forming a squeezing structure.
5. POI (Point of Interest) at the bottom trendline
You marked a zone under the trendline.
A break into this zone is where momentum shifts from bullish to bearish.
6. If Trendline Breaks → Expect a Drop
Your chart shows an arrow downwards toward 80,565 as the main downside target.
This aligns well with:
Trendline support
Ichimoku cloud weakness
Rising channel breakdown pattern
Prior liquidity levels
📉 TRADE PLAN (Bearish Setup)
This plan follows the logic of the chart you provided.
🔻 Trade Type: Short Position (Sell)
Because price is at the end of a rising wedge and showing weakness.
✨ ENTRY (Sell Entry):
86,750 – 86,600
After a confirmed break and candle close below the ascending trendline + POI.
✔ Wait for a clean break and retest of the POI/trendline.
🛑 STOP LOSS:
87,350 – 87,450
Place the stop above:
The small circle you highlighted
Last minor swing high
Ichimoku resistance
This keeps maximum SL tight and structure-based.
Risk: ~600–800 points
🎯 TAKE PROFIT (Exit Levels):
TP1 – Safe Target (Liquidity Grab)
84,800 – 85,000
TP2 – Mid Target (Channel Origin)
82,500 – 83,000
TP3 – Main Target (Your Chart Target)
80,565 – 80,000
This matches your projected drop.
📐 Risk–Reward Ratio (Approx):
If using:
Entry = 86,650
SL = 87,400
TP3 = 80,565
➡ RR ≈ 1 : 8+ (excellent)
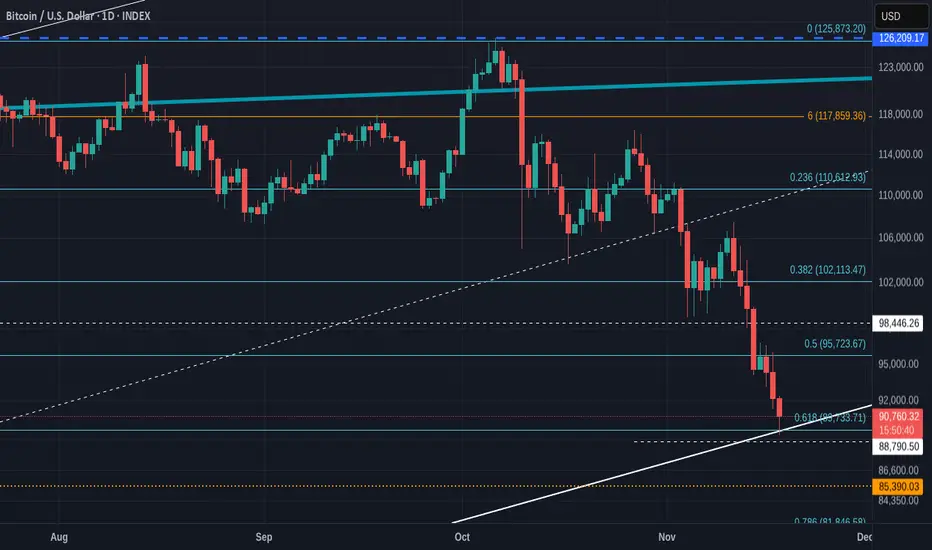
Quick Bitcoin Update - DAILY
I think we could see a bounce today, off th eLong Term line of support that is also the 618 Fib retracement level
We will have to wait and see if that Holds longer Term or not.
Today is a BIG day
We do NOT want to go and stay below this long term line of support...It has never been Broken since 2011
HANG ON BULLS
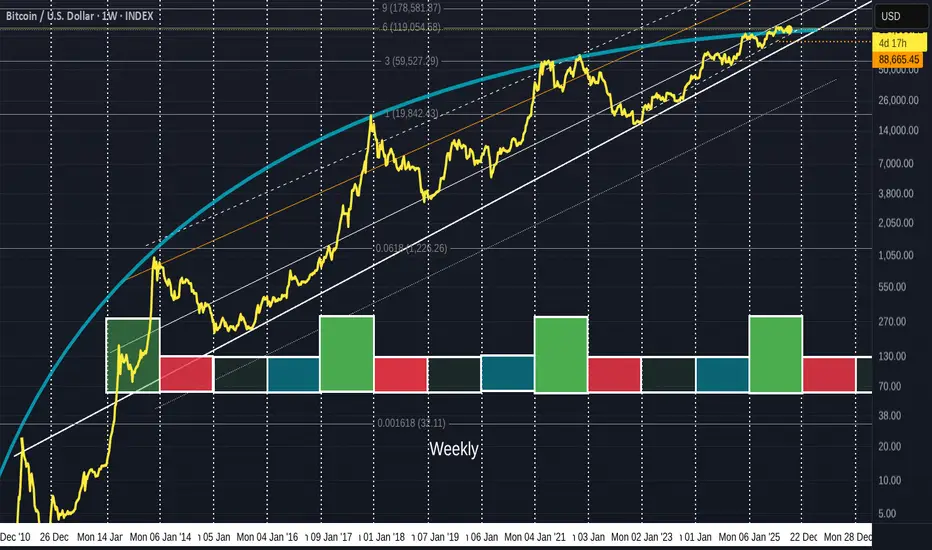
Is BITCOIN in a DIP OF DOOM or Are the Bears having Fun ?
This is a Crunch time for Bitcoin and Many people Are running scared.
Me, I am sitting tight, NOT selling.
In Fact, I am BUYING
Why ?
Because we are Still in Channel and Above a long Term line of support.
Lets have a Look.
There are two major lines we need to pay attention to...The BLUE ARC that has rejected Every Bitcoin ATH since the beginning and the Line of support that was created in 2011.
And the problem we have right now, is that PA is getting Squeezed between the Two.
PA MUST React.
You can see how tight it is getting and PA is nearly on the lower trendline.
Lets look closer
Same chart as a Weekly chart
See how that Blue Arc has rejected PA and how the White long term support has supported PA>
And it is THIS image of this chart that Give me Hope.
A number of things to note here.
Most importantly is that the Bulls DID break over that Blue Arc once. This shows intent to do so. That was the First time that line of resistance has ever been broken.
And PA was Overbought when it did so and so we did not have the strength to remain above.
PA has retreated and as a consequence, PA is now Oversold.....and with in striking distance.
PA has the strength to attack that Blue Arc again and WIN
PA is currently on the 0.5 Fib Retracement
Should this support fail, we will Visit 89700 on the 0.618 retrancement. But that will only happen if we fall through a line of Support that HAS NEVER BEEN CROSSED
For Me, I remain VERY BULLISH
This is a Dip of Doom and has scared people but we are near the end....So long as we remain above that line of support, I remain positive.
As I mentioned at the beginning of the month, I am expecting this month to close RED but then we Rise....Have a look at the Month Candle Colout chart post.....all will be explained.
Stay safe

Technical analysis of bitcoin key levels and wedge chart pattern1. Trend Structure
The descending trendline (Resistance line) at the top of the chart remains valid.
The price has repeatedly faced rejection at this level, indicating that the medium-term downtrend is still intact.
2. Key Price Levels and Indicators
50-week EMA
The price has recently recorded its third downward break below the 50-week EMA.
From a traditional technical perspective, this is viewed as a signal that strengthens the possibility of a medium- to long-term bearish shift.
POC (Point of Control)
The mid-range POC is acting as a strong supply zone,
and recent rebound attempts have also failed to break above this level decisively.
3. Liquidity Zones
Two major liquidity zones are marked in the upper and mid sections of the chart.
Liquidity zone near 112k (upper zone)
A cluster of large liquidity pockets and liquidation points
If a short-term rebound occurs, this is the first upside target likely to be tested
Liquidity zone near 102k (mid zone)
Overlaps with the 4h FVG, making it a level closely watched by both buyers and sellers
4. FVG (Fair Value Gap)
Multiple FVGs are present on the 4-hour timeframe, with some already filled.
Unfilled FVGs have a high probability of being revisited as the market corrects in the future.
5. CME Gap
All weekday CME gaps have already been filled and may act as short-term resistance.
A weekend gap forms when Monday’s CME opening price starts above 95.4K.
6. Current Market Structure Interpretation
The price is currently attempting a rebound from the lower boundary of the downtrend.
However, several resistance layers overlap—POC, FVG zones, and trendline resistance—raising the likelihood of heavy selling pressure on any upward move.
In the short term, volatility consolidation is expected within the 96k–100k range.
7. Potential Formation of a Lower Wedge Pattern
The price has broken below the lower boundary of the wedge pattern, accompanied by rising volume.
A short-term rebound is likely, and if the price re-enters the wedge, further upside momentum may follow.
If the lower trendline is not reclaimed, the structure may shift into a range after a retest.
8. USDT.D Chart Analysis
The price has once again touched the upper boundary of a downtrend line that has persisted for over a year.
Downward pressure on the USDT dominance chart suggests potential upward momentum for Bitcoin.
Technically, this zone offers conditions supportive of a short-term rebound.
9. Summary
The medium-term trend remains bearish, with the ongoing breakdown below the 50-week EMA reinforcing a sustained bearish outlook.
A short-term bottoming attempt is visible, but dense supply overhead limits the strength of any rebound.
FVGs, POC, and liquidity zones overlap near the current price region, increasing the probability of heightened volatility.
If you found this content helpful, feel free to support with a boost (🚀) and a comment (💬).
Your encouragement helps drive better analysis and more valuable content.
Follow the page to receive notifications (🔔) for future posts.

BitcoinBTCUSD
- Completed " 1234 " Impulsive Waves
- Break of Structure
- RSI - Divergence
- Bullish Channel as an corrective pattern in Short Time Frame
- Demand Zone

BTC/USDT: Symmetrical Breakout and Channel ContinuationHi guys!
Bitcoin has successfully broken out of a symmetrical triangle, confirming a bullish continuation pattern after several days of consolidation. The breakout was followed by a clean retest of the triangle’s upper boundary, which now acts as support.
Currently, the price is moving inside a rising parallel channel, showing a healthy bullish structure with higher highs and higher lows. As long as BTC maintains above the midline of this channel, the short-term trend remains upward.
In the coming sessions, price may continue oscillating within this ascending channel, forming a series of higher lows before reaching the next key resistance around $118,682 , and potentially extending toward the triangle’s measured target at $122,56 7.
On the downside, a confirmed close below the channel’s lower line would be the first sign of weakening momentum and could lead to a deeper pullback toward $112,000–$113,000.
Important levels:
Support: $114,000 / $112,500
Resistance: $118,682 / $122,567
Trend: Bullish above $114,000

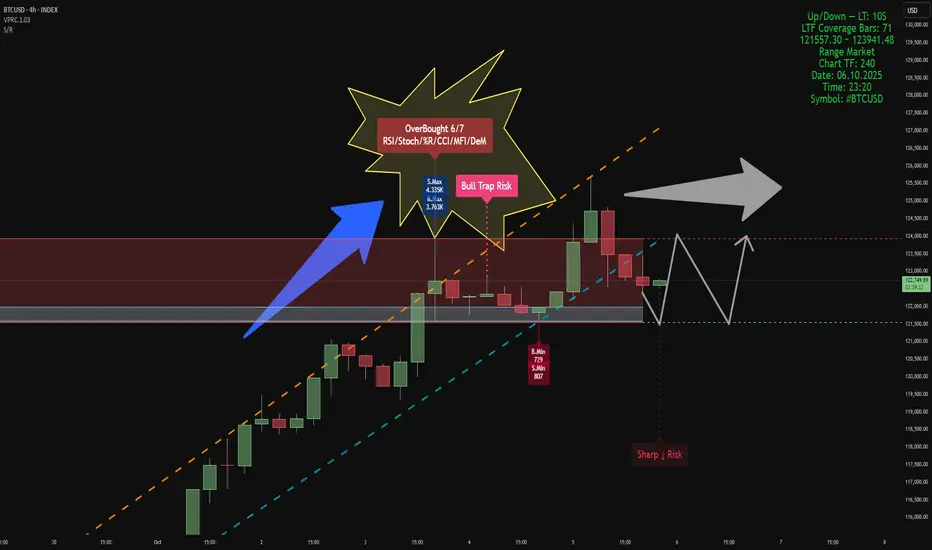
BTCUSD – 4H Volume-Structure Analysis
Indicators
Smart Money Support/Resistance (Lite) & ATAI Volume Analysis with Price Action V1.03
Analytical Setup
• LTF: 10 seconds
• LTF Coverage Bars: 70
• Global Volume Period: 52
• Market Type: Range
• Active Zones:
- Support Zone: 121,557 – 123,941 USD (current active range shown in panel)
The analysis timeframe ensures valid volume coverage, as the period (52) is smaller than total LTF bars (70).
Resistance Area & Bull Trap Risk
In the upper range (≈123,900 USD), a Bull Trap Risk has formed immediately after an OverBought 6/7 condition — confirmed by RSI, Stoch, %R, CCI, MFI, and DeM modules in ATAI. At this point, both buy and sell volumes peaked within the 52-bar window, with S.Max = 4.33K and B.Max = 3.76K. This slight dominance by sellers indicates demand absorption at the top of the structure. The setup matches ATAI’s trap logic — high wick, overbought context, and volume imbalance — signaling potential exhaustion near resistance.
Support Area
Support is currently anchored near 121,550 USD, derived from B.Min and S.Min lows (B.Min = 7.29, S.Min = 807). This aligns with the lower projection from Smart Money S/R, marking the point where cumulative delta begins to compress. Historically, compression at minimum-volume zones often precedes short-term accumulation or range stabilization.
Structural Behavior
The chart shows a defined upward channel (orange and cyan dashed lines). After testing the upper boundary, price entered the resistance zone and generated a Bull Trap Risk followed by moderate rejection. Below, the Sharp ↓ Risk tag signals potential for a short liquidity sweep before stabilization. Volume readings still support range continuation rather than a confirmed reversal, consistent with the Range Market tag.
Probable Scenario
1. A short pullback toward the lower boundary of support (~121.5K) is expected.
2. If support holds and volume compression persists, a rebound toward 123.9K (resistance ceiling) is probable.
3. A breakdown below 121.5K could trigger a deeper correction toward the next S/R projection near 120K.
This represents a neutral-to-bullish range bias: short-term weakness, but constructive above support.
Summary
• OverBought 6/7 + Bull Trap Risk detected at resistance (≈123.9K).
• Support around 121.5K built from B.Min and S.Min.
• Sellers slightly dominant at the trap peak.
• Likely scenario: retest of support, then rebound toward resistance if volume confirms.
• Bias: range continuation until breakout beyond 123.9K or breakdown below 121.5K.
Why is Bitcoin under a LOT of pressure to move higher right now
That Blue line is a calculated Arc, that is, in fact, a part of a Fibonacci Spiral.
As you can see, it has rejected EVERY Bitcoin ATH - Every one.
And right now, PA is getting Squeezed by it and the line of long term support just below.
We have till year end to break and hold above this Blue Arc.
Here is a Zoomed version of the same chart.
PA is currently Just above that Line,,but only just.
It has been rejected a number of times since Q4 2024.
We need to break above and hold.
It is as simple as that, otherwise, PA will be dragged down.
As you probably realise, This is the end of this Series of Bitcoin cycles.
Once above the Spiral, we leave a series of patterns Bitcoin has been in since it was created in 2008
Exciting days ahead
Btc looks bearish Bitcoin bears were successful in forming a new lower high during this small time frame down trend. If we do not close above 110k bitcoin will remain bearish.
Next support :- 105k and 100k

#Bitcoin Bearish Sunday Update: $BTC short taken from 116K,#Bitcoin Bearish Sunday Update:
CRYPTOCAP:BTC short taken from 116K, and now BTC is already trading near 108K. I’m still holding my short position.
First target is 100K, then looking for 95K → 90K.
🔸 Market View:
No matter if BTC pushes into 112K–115K, the structure remains bearish. The CPI data outlook is also bearish for markets, adding more pressure. September will be brutal. Everyone is talking about the CPI data being very bearish, but I believe this is just a sell-the-news event. Be careful — I already told you the market is ready to dump.
🔸 Outlook:
I continue to hold my short from 116K and will update as targets get hit. The bigger picture stays bearish until we see real capitulation in the lower zones.

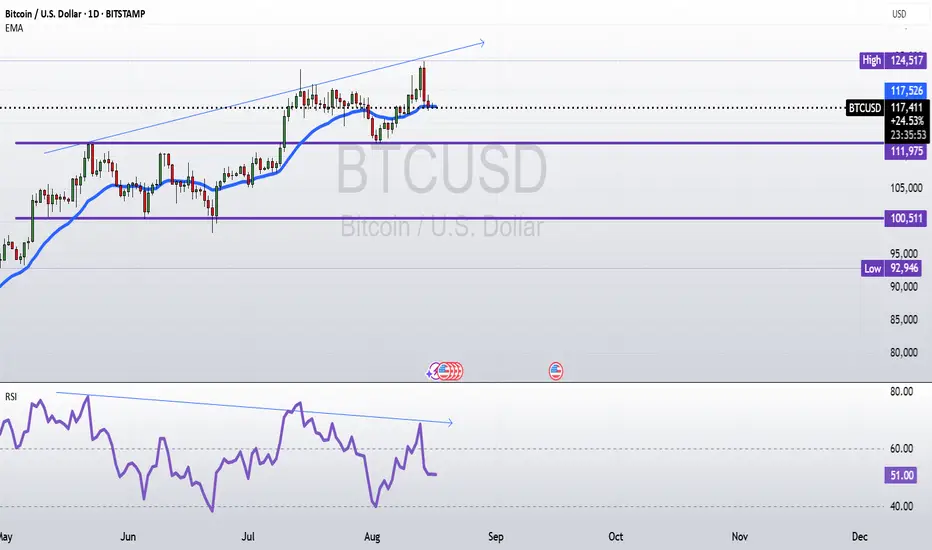
Bearish divergence analysis(short position).On the chart, you can see that price is making higher highs, but at the same time, the RSI is making lower highs.
This mismatch means that while price looks strong, the momentum behind the move is fading.
As a result, the current uptrend may not be sustainable, and there’s a possibility of a trend reversal or a correction in the near future with respect to EMA20.
Disclaimer:
I am NOT a SEBI registered advisor nor a financial advisor.
Any investments or trades I discuss on my blog are intended solely for educational purposes and do not represent specific financial, trading, or investment advice.
Disclosure:
I, the author of this report, and my immediate family members do not have any financial interest or beneficial ownership in the securities mentioned herein at the time of publication.