Bitcoin (BTC/USDT) – Monthly OutlookThe new 12-month candle has just opened with Bitcoin holding firmly above prior macro structure. Price is consolidating just below the previous All-Time High, showing acceptance at premium levels rather than rejection.
Monthly market structure remains bullish, with higher highs and strong candle bodies signaling continued demand. The lack of deep pullbacks suggests sellers are being absorbed, increasing the probability of a clean ATH breakout and continuation into price discovery.
As long as price holds above the yearly opening range, the bias remains bullish.
Bias: Bullish
Expectation: ATH break
Invalidation: Monthly close back below prior structure
Bitcoinupdate

BTCUSD 1W - My Thoughts Going into Dec 1 2025 Week BTC heads into the first week of December in a clear corrective phase, with price likely to remain choppy as it digests the recent downside move. The mid-80k zone is acting as an interim equilibrium, but the broader structure still favors a deeper liquidity sweep toward the 70k-73k support band before any meaningful trend re-acceleration.
Volatility should remain elevated, and the market is positioned to shake out weak hands during this chop. Structurally, pullbacks into key supports continue to define the higher timeframe trend, while sellers are losing momentum on each leg lower.

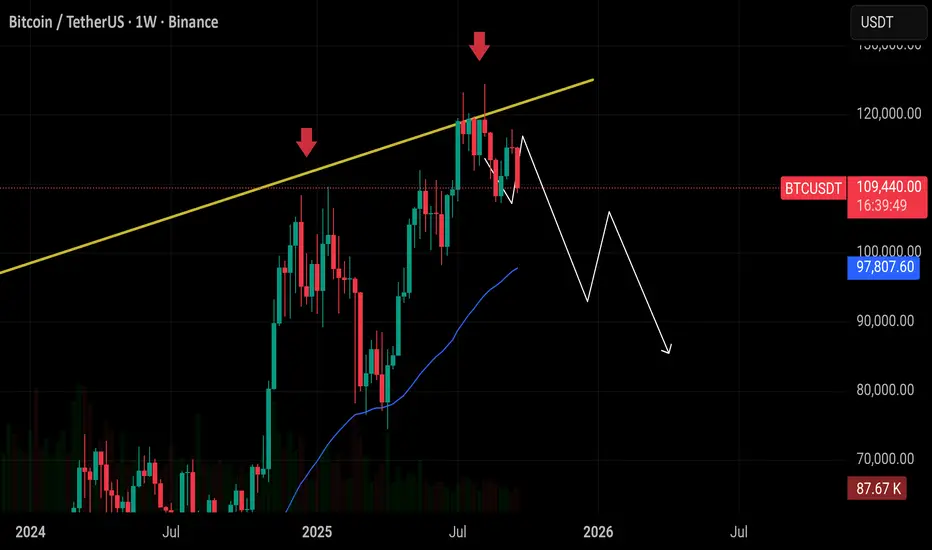
Bitcoin: The Downtrend Begins Just as the title suggests, this is where Bitcoin is poised to fall once more.

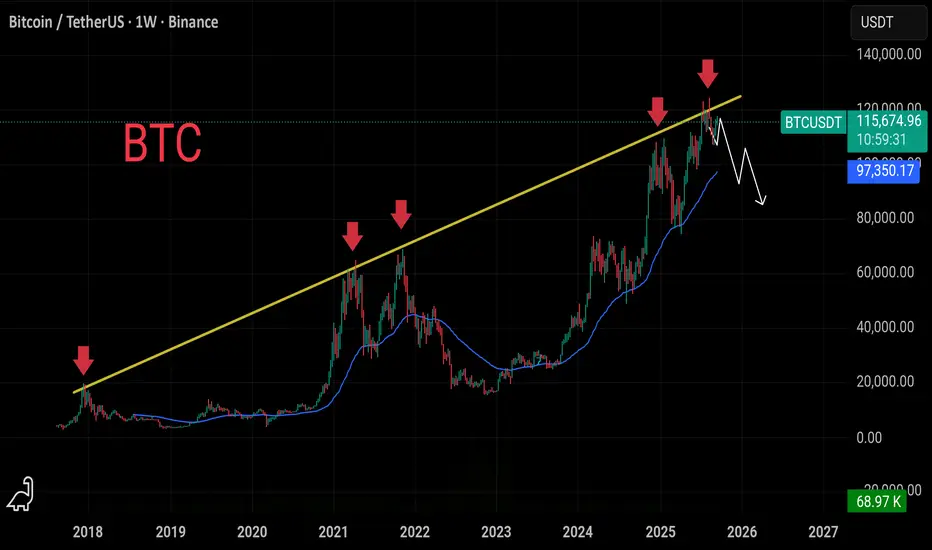
Bitcoin Market Analysis: Correction or Downtrend?Bitcoin: Correction Wave or Beginning of a Downtrend?
Overview of Recent Bitcoin Trends
At the end of the second week of March 2023, a clear confirmation of an uptrend emerged in the Bitcoin chart. Since then, Bitcoin has experienced a series of corrections, each time reaching historical price levels. This consistent pattern has led to ongoing speculation about when a genuine downtrend might begin.
Current Market Outlook
Presently, from a long-term perspective, Bitcoin appears to be undergoing another correction wave. This wave closely resembles the previous correction that concluded in the second week of April 2025, though the current correction is notably more aggressive.
Short-Term vs. Long-Term Strategies
For short-term traders, there are indications that the recent uptrend may be reversing. A clear signal for a potential short-term downtrend has emerged after Bitcoin broke below the price point of $106,710.00. Traders are closely monitoring whether prices will continue to decline, which could result in significant losses for many who are already experiencing substantial daily losses. Alternatively, there remains the possibility that this correction is temporary, and a new uptrend could push prices to new highs in the coming months.
Critical Price Levels to Watch
•Long-Term Traders: A decisive break below $75,000 is a critical level in the current correction wave.
•Short-Term Traders: The ongoing downtrend is expected to end if prices climb to $106,500 or higher.
However, it is important to consider the risk-to-return ratio before taking any position. Assessing the potential risk and potential reward is crucial in making informed trading decisions.
It's worth noting that the analysis provided is based on the information given and assumes the accuracy of the mentioned technical indicators. However, market conditions can change rapidly, and it's always important to conduct comprehensive and up-to-date analysis before making any investment decisions.

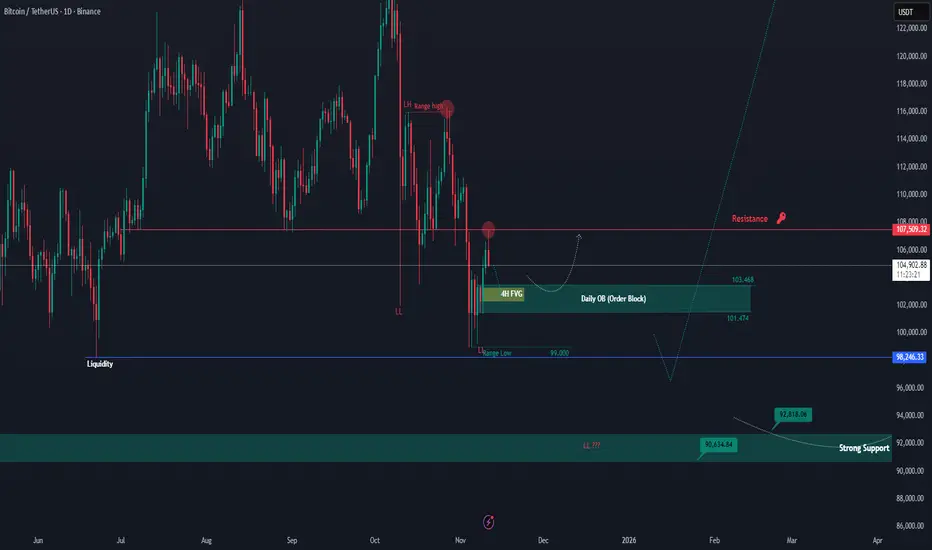
BTCUSDT – Retesting Key Levels After Resistance RejectionAs expected, BTC successfully closed above the $100K mark on the daily timeframe and moved up to retest the major resistance zone around $107,500. However, the price faced a clear rejection from this level, confirming that it remains a strong resistance area which Bitcoin must break to resume its upward momentum toward $110K–$112K.
Currently, BTC is showing signs of a potential pullback toward the Daily Order Block (OB) area near $103K–$101K. This zone will be crucial to watch — if the price reacts positively and rebounds, it could signal another push to retest the $107K resistance. On the other hand, a breakdown below this OB may open the door for a deeper retracement toward the $100K zone or even lower, possibly targeting the liquidity around $98K.
For now, BTC remains in a short-term corrective phase within a larger bullish structure. The reaction from the Daily OB zone will likely determine the next major move.
BitcoinBTCUSD
- Completed " 1234 " Impulsive Waves
- Break of Structure
- RSI - Divergence
- Bullish Channel as an corrective pattern in Short Time Frame
- Demand Zone

Bitcoin BTC price analysis after crash📈 OKX:BTCUSDT held above the key psychological level of $100,000, remaining within the long-term uptrend 💪
💀 Altcoins suffered heavy losses — liquidity vanished across the board.
This highlights the importance of balance:
🔸 20% in low-cap alts
🔸 80% in resilient assets
💰 The official $19–20B liquidation figure seems understated —
data suggests the cascade started on CEX platforms after algorithmic issues and liquidity gaps.
📊 Fear & Greed Index: 38 — still fear, volatility ahead ⚠️
🇺🇸 The U.S. market open could set the tone for the week 🎢
💭 Do you expect CRYPTOCAP:BTC to retest lower levels before the next leg up?
______________
◆ Follow us ❤️ for daily crypto insights & updates!
🚀 Don’t miss out on important market moves
🧠 DYOR | This is not financial advice, just thinking out loud

#BITCOIN SUNDAY ANALYSIS $BTC I’ve been warning you for almost #BITCOIN SUNDAY ANALYSIS
CRYPTOCAP:BTC I’ve been warning you for almost 50 days, and now everything is unfolding exactly as expected.
Bitcoin is currently trading around 112K, showing a short-term bounce after the recent heavy dump.
I still expect a small bounce toward 114K to 115.5K, but that move should only be a relief rally before the next leg down begins.
If Bitcoin trades above 110K, a bounce to 114K to 115K is possible.
However, if it drops and sustains below 110K, then the lower targets will come into play at 105K, 100K, 95K, and 90K.
As mentioned many times before, 115K to 125K remains a strong short zone.
Our first target at 105K has already been perfectly hit ✅.
The overall market structure remains bearish, and until we see a weekly close above 125K, the risk of a deeper correction stays high.
I’m still holding my 50% short position.
If anything changes or I close my position, I’ll update you.
As I’ve said before, if BTC moves back to 125K to 128K, I’ll add more shorts. That plan hasn’t changed.

Bitcoin Bullish Confirmation Above $119500 | Watch November MoveBitcoin is currently trading below a key resistance level of **$114,500**, and a **strong Monday closing on 13 October above this level** is crucial for confirming a short-term bullish recovery.
If BTC successfully closes above **$114,500**, the next important resistance will be around **$119,500**.
A **Monday closing on 20 October above $119,500** would confirm a temporary bullish structure, giving Bitcoin the strength to test higher levels toward the **$127,600 liquidity zone** in November.
Currently, major liquidity is sitting near **$124,600 and $127,600**, which might attract price movement before any major reversal begins.
The market has already taken liquidity around **$101,000**, trapping retail sellers — and now, it may move up to grab the **short-side liquidity** before the next larger downtrend begins.
⚠️ **Be patient and stay disciplined. Avoid long positions for now.**
Focus on the market’s move toward the top, and prepare for **short positions near the highs** to capture the **2026 bear market** — which is expected to last from **September to November 2026**.
📊 The market often manipulates both sides before showing the real direction. Watch levels carefully and trade with confirmation.
💬 **Follow me on TradingView** for more Bitcoin and Ethereum updates — and comment below which coin you’d like me to analyze next!

Continuously making HH HLBTC Analysis
CMP 112510.14 (12-10-2025 02:58AM PST)
Continuously making HH HL & is Still Bullish in the
longer run.
as shared on 02-06-2025, Cup & Handle Target hit
around 115000 - 120000 & then dropped.
3 Important Support levels are :
S1 around 108000 - 108450
S2 around 95000 - 95200
S3 around 86000 - 86500
S2 seems to be a Stronger Support as this range is
also around Channel Bottom.
Upside Targets seems to be around 132000 - 132300
initially.
BTC seem safe as long as it stays above 74000; if it
breaks this level, we may witness trend reversal.

$BTC Sunday Update Bitcoin dumped over 8K, exactly as I warned CRYPTOCAP:BTC Sunday Update
Bitcoin dumped over 8K, exactly as I warned many times at 115K. This is now the 2nd time price has rejected and fallen below 110K. I’m still holding shorts, and if we push back to 115K again, I’ll add more. My downside targets haven’t changed: 105K, 100K, 95K, 90K or below. Altcoin pumps are only traps before the bigger drop.
$BTC Sunday Update Nothing has changed, structure still intactCRYPTOCAP:BTC Sunday Update
Nothing has changed, structure still intact I’m still holding my short, staying patient for the lower targets ahead. If BTC makes a push into 120, 125K, that’s where I’ll load more. My downside map stays the same: 105K → 100K → 95K → 90K. Altcoin pumps look like nothing more than liquidity traps set by market makers before the real drop unfolds.
MSFT 1D Time frameMarket Snapshot
Current Price: ~$498.41
Daily Change: +0.23 (≈0.05%)
Market Cap: ~$2.79 Trillion
P/E Ratio: ~28.9
EPS: ~12.93
🔎 Technical Indicators
RSI (14-day): ~41 → Neutral, leaning slightly bearish.
MACD: –2.7 → Negative but giving a weak buy crossover signal.
Williams %R (14-day): ~–74 → Suggests a possible rebound (buy).
CCI (14-day): ~–108 → Oversold zone, buy indication.
ADX (14-day): ~20.6 → Weak trend strength.
ROC (Rate of Change): –3.5 → Mild bearish momentum.
📈 Moving Averages
5-day MA: Below current price → Bearish short-term.
20-day MA: Below current price → Bearish.
50-day MA: ~$509, above price → Acting as resistance.
100-day MA: ~$476, below price → Supportive.
200-day MA: ~$443, below price → Long-term uptrend still intact.
🔧 Support & Resistance
Support Zone: ~$491 – $497
Resistance Zone: ~$500 – $510
📅 Outlook
Bullish Case: If MSFT climbs above $509–510, momentum could extend toward new highs.
Bearish Case: A break below $491 may lead to a pullback toward $480–485.
Overall Bias: Neutral to slightly bearish in the short term, but long-term bullish trend remains intact above the 200-day MA.

Btc looks bearish Bitcoin bears were successful in forming a new lower high during this small time frame down trend. If we do not close above 110k bitcoin will remain bearish.
Next support :- 105k and 100k

BTC/USD: $100K Shakeout or New All-Time High Incoming?Bitcoin has been trading in a strong bullish cycle, recently touching highs above $124,000, driven by institutional inflows, favorable macro sentiment, and expectations of Federal Reserve rate cuts. However, the market is now showing early signs of exhaustion, with prices struggling to maintain momentum above the $118,000–$120,000 resistance zone.
From a technical perspective, the 50-day moving average currently sits near $107,000, acting as the first major support level. A decisive break below it could open the door to a deeper retracement toward the psychological $100,000 level, which also aligns with a key historical demand zone.
The RSI on the daily chart is entering overbought territory, suggesting that a short-term pullback may be healthy for the market. Meanwhile, MACD momentum is flattening, indicating that bulls may be losing steam after an aggressive rally.
Fundamentally, Bitcoin remains in a strong long-term uptrend, but short-term risks cannot be ignored. Regulatory headlines, macroeconomic shocks, or a failure to hold technical support could accelerate a correction. Many analysts, including Arthur Hayes, have mentioned the possibility of a drop to $100K, not as a collapse but as a potential accumulation phase before another leg higher.
Key Levels to Watch:
*Support: $107,000 – $100,000
*Resistance: $120,000 – $124,500
*Breakout Target: Above $125,000 could trigger a run toward $135,000+
*Breakdown Target: Below $100,000 could extend to $95,000
While the macro trend remains bullish, a short-term dip toward $100K is a realistic scenario if momentum continues to fade. Long-term holders may see such a move as an opportunity, while short-term traders should watch for a confirmed break of $107K to position accordingly.

Very quick and simple BITCOIN DAILY UPDATEPA is approaching TOP OF RANGE again
It it get rejected, it is another LOWER HIGH that may lead to another LOWER LOW
If we break through, we may watch a higher high but we need to see if we get a Higher Low afterwards to confirm change of Trend
The Falling channel has a number of boundaries.
PA has the ability to move higher.
This appears to be a Bullish move for now.
So we need to wait till month end.
Again, I am hoping for a small RED candle for the month
A small Green candle could lead to many options that would be Fragile and unfounded

Bitcoin extended cycle, $120,000-$140,000 next july-augustBitcoin looks like its gonna be a good summer imo, too much people say it will a boring summer and we top in oktober-dec but what if we top in august and drop 50%, and sep-dec will be correction month, and we continue the bullrun end 2025 till q1 2026 and we print a top in q1 2026,

NZDJPY BULLISH OR BEARISH DETAILED ANALYSISNZDJPY has just completed a clean breakout from its descending channel, and we are now setting up for a potential bullish continuation. The breakout above the channel resistance confirms a reversal of the prior downtrend, signaling fresh bullish momentum in play. Price is currently hovering around 85.90, and I’m targeting a move toward 91.90 in the coming weeks as market structure shifts in favor of buyers.
Fundamentally, the New Zealand dollar is gaining strength following the RBNZ's recent hawkish stance. Despite global rate cut expectations, the RBNZ has held firm, emphasizing inflation remains elevated and may require prolonged tight policy. This divergence from other central banks, particularly the BoJ, gives NZD an upper hand. On the flip side, the Japanese yen continues to show weakness due to the BoJ's ultra-loose monetary stance, and there's still no concrete signal of a shift toward tightening. Yield differentials remain wide, fueling carry trades in favor of NZD.
Technically, the breakout is supported by strong bullish candles and increasing volume. The breakout level around 85.60 is now acting as fresh support, and as long as we hold above that zone, the bullish bias remains valid. The structure suggests momentum is building toward 88.50 as the next minor resistance, and a break above that could accelerate the rally to our full target at 91.90.
From a risk-reward perspective, this setup remains favorable. I'm closely monitoring bullish continuation patterns on lower timeframes to scale in. NZDJPY appears primed for a potential upside surge, supported by both fundamentals and technicals, and I’m looking to ride this trend as long as the current momentum holds.

Bitcoin Parabolic Curve - 2022 to 2026 Market CycleThis line chart shows the current Bitcoin market cycle from the bear market bottom in November 2022. As you can see, the price has formed a parabolic curve, which was violated around the beginning of March. A couple of weeks later, there was a retest of the curve, which was rejected. The price of BTC has since returned to the bottom side of the curve and is following it upwards.
I am also watching the Bitcoin monthly chart and, more specifically, the monthly Stochastic RSI indicator. As you can see in the chart below, between the second and third months after the market cycle peak, the Stochastic RSI indicator has always dropped below the "20" level, and was near zero at the close of the third month.
There was some speculation that the new all-time high set on January 20th at just over $109k was the peak for this market cycle. At the beginning of April, the Stochastic RSI dropped well below the 20 level but rebounded and was at 16.81 when the April candle closed. One week into May, the Stochastic RSI has pushed back above the 20 level and currently sits at 26.38.
I am still keeping an open mind, but if the high set on January 20th were the market cycle peak, based on past history, I would have expected the Stochastic RSI to have been much lower at the close of April. If the May candle closes with the Stochastic RSI above the 20 level, it will give me much more confidence that Bitcoin has not peaked for this market cycle.
My assumption for now is that Bitcoin is still following a 4-year market cycle. If this is true, I would expect a market cycle peak sometime in the final months of this year. Either way, it has been a very interesting market cycle with huge changes for the crypto asset class.

EURAUD DETAILED ANALYSIS BULLISH OR BEARISHEURAUD is currently trading around 1.75600, forming a classic falling wedge pattern on the 12-hour timeframe. This structure typically signals a bullish reversal, and with price compressing near the wedge’s apex, the likelihood of a breakout to the upside increases significantly. Momentum is slowing on the downside, while buyers are beginning to show signs of re-entering the market, suggesting the pair is gearing up for a potential bullish surge toward the 1.85600 level.
Fundamentally, the euro is holding firm amid persistent inflation data from the eurozone, increasing speculation that the ECB might remain hawkish longer than expected. On the other hand, the Australian dollar is facing pressure due to softer commodity demand and cautious rhetoric from the RBA. This divergence in central bank outlooks favors euro strength in the near term. Today's minor beat on euro PMI data and lackluster performance in Aussie retail sales reinforces the strength of this directional bias.
Technically, this falling wedge is forming after a strong bullish impulsive leg, which adds further credibility to the reversal setup. Buyers have successfully defended the 1.7500 psychological zone, and a breakout above the wedge resistance could trigger a sharp rally. A move above 1.7600 would likely act as confirmation for bulls, opening the door for a measured move toward the 1.85600 target area.
As long as price holds above the 1.7400 region, this remains a high-probability bullish setup with a strong risk-reward profile. Traders will be closely watching for volume increase and price rejection candles at resistance to confirm the breakout. This is a prime example of a technical and fundamental confluence setup that professional traders look for when positioning for medium-term swing trades.

BTCUSDT forming a Bullish Flag patternBitcoin (BTCUSDT) is currently forming a classic bullish flag pattern on the daily chart, often regarded as a strong continuation setup in technical analysis. The breakout from the prior descending wedge has already provided strong bullish momentum, and now BTC is consolidating just below key resistance, signaling the next possible leg upward. With volume steadily increasing during this consolidation phase, this flag pattern holds significant potential for a breakout rally.
The price structure reflects healthy accumulation, where smart money seems to be stepping in before the anticipated surge. The flagpole leading up to the pattern shows strong bullish dominance, and the sideways flag structure suggests that Bitcoin is merely taking a breather before pushing higher. A confirmed breakout from the flag could target an upside of 20% to 30%+, aligning with the projected price move shown on the chart.
Fundamentally, Bitcoin continues to gain mainstream traction, and the broader crypto sentiment is turning positive again. The volume patterns and technical indicators reinforce the bullish outlook. Investors are showing renewed interest, especially as BTC holds above key psychological and structural levels, which adds confidence to the continuation narrative.
This setup is ideal for breakout traders and investors looking to capitalize on short to mid-term gains. If the bullish flag plays out as expected, BTC could make another significant move toward its all-time high zone.
✅ Show your support by hitting the like button and
✅ Leaving a comment below! (What is You opinion about this Coin)
Your feedback and engagement keep me inspired to share more insightful market analysis with you!

The Big drop is coming This is just my idea I'm hoping Bitcoin will fall to 72000 if it does I'm thinking it going to keep dropping to 70000. This would be great if your in a sell now might take a day or 2 to get there but I'll wait if the monoooy is right lol. COINBASE:BTCUSD

AUDNZD Ascending Triangle Bullish Breakout Targeting 1.1340The AUDNZD currency pair is currently trading at 1.1140, with a target price of 1.1340, suggesting a potential upward move of 100+ pips. The pair is forming an ascending triangle pattern, a classic bullish continuation pattern. This pattern typically forms when the price consistently makes higher lows while encountering a horizontal resistance level, signaling a potential breakout above the resistance. Traders are looking for a confirmation of the breakout above the resistance level to target 1.1340.
From a technical perspective, the ascending triangle is often a sign of market indecision, but it’s typically followed by a breakout to the upside when the price pushes through the resistance at the top of the triangle. In this case, the breakout would likely target the 1.1340 level, where the next significant resistance could come into play.
On the fundamental side, the Australian dollar has been relatively stronger recently due to robust commodity exports, particularly iron ore and coal. In contrast, the New Zealand dollar faces pressure from a more dovish outlook from the Reserve Bank of New Zealand, which has recently taken a cautious approach to monetary policy. These economic dynamics could support the bullish case for AUDNZD, especially if the breakout occurs in favor of the Aussie dollar.
In summary, the ascending triangle pattern on AUDNZD points toward a bullish breakout above the 1.1160 resistance. If confirmed, the pair could target the 1.1340 level. Keep an eye on any upcoming economic data from both Australia and New Zealand, as these could provide further confirmation or invalidate the breakout.
