Bitcoin BTC price analysis after crash📈 OKX:BTCUSDT held above the key psychological level of $100,000, remaining within the long-term uptrend 💪
💀 Altcoins suffered heavy losses — liquidity vanished across the board.
This highlights the importance of balance:
🔸 20% in low-cap alts
🔸 80% in resilient assets
💰 The official $19–20B liquidation figure seems understated —
data suggests the cascade started on CEX platforms after algorithmic issues and liquidity gaps.
📊 Fear & Greed Index: 38 — still fear, volatility ahead ⚠️
🇺🇸 The U.S. market open could set the tone for the week 🎢
💭 Do you expect CRYPTOCAP:BTC to retest lower levels before the next leg up?
______________
◆ Follow us ❤️ for daily crypto insights & updates!
🚀 Don’t miss out on important market moves
🧠 DYOR | This is not financial advice, just thinking out loud
Bitcoinusd

BTC MARKET UPDATE
🔥 **$117K-$115K Zone:** Critical hold – Strong demand area! Expect bounce-back to $127K+.It's essential for BTC to defend this level to maintain bullish momentum
⚠️ DYOR | NFA
This pullback came after a strong rally driven by institutional ETF inflows, dovish Fed signals, and seasonal "Uptober" momentum, but it's now consolidating near key support levels. The market sentiment is mixed: bullish on longer-term fundamentals but cautious short-term due to overbought conditions and profit-taking.

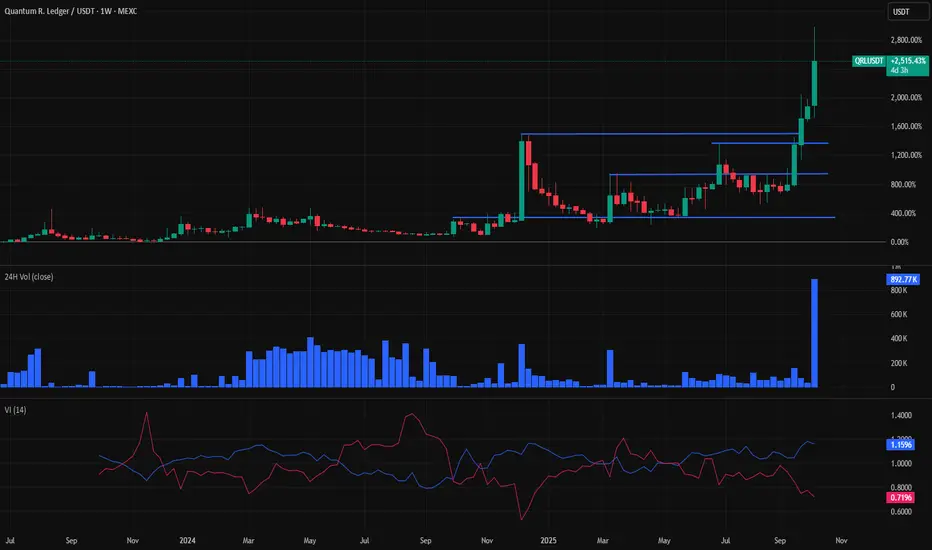
Quantum Computing and the Future of Blockchain Security
Many modern blockchains, including those using ECDSA signatures such as BITSTAMP:BTCUSD and COINBASE:ETHUSD , rely on cryptography that could one day be challenged by advances in quantum computing. While practical quantum attacks remain theoretical today, the discussion about post-quantum security is becoming more relevant as research accelerates.
Quantum Resistant Ledger ( MEXC:QRLUSDT ) is an example of a project that was designed from the beginning with quantum security in mind. Launched in 2018, it implements a different signature scheme (XMSS) that aims to remain secure against quantum-based attacks. Attached is the daily chart for MEXC:QRLUSDT , showing a rise in volatility as quantum computing news gained attention.
Recently, growing awareness of quantum computing’s potential impact on digital assets has coincided with higher volatility in quantum-security-related tokens. Traders are increasingly paying attention to how the “quantum threat” narrative may influence long-term blockchain evolution and investor sentiment.
From a broader perspective, the topic raises important questions for the crypto industry:
- How fast will quantum computing capabilities advance?
- What kinds of post-quantum algorithms are being tested by major networks?
- Which projects are best positioned to adapt to these changes?
As always, it’s important to approach the subject analytically. The quantum-security discussion may not affect market prices in the short term, but it could shape future developments across the blockchain landscape.
BTCUSD 30m – Bullish Continuation ExpectedBITSTAMP:BTCUSD
Structure | Trend | Key Reaction Zones
Price formed a strong base at 120,800, bouncing from the demand zone.
Accumulation structure confirmed, with multiple liquidity grabs before breaking the descending trendline.
Currently retesting breakout — bullish continuation likely if price holds above 123,200.
Market Overview
BTC has successfully broken out from a short-term bearish channel after sweeping liquidity from the lower side. The demand zone between 120,800–121,200 provided a solid foundation for buyers, signaling fresh momentum. Now retesting the broken trendline, and if held, we could see a continuation toward the upper supply zone.
Key Scenarios
✅ Bullish Case 🚀 → Bounce from 123,200 → 🎯 Target 124,500 → 🎯 Target 125,700 → 🎯 Target 126,200
❌ Bearish Case 📉 → Break below 122,000 → 🎯 Target 121,000 → 🎯 Target 120,000
Current Levels to Watch
Resistance 🔴: 124,500 / 125,700
Support 🟢: 123,200 / 121,800
⚠️ Disclaimer: This analysis is for educational purposes only. Not financial advice.

#Bitcoin $BTC price hits a new ATH over the weekend!Despite the excitement, there’s no sign of panic liquidations — around $200–400M per day, which is perfectly normal 👌
😬 The Fear & Greed Index now ranges between 71–74 — high, but not extreme.
Altcoins still look hesitant, which keeps both BTC.D and USDT.D in focus.
This setup closely resembles late April and June 2025, when both indexes started dropping — giving alts room to rally 🚀
📊 Order book ( OKX:BTCUSDT ) shows mixed sentiment:
Light resistance at $126K–130K
Strong bids near $118K
That suggests a sharp correction isn’t part of the plan — yet 👀
P.S:
This chart hasn’t been redrawn in years — it’s our “purity benchmark,” clearly showing the uptrend since late 2022 📆
🤔 What’s your take — will alts finally wake up, or will CRYPTOCAP:BTC keep stealing the show?
______________
◆ Follow us ❤️ for daily crypto insights & updates!
🚀 Don’t miss out on important market moves
🧠 DYOR | This is not financial advice, just thinking out loud

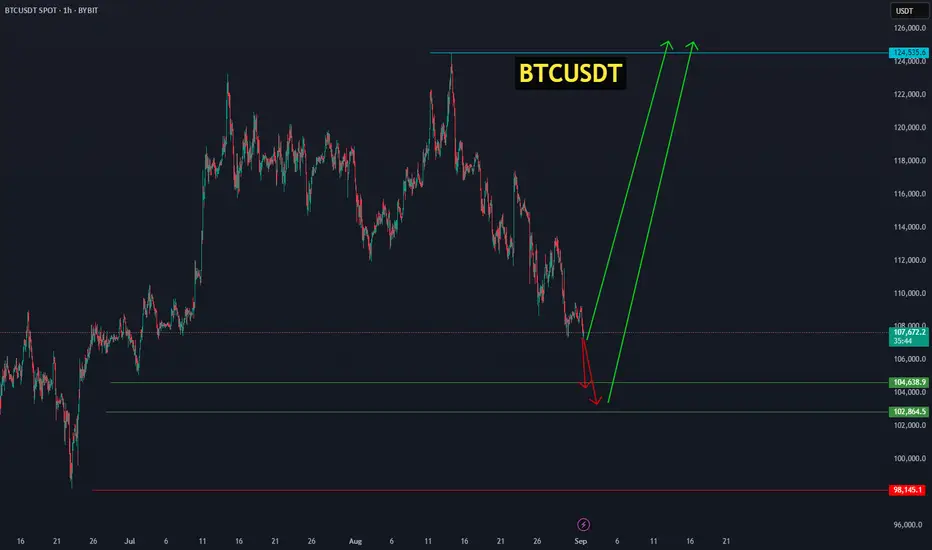
Bitcoin from the 102,864 zone is set to ignite its next bullish Bitcoin will either start its upward move from the current price or from the range of 104,638.9 – 102,864.5, aiming for targets between 118,000 and 124,535. BINANCE:BTCUSDT
My idea on how Bitcoin can move the coming months!I will let the chart tell the story!
If we break the rising wedge top line we are set to visit the "bubble could fill zone"
Fingers crossed we break up instead of down, because that looks terrible if we do!

BTC looks like it could crack any minuteI'm no stranger to seeing insane volatility around BTC and the macros. Following the technicals a bit closer and knowing full well that many are in for the profit taking, BTC appears like it will come down any minute. Saylor may buy at the top, but also remember that he is doing that with other people's money and notoriously lost $6B in one day! I'd be very careful making any long traders here. Best of luck! CBOE:MSTZ could be a nice play :)

$BTC seems spike seems a little "too coordinated" All for healthy trading and stocks / crypto making gains, but what we're seeing in BTC seems very engineered and highly coordinated. Needs to be investigated. BTC and crypto markets are not strange to rugs and a lot of f$ckery taking place. One this is for sure that profit takers will take advantage of this! Be very careful and measured. I've seen this movie way too many times. If you're up, take your profit and sit back waiting for your next opportunity. Way too hot!

All Aboard XRPI think from here we have built a pretty strong support around $2.94-$3. I expect crypto to take over the gold rally as the treasury looks into creating a digital asset reserve first starting with bitcoin. The government shutdown should give boost to this initial rally.
-This is not financial advice good luck!

BTC/USDT: Bullish Surge to 136K?BINANCE:BTCUSDT is gearing up for a bullish move on the daily chart , with an entry either from the current level or a pullback to the specified trendline .
The target at 136000 aligns with the next major resistance, signaling strong upside potential. Set a stop loss on a daily close below 108500 to manage risk effectively.
A break above 118000 with solid volume could trigger this surge, driven by market sentiment and BTC dominance. Watch key news! 💡
📝 Trade Plan:
✅ Entry: From current price or on a pullback to the trendline
❌ Stop Loss: Daily close below 108,500 to manage risk
🎯 Target: 136,000 (next major resistance)
Ready for this lift-off? Drop your take below! 👇

BTC Still IN GREEN ZONE - UPDATE 01-10-2025BTC/USDT Update
✅ Bitcoin has reclaimed the low time frame zone, showing renewed strength after the recent dip.
📊 As long as BTC continues holding above $113.6K support, the short-term trend remains bullish.
🚀 The next target sits around the $116K zone, where resistance could be tested in the coming sessions.
🔑 The main trend remains far below, meaning the broader structure is still secured and positive.
📌 Summary:
BTC is holding strong above the low time frame support, with momentum building toward the $116K target zone. Holding this structure keeps the outlook bullish.

BTC LOOKS POSITIVE ON LOW TIME FRAME - UPDATE 27-09-2025BTC/USDT Update
On the low time frame, BTC has turned positive, showing signs of recovery after consolidation.
Price action is now trending upward toward the main trend zone, which will be the key resistance area to watch.
Key levels:
Low time frame zone → currently acting as support after the bounce.
Main trend zone → upcoming resistance. A clean breakout and confirmation above this level would strengthen the bullish case.
Upside scenario: If BTC can reclaim and hold above the main trend zone, momentum could expand strongly, shifting structure back into an uptrend.
Downside risk: Failure to break into the main trend zone could keep BTC stuck in sideways or corrective action.
📌 Summary
BTC is up on the low time frame → short-term momentum is bullish.
Next target: main trend zone for confirmation.
Break above main trend = uptrend confirmation; rejection = sideways risk.

Bitcoin BTCUSD Possible 50% CorrectionNot pictured, BTCUSD weekly has the tightest Bollinger Band squeeze in history, suggesting a big move is coming soon.
The weekly candlestick pattern is currently an Evening Star. Momentum is pointing down with a bearish crossover.
There is confluence at the 1.618 Fib extension and the 200-week Moving Average that points to a possible correction to $54-56K.

BTCUSDT Sell PossitionWe are in a downward channel, be careful and the selling position has the most gain.

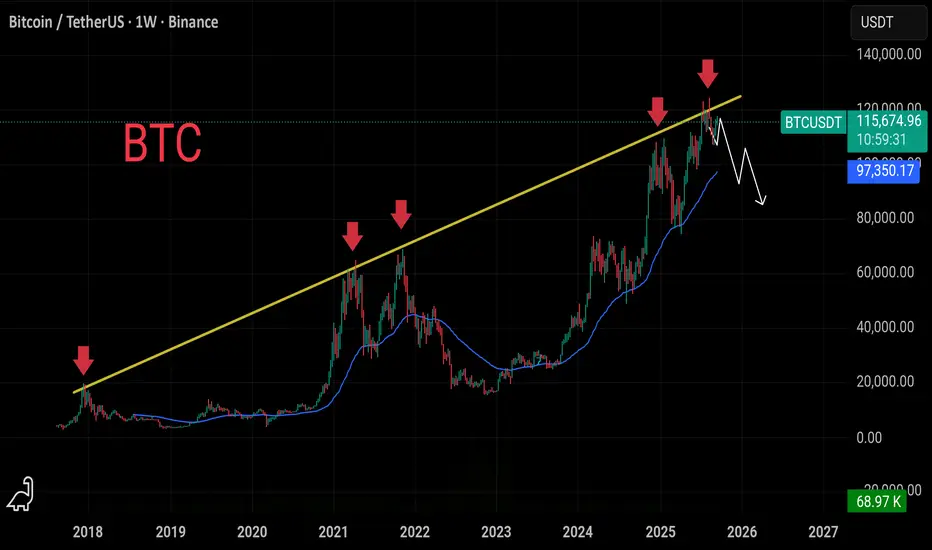
GROUND SHAKING: $BTC must breach $127K+ to keep the bull alive.🚨GROUND SHAKING: CRYPTOCAP:BTC must breach $127K+ to keep the bull alive.
It's the 2017 -> 2021 top-to-top trendline acting as final boss.
Break it = blue sky.
Fail = distribution risk.
Your move #Bitcoin ⚡️

Introduction to a Trading System 1: Setting timeframes + bonusIntroduction to a Trading System: Setting Timeframes & Logarithmic Scaling
This educational video is the first in the "Signal and Structure" series, where an experienced crypto trader with 5+ years in cryptocurrency and additional forex background shares their systematic approach to chart analysis and trading.
Key Topics Covered:
Logarithmic Scale Fundamentals
- Why log scale is essential for cryptocurrency trading
- How it provides better perspective on price movements across different time periods
- Demonstrates using Bitcoin's price history how log scale reveals the true magnitude of moves and shows market maturation
Strategic Timeframe Selection System
- Introduces a unique 5-timeframe system based on dividing by 4:
- Monthly (30 days) - the base unit
- Weekly (≈30÷4 days)
- 2-Day (≈week÷4)
- 12-Hour (48 hours÷4)
- 3-Hour (12÷4)
Trading Philosophy
- Emphasizes simplification over complexity in trading
- Explains why using non-standard timeframes (2-day instead of daily) provides an edge
- Discusses how higher timeframes show cleaner structure while lower timeframes display more chaos
- Advocates for making trading easier by reducing noise and confusion
Practical Insights
- Higher timeframes (monthly/weekly) show more reliable patterns and are watched by institutional traders
- Lower timeframes become increasingly chaotic but still contain tradeable patterns
- The importance of stepping back to see the bigger picture in markets
The instructor brings a unique perspective influenced by classic traders like Gann and Wyckoff, and has developed over 140 custom indicators for their trading system. The video sets the foundation for understanding market structure before diving into signals and trading strategies in future episodes.

BTC low time frame entering LONG📊 Market update
BTC started at 112.9K with a green uptrend on the lower time frame, suitable for scalp trading. For confirmation of the main trend, BTC should target 114.5K to enter a new uptrend.
⏱️ About altcoins
OG/USDT and JOE/USDT are showing some trend volume.

$BTC Sunday Update Nothing has changed, structure still intactCRYPTOCAP:BTC Sunday Update
Nothing has changed, structure still intact I’m still holding my short, staying patient for the lower targets ahead. If BTC makes a push into 120, 125K, that’s where I’ll load more. My downside map stays the same: 105K → 100K → 95K → 90K. Altcoin pumps look like nothing more than liquidity traps set by market makers before the real drop unfolds.
GOLD STILL BULLLISHI am having a two what out zone for continuation on the metal
All features of bullish are visible,,,,
I am bac to calling out set ups for you guys
#LOST BUT FOUND
#GOLD

Trendline Breakout AlertREZ/USDT has been under a descending trendline for a long time.
Now the price has finally tested & broken out 🔥
🔑 Trading Plan:
✅ DCA zone already tapped (perfect accumulation entry).
✅ If price holds above breakout → first target 0.034 (20% book).
✅ Next target 0.065 (30% book).
🎯 Final upside zone: 0.17 – 0.186
📊 Risk Management:
Stoploss below 0.0069 = setup invalid.
Always stick to DCA strategy & take partial profits on the way up.
⚡️ This trade requires patience & discipline. If the breakout sustains → strong upside potential in the coming months.

Bitcoin BTC price analysis FOMC Fed rate🚀 CRYPTOCAP:BTC price is rising, while altcoins remain silent.
What happens tomorrow when the Fed announces its new rate? 🤔
📊 Expectations:
98% believe in a -0.25% cut
2% expect -0.5%
and no one believes it will stay unchanged at 4.5%
That’s why the market has already priced this in. But tomorrow, once the official decision comes — everything could flip ⚡️
📉 The chart looks like chaos to most, but a "trained eye" sees harmony: candles moving level to level.
🔑 Key zones for OKX:BTCUSDT :
Upper channel boundary: $117,800 – $118,000 (only breakable on massive volumes).
September is statistically weak. It opened at $108K, that’s the “zero point”. Logical scenario — dip to $102K.
😬 Worse scenarios:
$96,500
GAP close at $91,600 (but you’ll roast us for this one 😂).
❓Your take: By the end of September, will #Bitcoin be above $108K or below?
______________
◆ Follow us ❤️ for daily crypto insights & updates!
🚀 Don’t miss out on important market moves
🧠 DYOR | This is not financial advice, just thinking out loud.

Bearish reversal for the Bitcoin?The price is reacting off the pivot and could drop to the 38.2% Fibonacci support.
Pivot: 116,976.22
1st Support: 113,498.37
1st Resistance: 119,215.75
Disclaimer:
The above opinions given constitute general market commentary, and do not constitute the opinion or advice of IC Markets or any form of personal or investment advice.
Any opinions, news, research, analyses, prices, other information, or links to third-party sites contained on this website are provided on an "as-is" basis, are intended only to be informative, is not an advice nor a recommendation, nor research, or a record of our trading prices, or an offer of, or solicitation for a transaction in any financial instrument and thus should not be treated as such. The information provided does not involve any specific investment objectives, financial situation and needs of any specific person who may receive it. Please be aware, that past performance is not a reliable indicator of future performance and/or results. Past Performance or Forward-looking scenarios based upon the reasonable beliefs of the third-party provider are not a guarantee of future performance. Actual results may differ materially from those anticipated in forward-looking or past performance statements. IC Markets makes no representation or warranty and assumes no liability as to the accuracy or completeness of the information provided, nor any loss arising from any investment based on a recommendation, forecast or any information supplied by any third-party.
