bitcoin daily bullish outlook Like i said earlier, i have a bullish bias on bitcoin. All you have to do is zoom out.
My next buy zone is around 86k. I am going to long bitcoin from 85-86k all the way back to 103-104k, where the next daily liquidity and supply zone is located
Wait for price to form sort of a reverse head and shoulder pattern and buy from the break out.
Bitcoinusdt

BTCUSDT – Daily Market Structure UpdatePrice is currently trading within a well-defined daily support zone following the recent bearish impulse. The sharp reaction into this area suggests sell-side momentum is weakening, and the market is now entering a period of balance rather than continuation to the downside.
I expect Bitcoin to consolidate within this daily range over the coming days as price digests the prior move and liquidity accumulates. This sideways behavior is constructive and often forms the base for the next expansion phase.
Provided this zone continues to hold, the higher-timeframe structure remains intact. A clean breakout and daily close above the consolidation high would signal renewed bullish intent and increase the probability of a push toward higher resistance levels. Until then, patience is warranted as the market develops its next clear setup.

Bitcoin (BTC/USDT) – Monthly OutlookThe new 12-month candle has just opened with Bitcoin holding firmly above prior macro structure. Price is consolidating just below the previous All-Time High, showing acceptance at premium levels rather than rejection.
Monthly market structure remains bullish, with higher highs and strong candle bodies signaling continued demand. The lack of deep pullbacks suggests sellers are being absorbed, increasing the probability of a clean ATH breakout and continuation into price discovery.
As long as price holds above the yearly opening range, the bias remains bullish.
Bias: Bullish
Expectation: ATH break
Invalidation: Monthly close back below prior structure

Bitcoin - 2025After a long consolidation around $100,000, and a correction of ~32% from the top, it seems we are preparing for a new move.
In the previous idea, I mentioned that there could be either consolidation or a healthy correction, but both happened.
I will describe several scenarios that I see.
I will describe only positive, super-positive and ultra-positive ones.
Since the negative sounds like this - we have already reached the peak, there will be a small over-high, and we will go bearish.
Positive scenario - parabolic growth, with a new peak in the region of $150,000-$200,000
Super-positive scenario - parabolic growth, with a new peak in the region of $200,000-$300,000
Ultra-positive scenario - parabolic growth, with a new peak in the region of $300,000-$400,000
Now you must ask - can we really reach $400,000, how is this possible, with the current price of $84,000, and April outside the window?
I will tell you that there is nothing complicated or incredible here, that is why it is ultra-positive.
But you should focus only on positive and negative scenarios, and not float in the clouds hoping for a miracle.
As for altcoins, in this scenario, I don't think Bitcoin dominance will last long, so high, in any case, soon there will either be an overflow and altcoins will start shooting, or we will all die from the paws of bears
HOLD YOUR BEARS, IT'S NOT OVER

Bitcoin - Long idea1 target is $90,500.
2 target: $92,600
3 target: $94,000
4 target: $95,200
5 target: $96,000
Final target: $98,000.
After reaching the first target, I move the stop to break even.
BINANCE:BTCUSDT.P

BITCOIN - Buy nowBITCOIN (BTC/USD) has recently been stuck inside a triangle channel pattern and has struggled to break out for a few weeks. However, the price has recently broken a strong resistance level (the white trend line shown on the chart) - The price is currently above the trend line which acted as a strong resistance level and is now very likely to hit the next resistance zone which is labeled as the take profit level. buy bitcoin!

Silent Waves Before the Surge The current BTCUSD structure shows the market completing a major impulsive wave, followed by a corrective phase that is still unfolding. The correction has taken the form of overlapping subwaves, suggesting consolidation rather than a sharp reversal.
Within this corrective movement, smaller waves are building a base that could serve as the foundation for the next impulsive leg. The pattern indicates that the market is preparing for renewed momentum once the corrective sequence is fully exhausted.
The overall wave count continues to favor a bullish continuation scenario, provided the corrective structure resolves in alignment with classical Elliott principles. Traders should watch for the transition from consolidation to impulse as the next defining move.

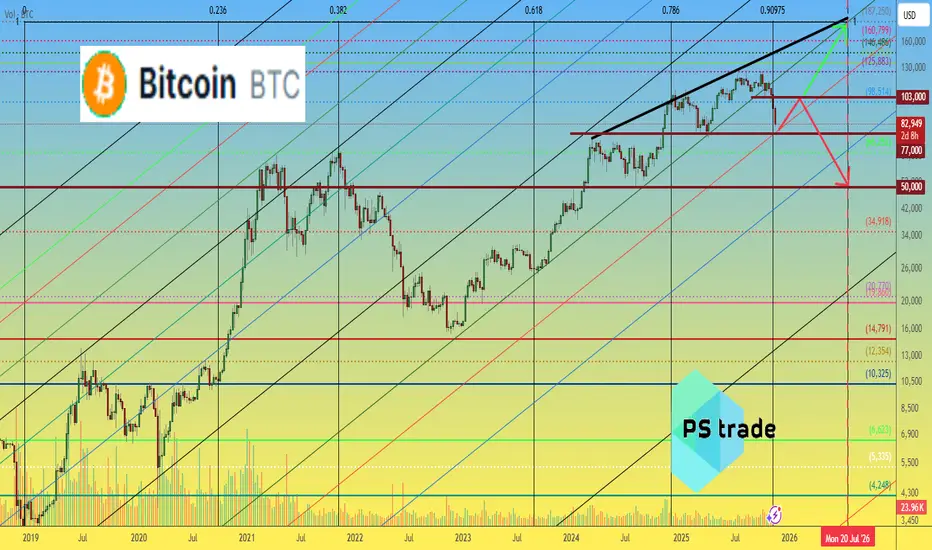
Bitcoin BTC price analysis until mid-2026The long-term CRYPTOCAP:BTC trend (2023 → Nov 2025) has either broken its structure or expanded into a wider channel.
The next few weeks will be critical for determining the macro direction for OKX:BTCUSDT price
Key zones:
• 🔻 Support: $75,000–$77,000
• 🔺 Resistance: $103,000–$105,000
A breakout of one of these ranges is likely to define Bitcoin’s trajectory into mid-2026 — either toward $190K or a deeper pullback toward $50K.
🤔 What’s the more probable scenario on your chart — bullish expansion or a structural breakdown?
______________
◆ Follow us ❤️ for daily crypto insights & updates!
🚀 Don’t miss out on important market moves
🧠 DYOR | This is not financial advice, just thinking out loud
BTC Top in play. The diagonal at 95k–98k is the last defenceYou have seen this movie. The current weekly structure mirrors the Jan to Nov 2021 distribution: two peaks, heavy swings, then loss of momentum that led to a full cycle retrace. Back then Bitcoin set an all time high in November 2021 after a prior April peak, then rolled over.
Here is the read. Treat the rising weekly diagonal on the chart as your line in the sand. That line aligns with the 95k to 98k area. Hold above it and the uptrend stays intact. Lose it on a weekly close and trend shifts down with room for a deeper retrace. This is standard trend line and support logic. A break of support signals direction.
Why compare to 2021. That cycle topped after a double top style range and then unwound sharply. The pattern of repeated rallies that fail at highs fits that script. Double tops mark bearish reversals after an advance.
What to do now. Focus on the diagonal and the 95k to 98k zone. Watch weekly closes, not intraday wicks. If price closes below the line, accept the downtrend and step aside or trade with the trend. If price reclaims the recent weekly high and holds, the top thesis is invalid. Use the chart, not opinions.
Context for new readers. In the last full cycle Bitcoin peaked near 69k in November 2021 and then fell into a bear market, which is why this comparison matters.

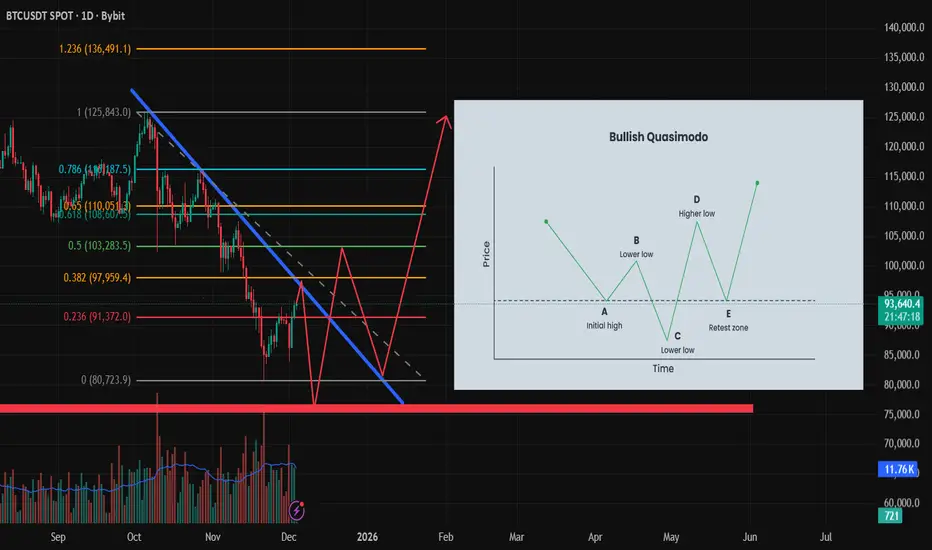
BTC Bullish Quasimodo Forming? Potential Reversal Setup 80k–125kBitcoin continues to trade below the macro descending trendline, respecting lower highs since the last major swing high. Price is currently around the 93k area, reacting to a minor resistance + Fibonacci cluster.
🔍 Why a Bullish Quasimodo Is Possible
A Bullish QM (Quasimodo) pattern forms when the market creates:
Initial High
Lower High
Lower Low (liquidity sweep)
Higher Low (retest zone)
Break of Structure to the upside
BTC appears to have formed steps 1 and 2, and may be setting up for a deeper sweep to complete the Lower Low around the major demand zone.
🧭 Projected Price Path
Short-term expectation (bearish liquidity sweep):
Possible rejection from the descending trendline
Decline toward 91,300 → 88k → 86k
Final liquidity sweep into ~80k, which aligns with a major demand zone and previous volume imbalance
Mid-term expectation (bullish reversal):
Strong bounce from the 80k zone
Formation of the Higher Low (QM retest zone)
Break above the descending trendline
Upside targets:
97,900
103,200
108,000
125,000+ (Fibonacci extension target)
🎯 Bias Summary
Short-term: Neutral to bearish (liquidity sweep expected)
Mid-term: Bullish reversal if QM structure completes and price forms a Higher Low
⚠️ Invalidation
A clean daily close below 78,500 invalidates the Bullish QM scenario.
Bitcoin Classic Bearish StructureThe weekly picture for Bitcoin is looking heavy. After losing the W21 EMA , price briefly caught a bid at the W50 EMA but was promptly rejected on the retest of the W21. The subsequent breakdown was swift, now finding a temporary floor at the Monthly21/W100 EMA.
The W21 EMA has officially now flipped from support to key resistance, and any bounce will likely be sold into until that level is recaptured by the end of the Bear Market
Are we looking at a consolidation here before another leg down to the W200 SMA?
Or Bulls are looking for an abrupt pump back to the W21 ema??!
Let me know what you think down Below!

BitcoinBTCUSD
- Completed " 1234 " Impulsive Waves
- Break of Structure
- RSI - Divergence
- Bullish Channel as an corrective pattern in Short Time Frame
- Demand Zone

$BTC Update: Last Sunday, we discussed that Bitcoin could move CRYPTOCAP:BTC Update:
Last Sunday, we discussed that Bitcoin could move toward $115K, and after that, a pullback was expected. However, this week the market showed clear manipulation — Bitcoin jumped back to $114K, then dropped to $106K, reacting to a mix of news around China, Trump, and tariffs, along with other bullish and bearish headlines.
For now, Bitcoin has reclaimed the $110K support and is trading above it, showing some short-term strength.
If BTC continues to hold above $110K, the next resistance is near $113.5K, around the 1D 50 EMA, which remains the strongest hurdle for bulls. A clean breakout and hold above this zone could trigger a move toward $117K–$120K — that’s where I’ll be looking to add more shorts.
I’m still holding my previous short position with an average entry around $122K, and my plan is to add more if price reaches $115K–$117K. The overall structure remains bearish, and I’m waiting for clear direction.
Today’s CPI report will likely decide the next move:
If BTC pushes higher on the data, I’ll add to my shorts.
If it drops, I’ll continue holding.
The only time I’ll consider closing shorts is if Bitcoin breaks and resists below $100K.
#bitcoin

Bitcoin BTC price analysis after crash📈 OKX:BTCUSDT held above the key psychological level of $100,000, remaining within the long-term uptrend 💪
💀 Altcoins suffered heavy losses — liquidity vanished across the board.
This highlights the importance of balance:
🔸 20% in low-cap alts
🔸 80% in resilient assets
💰 The official $19–20B liquidation figure seems understated —
data suggests the cascade started on CEX platforms after algorithmic issues and liquidity gaps.
📊 Fear & Greed Index: 38 — still fear, volatility ahead ⚠️
🇺🇸 The U.S. market open could set the tone for the week 🎢
💭 Do you expect CRYPTOCAP:BTC to retest lower levels before the next leg up?
______________
◆ Follow us ❤️ for daily crypto insights & updates!
🚀 Don’t miss out on important market moves
🧠 DYOR | This is not financial advice, just thinking out loud

Continuously making HH HLBTC Analysis
CMP 112510.14 (12-10-2025 02:58AM PST)
Continuously making HH HL & is Still Bullish in the
longer run.
as shared on 02-06-2025, Cup & Handle Target hit
around 115000 - 120000 & then dropped.
3 Important Support levels are :
S1 around 108000 - 108450
S2 around 95000 - 95200
S3 around 86000 - 86500
S2 seems to be a Stronger Support as this range is
also around Channel Bottom.
Upside Targets seems to be around 132000 - 132300
initially.
BTC seem safe as long as it stays above 74000; if it
breaks this level, we may witness trend reversal.

BTC MARKET UPDATE
🔥 **$117K-$115K Zone:** Critical hold – Strong demand area! Expect bounce-back to $127K+.It's essential for BTC to defend this level to maintain bullish momentum
⚠️ DYOR | NFA
This pullback came after a strong rally driven by institutional ETF inflows, dovish Fed signals, and seasonal "Uptober" momentum, but it's now consolidating near key support levels. The market sentiment is mixed: bullish on longer-term fundamentals but cautious short-term due to overbought conditions and profit-taking.

#BITCOIN SUNDAY ANALYSIS $BTC the daily and monthly charts are#BITCOIN SUNDAY ANALYSIS
CRYPTOCAP:BTC the daily and monthly charts are now confirming that view. Bitcoin is trading around 123K, right at the upper resistance zone that has triggered every major correction since 2018.
🔸 Weekly Chart View:
BTC has once again touched the long-term trendline that has acted as a selling for every bull cycle top (2018, 2021, and now 2025). Each red arrow marks a rejection, and this latest test looks no different. Until we see a clean weekly close above this trendline, the risk of another major pullback remains high.
🔸 Daily Chart View:
On the lower timeframe, price is trading inside the green supply box between 110K and 125K, the same area that rejected BTC multiple times this year. Structure remains weak, holding below 125K still high chances of big correction.
And it’s not just the trendline or resistance we’re also seeing typical top signals: overly bullish headlines, extreme optimism, and calls for “1M BTC soon.” These usually show up near market tops, not bottoms.
📉 My Trade:
I’m still holding my shorts. All limit orders are filled and my average entry is around 122K. I’ll share updates if I make any changes or close the position.
📌 Downside Targets:
105K → 100K → 95K → 90K

Introduction to a Trading System 1: Setting timeframes + bonusIntroduction to a Trading System: Setting Timeframes & Logarithmic Scaling
This educational video is the first in the "Signal and Structure" series, where an experienced crypto trader with 5+ years in cryptocurrency and additional forex background shares their systematic approach to chart analysis and trading.
Key Topics Covered:
Logarithmic Scale Fundamentals
- Why log scale is essential for cryptocurrency trading
- How it provides better perspective on price movements across different time periods
- Demonstrates using Bitcoin's price history how log scale reveals the true magnitude of moves and shows market maturation
Strategic Timeframe Selection System
- Introduces a unique 5-timeframe system based on dividing by 4:
- Monthly (30 days) - the base unit
- Weekly (≈30÷4 days)
- 2-Day (≈week÷4)
- 12-Hour (48 hours÷4)
- 3-Hour (12÷4)
Trading Philosophy
- Emphasizes simplification over complexity in trading
- Explains why using non-standard timeframes (2-day instead of daily) provides an edge
- Discusses how higher timeframes show cleaner structure while lower timeframes display more chaos
- Advocates for making trading easier by reducing noise and confusion
Practical Insights
- Higher timeframes (monthly/weekly) show more reliable patterns and are watched by institutional traders
- Lower timeframes become increasingly chaotic but still contain tradeable patterns
- The importance of stepping back to see the bigger picture in markets
The instructor brings a unique perspective influenced by classic traders like Gann and Wyckoff, and has developed over 140 custom indicators for their trading system. The video sets the foundation for understanding market structure before diving into signals and trading strategies in future episodes.

Bitcoin long term forecast The latest high of Bitcoin is forming on the weekly timeframe, and after that, a sharp Downward movement is expected. Its minimum target is $75,000, followed by a target of $60,000. Bitcoin is expected to fluctuate within a specific price range at least until October 2027, and after that, its price fluctuations may come to an end over different time periods.
If the price surpasses $125,000, this analysis will be invalidated.

Bitcoin BTC price analysis FOMC Fed rate🚀 CRYPTOCAP:BTC price is rising, while altcoins remain silent.
What happens tomorrow when the Fed announces its new rate? 🤔
📊 Expectations:
98% believe in a -0.25% cut
2% expect -0.5%
and no one believes it will stay unchanged at 4.5%
That’s why the market has already priced this in. But tomorrow, once the official decision comes — everything could flip ⚡️
📉 The chart looks like chaos to most, but a "trained eye" sees harmony: candles moving level to level.
🔑 Key zones for OKX:BTCUSDT :
Upper channel boundary: $117,800 – $118,000 (only breakable on massive volumes).
September is statistically weak. It opened at $108K, that’s the “zero point”. Logical scenario — dip to $102K.
😬 Worse scenarios:
$96,500
GAP close at $91,600 (but you’ll roast us for this one 😂).
❓Your take: By the end of September, will #Bitcoin be above $108K or below?
______________
◆ Follow us ❤️ for daily crypto insights & updates!
🚀 Don’t miss out on important market moves
🧠 DYOR | This is not financial advice, just thinking out loud.

BTCUSDT - What next ?? We can see a retest of 111k7 level, but bitcoin was not successful in closing above it.
111K7 continues to remain as our area of interest for now. Closing above which we will change bias.
For now bitcoin is still bearish....
Happy Trading!!!

Bitcoin trade planGot rejected from 112k , Looking forward to build a short position to 100k as swing short!
Close below 110k and we go short..
Waiting
Let's see how it plays...

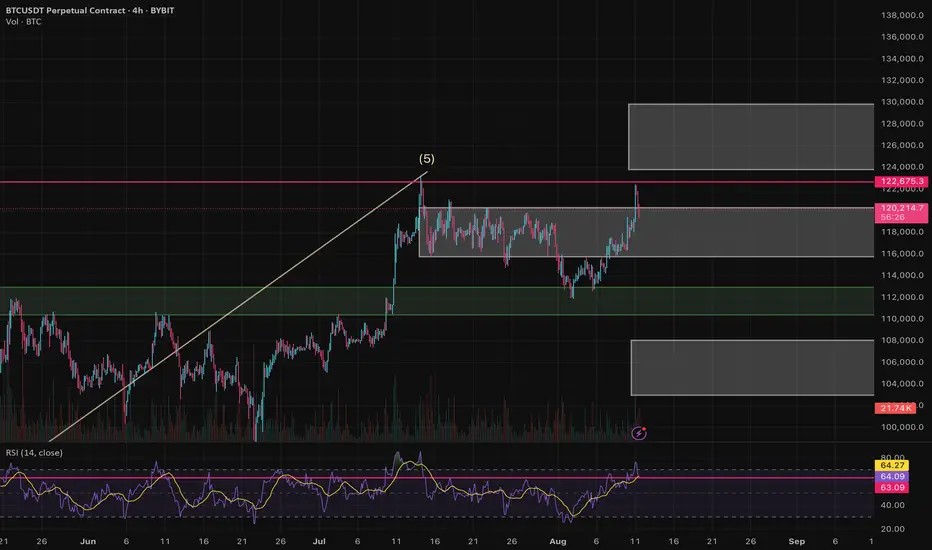
$BTC Weekly Analysis – Big Move Coming?Bitcoin is currently trading near the 122300 resistance zone.
So far it looks more like a false breakout of the 120k level, and on a bigger picture I see the potential for a correction into the 90k–100k range. However, this doesn’t necessarily have to happen in the coming days.
Possible scenarios for the week:
Sideways : accumulation within the 115k–120k range.
Bullish scenario : a daily close above 120500 could open the way for a rally toward the 125k–130k zone.
Bearish scenario : if price drops below 115k, I expect a move toward the 102k–107k area. The green zone (~111k) could provide strong support, as it has previously held the price.
RSI on the daily chart is at 63, very close to the overbought zone. A breakout above 120500 could extend the rally, but the risk of a pullback is high.
Disclaimer: The author’s opinion may not align with yours.
BYBIT:BTCUSDT.P