BTCUSD set to rise $124482?BTCUSD trade setup for today :
Before we look at potential entry in this pair first let’s look at multiple timeframe analysis in this market.
Monthly: 124482 Monthly resistance price has got rejection strongly from the top
Weekly: Price has just got just broken out of the support
Daily: Price on the daily significant support level
Entry timeframe 4H : Price has printed 4h has got rejected strongly from the daily support level.
Possible trade recommendation : Bullish trade with high probability set up
Bitcon

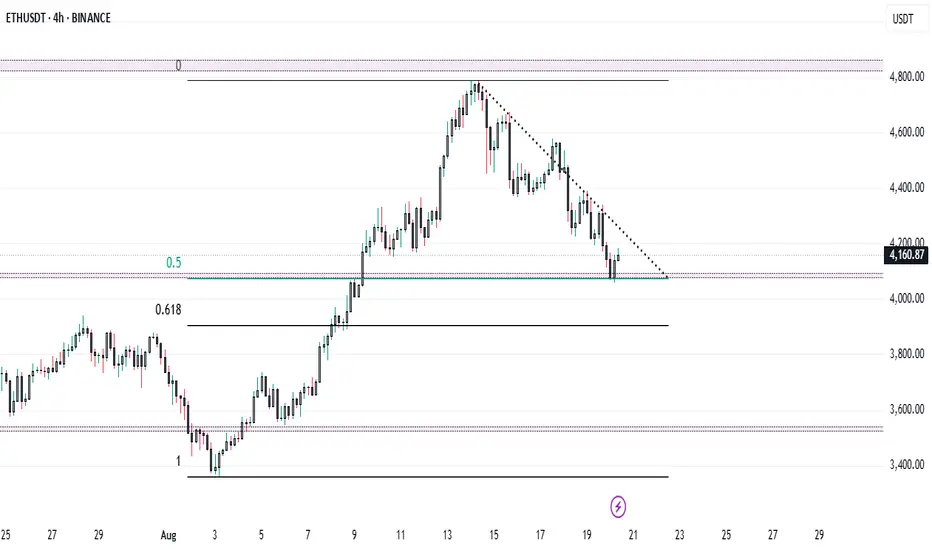
ETH at $4,100 – Can Bulls Defend Key Support Before FOMC..?ETH + FOMC = Volatility Ahead ? 🔥
Ethereum at Make-or-Break Zone: $4,100 Support in Focus!
Ethereum (ETH/USDT) on the 4H timeframe is showing a decisive battle between bulls and bears. After topping near $4,700, ETH has been in a steady downtrend, respecting the descending trendline.
🔑 Key Levels to Watch
* Immediate Support: $4,100 – $4,150 (0.5 Fib retracement)
* Major Support: $3,950 – $4,000 (0.618 Fib retracement)
* Resistance Zone: $4,300 – $4,350 (descending trendline)
* Major Resistance: $4,600 – $4,700 (recent swing high)
📈 Bullish Scenario
✅ A breakout above $4,300 trendline resistance could trigger strong momentum toward $4,500 - $4,600.
✅ Holding $4,100 support will keep buyers in control.
📉 Bearish Scenario
❌ If ETH fails to hold $4,100, expect a deeper retracement toward $4,000 (0.618 Fib).
❌ A break below $3,950 may extend the fall to $3,700 – $3,600.
⚠️ Market Note
📌 Today’s FOMC meeting could heavily impact the crypto market trend.
Expect volatility as Fed commentary on interest rates may guide ETH’s next major move.
⚖️ Conclusion
ETH is at a critical support zone where the next move will define short-term direction.
* Above $4,300 → Bulls regain control.
* Below $4,100 → Bears target $4,000 and lower.
BTCUSDTHello Traders! 👋
What are your thoughts on BITCOIN?
After setting a new high, Bitcoin failed to hold above the broken resistance zone and was rejected, falling back below the previously breached level.
The ascending trendline has also been broken, and price is currently attempting a pullback to the broken structure. As long as BTC stays below the resistance zone, we expect a move lower toward the next key support levels.
Bigger picture outlook remains bullish on higher timeframes, but in the short term, a deeper correction is likely.
Invalidation: A strong breakout and daily close above the resistance zone would negate the bearish short-term scenario and resume the broader uptrend.
Don’t forget to like and share your thoughts in the comments! ❤️

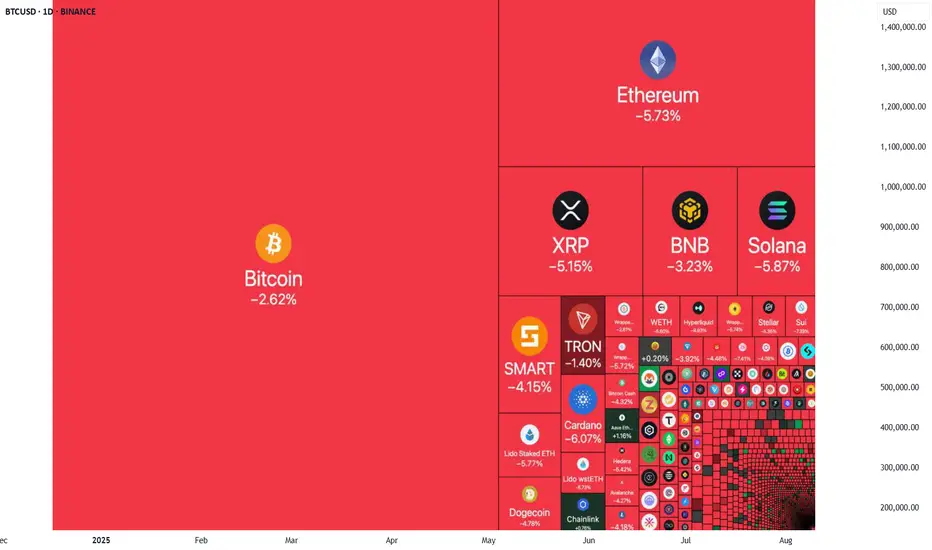
Why Is Crypto Tumbling? A Trader's Guide to the Recent Sell-OffWhy Is Crypto Tumbling? A Trader's Guide to the Recent Sell-Off 📉
🚨 If you're watching the markets today, you've seen the sea of red. Bitcoin, Ethereum, and major altcoins have experienced a significant pullback, leaving many to wonder about the cause.
While sharp drops can be unsettling, for the strategic trader, they are critical moments to analyze, not to panic. The current downturn isn't random; it's driven by a convergence of clear geopolitical, technical, and macroeconomic factors.
Here’s a breakdown of what’s happening behind the charts:
1. Geopolitical Uncertainty 🌐
High-stakes diplomatic meetings are underway involving the US, EU, and Ukrainian leaders to discuss the Russia-Ukraine peace deal. Markets inherently dislike uncertainty. As traders await a clear outcome, many are de-risking their portfolios, leading to selling pressure on assets like cryptocurrencies.
2. A Healthy Market Reset 📊
The crypto market just came off a powerful rally where many assets saw gains of 50-100%. This rapid rise led to a buildup of high-leverage positions. Today's dip is forcing a "leverage flush," liquidating over-extended traders. While painful for some, this is a standard market mechanism that washes out speculative excess and often creates a more stable foundation for future growth.
3. Shifting Macroeconomic Tides 📉
Just a week ago, a September interest rate cut was seen as a certainty. Now, recent economic data has slightly lowered those odds. Financial markets, including crypto, are incredibly sensitive to central bank policy. The market is now pricing in this small but significant shift in expectations, contributing to the downward pressure.
The Trader's Perspective: Opportunity in Volatility 💡
So, what does this all mean? It underscores a core principle of successful trading: volatility has a source.
For the prepared trader, this isn't a signal to abandon ship. It's a signal to consult your strategy. This is precisely the kind of environment where a clear, data-driven forecast becomes invaluable.
By understanding the root causes of the sell-off, you can better anticipate market structure, manage risk, and identify potential zones of support where "smart money" may begin to re-accumulate.
This is where the difference between a professional and a novice trader becomes clear. Experienced traders welcome every correction or pullback in the market, seeing it as an opportunity to re-enter and profit from the next upward wave. 📈
Therefore, instead of worry and stress, shift your focus to finding key reversal points and defining new entry zones (Watchboxes) for future trades at more attractive prices. View this price correction as a strategic opportunity, not a threat. 🚀
What are your thoughts on this pullback? Are you seeing it as a risk or an opportunity? Let's discuss in the comments. 👇
Trade Smart!
Navid Jafarian
BTCUSD BITCOIN Bitcoin has now triggered my trade and now I await it, to return to the upside and provide profits , I shall partial close if necessary

Bitcoin : Stay heavy on positionsBitcoin : Stay heavy on positions (2x)
Short-term overbought is noise. Focus on the bigger picture.
For new Bitcoin entries, now is the time.
If you're using leverage, I’d wait for a scale-in signal before jumping in.

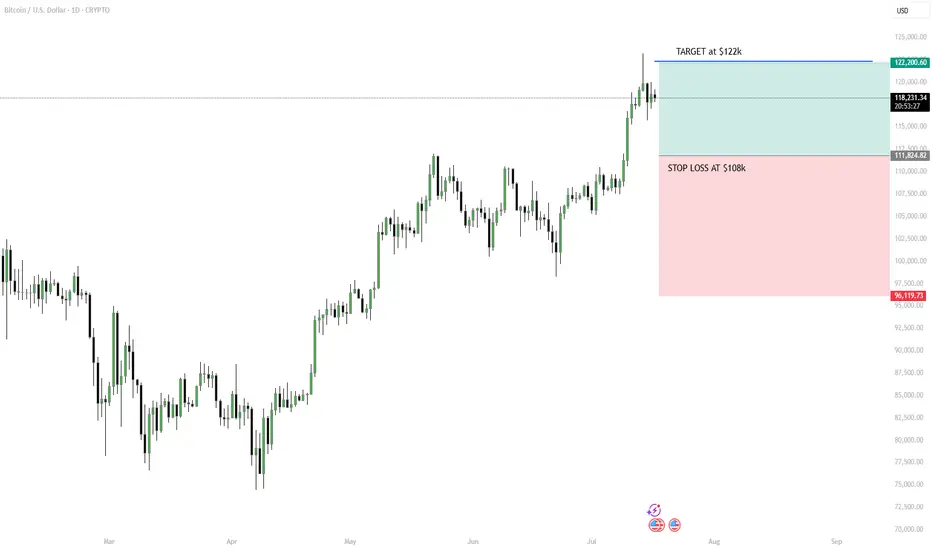
Strategy: “Breakout Bounce” – Buy the Retest, Ride the WaveHello Traders! BTC has broken out above $118K–$120K after a strong uptrend. Now it’s pausing, and a short-term pullback looks likely. Instead of buying the top, we wait for the price to retest previous resistance (around $112K–$114K), which could turn into support.
MY PLAN:
Wait for pullback to $112K–$114K zone.
Look for a bullish candle (daily or 4H) to confirm entry.
Target: $122K short-term or trail stop if trend continues.
Stop loss: Below $108K to manage risk.
Tip: Don’t chase. Be patient, follow the setup, and use proper risk management.
Please leave a comment and don't forget to support a fellow trader! Also, you can leave in the comments your target and plan ideas!
Have a great day y'all!
-Neo
Bitcoin's Natural Correction and the $141K Target Based on Fibonhello dear trader and investors
The cryptocurrency market is always accompanied by strong fluctuations and natural corrections. Bitcoin, as the market leader, requires corrections and liquidity accumulation after each significant rally to pave the way for higher price targets. In this article, we analyze Fibonacci structures and harmonic patterns to demonstrate that Bitcoin's next target could be $141K.
1. Bitcoin Corrections: A Natural Part of an Uptrend
Price corrections in bullish trends are a normal phenomenon that helps shake out weak hands and allows major players to accumulate liquidity. Historically, Bitcoin has experienced 20-30% corrections before resuming its upward trajectory. The current correction is no different and may serve as a base for the next strong move toward higher targets.
2. The $141K Target Based on Fibonacci
Fibonacci levels are among the most reliable tools for predicting price targets. Assuming Bitcoin's recent high was around FWB:73K and the ongoing pullback is a healthy retracement, we can use harmonic AB=CD pattern to project potential upside targets. Based on these levels, Bitcoin could reach $141K in the next bullish phase.
Confirmation Through Harmonic Patterns
Harmonic patterns like Butterfly and Gartley suggest that the current correction is forming a potential reversal structure. If this correction completes within the PRZ (Potential Reversal Zone), Bitcoin could see a strong continuation of its uptrend. The Fibonacci ratios in these harmonic structures indicate that the final price target for this bullish wave could be around $141K.
Volume and Liquidity: Key Drivers for the Rally
Bitcoin needs increased volume and liquidity inflows to reach higher levels. On-chain data shows that trading volumes are rising and large investors (whales) are accumulating rather than selling. This behavior typically precedes a strong bullish move.
Bitcoin's current correction is entirely natural, and technical structures suggest that it could be laying the foundation for a new bullish wave. Based on Fibonacci and harmonic pattern analysis, Bitcoin's next major target is around $141K. Traders and investors should consider these levels in their analysis and avoid emotional decisions during market corrections
good luck
mehdi

BTC- Following the TrendLine since YEARS, ExactlyYear on Year , each cycle BTC is adhering to this trend line, and also hit the 2 FIB EXACTLY for now - rejected there. It must cross this to test higher levels, but that may need a few weeks more of sideways moves. Keep a watch cause another rejection at this trend line will probably indicate we are not going higher.

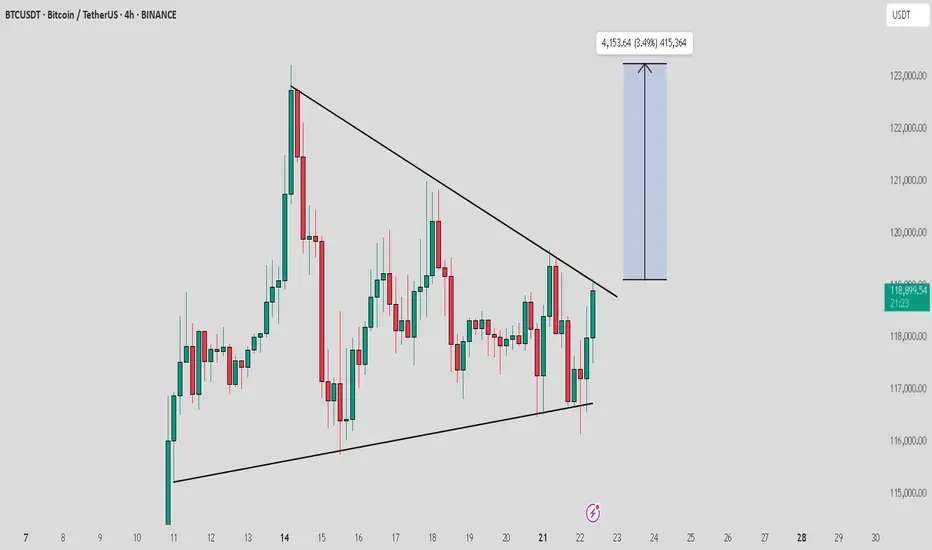
BTC / USDT near to breakout from trendline resistanceBTC is testing its trendline resistance after a steady buildup. A successful breakout could trigger a strong move toward the $122,000–$125,000 range. Worth watching closely in the coming sessions.
Bitcoin : Stay heavy on positionsApril was the scale-in zone:
Back in April, the US stock market flashed a split-entry buy signal—a classic zone for gradual accumulation.
That same setup applied to Bitcoin. Buying the fear worked again.
We’ve moved out of the fear zone:
Both Bitcoin and equities have left the extreme fear territory behind. Sentiment has shifted.
Short-term overbought now:
Bitcoin is currently in a short-term overbought phase. Some consolidation or cooling off is natural here, but no major trend reversal signs yet.
Stay heavy on positions:
I’m maintaining an overweight position in Bitcoin as long as the US stock market stays intact. The Nasdaq is holding up, so Bitcoin likely stays in risk-on mode.
Warning:
If US equities take a hit, expect Bitcoin to follow.
Negative moves in the stock market will likely translate directly into crypto weakness.

AVAX/USDT - H4 - Wedge Breakout (29.06.2025)The AVAX/USDT pair on the H4 timeframe presents a Potential Buying Opportunity due to a recent Formation of a Wedge Breakout Pattern. This suggests a shift in momentum towards the upside and a higher likelihood of further advances in the coming Days.
Possible Long Trade:
Entry: Consider Entering A Long Position around Trendline Of The Pattern.
Target Levels:
1st Resistance – 21.77
2nd Resistance – 24.35
🎁 Please hit the like button and
🎁 Leave a comment to support for My Post !
Your likes and comments are incredibly motivating and will encourage me to share more analysis with you.
Best Regards, KABHI_TA_TRADING
Thank you.

Bitcoin Breakout Fueled by Hidden Demand ZonesBTC just exploded out of consolidation — but the clues were all there. Price tapped the same demand zone three separate times, each time forming a higher low and respecting a clean rising trendline.
The final push broke through prior supply, flipping it into support and kicking off the breakout leg. These demand zones acted as hidden fuel for the move, offering clear entries for traders tracking structure.
📊 Demand respected at ~$104K, ~$107K, and ~$111K
📈 Breakout confirms rising structure and trendline strength
🧠 Key lesson: Strong moves are often born from clean structure, not noise
#BTCUSD #BitcoinBreakout #SmartMoneyMoves #PriceAction #TradingView #QuantTradingPro

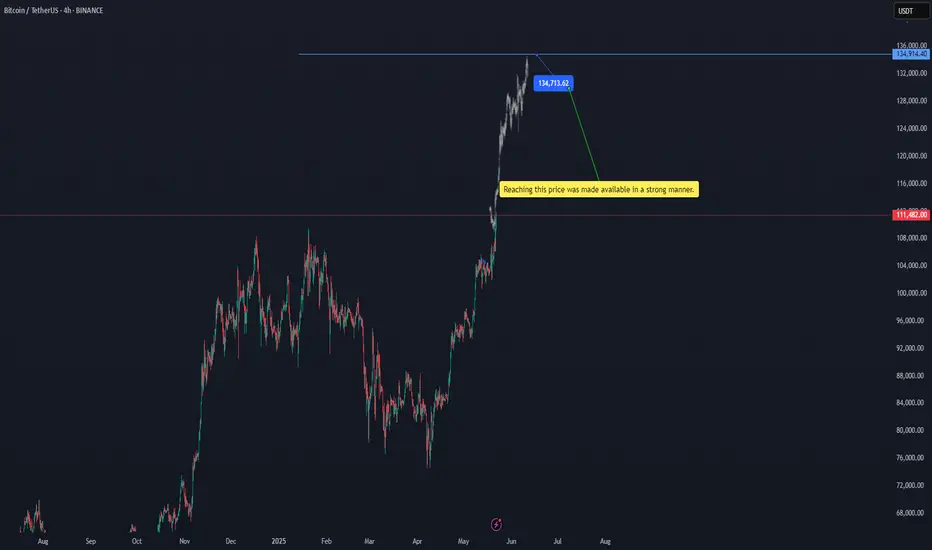
btcusdtReaching this price was made available in a strong manner. 134713.16$ BINANCE:BTCUSDT
Of course, there is a possibility of a temporary correction at the current price, but the target is $134,713.
#btc
BTCUSDTBitcoin may be looking to complete the downward correction from the $101,000 price range to $99,000 and then begin a long-term upward trend. Pay close attention to the extent of the correction and don't give in to fear or greed.
In any case, it should go to $1300,000.
BINANCE:BTCUSDT

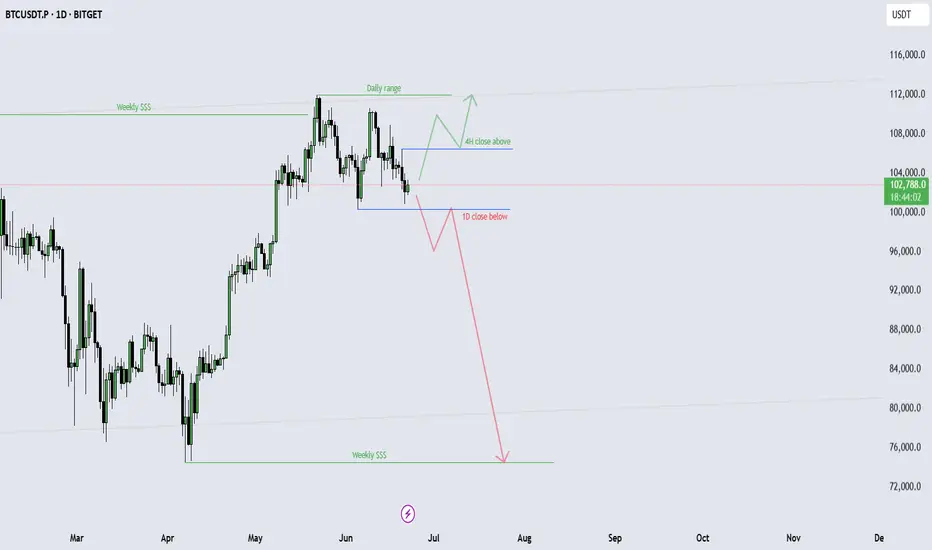
BTCUSDTHello Traders! 👋
What are your thoughts on BITCOIN?
Bitcoin has once again failed to break above its previous high and entered a corrective phase. The price is now moving within a channel and is approaching the lower boundary of that channel.
The correction is expected to continue toward the support zone and the bottom of the channel, where we may see buying interest and a bullish reaction.
If Bitcoin breaks above the channel resistance and key supply zone, it could trigger a strong upward move and lead to new all-time highs.
Key Note:
Price action near the channel support and demand zone will be crucial. A successful rebound from this area may signal the start of the next bullish leg.
Will Bitcoin hold the channel and bounce higher, or is a deeper correction ahead? Share your thoughts below! 🤔👇
Don’t forget to like and share your thoughts in the comments! ❤️

BTC / ETH / SOL / XRP / HYPE: Potential Trend StructuresIn this video, I share my current daily and weekly analysis on the trend structures of BTC, ETH, SOL, XRP, and HYPE, highlighting key support and resistance zones to watch in the coming sessions.
Charts featured in the video:
BTC
ETH
SOL
XRP
HYPE
Thank you for your attention and I wish you successful trading decisions!
If you’d like to hear my take on any other coin you’re tracking feel free to ask in the comments (just don’t forget to boost the idea first 😉).

BTCUSD · 3D — Bearish Divergence + Volume Drop Suggest Pullback
🧠 Setup Overview
Bitcoin is showing signs of exhaustion after a parabolic rally:
Bearish divergence is visible on the 3D RSI — price made higher highs while RSI made lower highs.
Volume is shrinking with each push up, suggesting buyer momentum is fading.
Price is pressing into all-time highs without conviction, signaling potential for a pullback.
🔻 Downside Targets
Target 🎯 Level Why It Matters
Target 1 $92,300 (50% Fib) Midpoint of last impulse + first strong demand area.
Target 2 $82,500 (61.8% Fib) Volume-profile support + key confluence zone.
🔎 What Confirms the Setup?
Breakdown below $108K structure
Daily close below $105K with increasing volume
RSI losing midline support = momentum shift confirmed
❌ Invalidation
Daily close > $112K with strong volume = idea invalid
Would suggest continuation toward blue-sky breakout
✅ Summary
Bearish divergence + volume drop = classic topping signals
Risk is well-defined, with Fib-backed targets offering clean R:R
Trade cautiously — momentum is fading, not gone yet
📛 Disclaimer: This is not financial advice. Do your own research and manage risk according to your plan.
#Bitcoin #BTC #CryptoAnalysis #BearishDivergence #RSI #VolumeProfile #Fibonacci #TradingView

BTCUSD · 3D — Bearish Divergence + Volume Drop Suggest Pullback
🧠 Setup Overview
Bitcoin is showing signs of exhaustion after a parabolic rally:
Bearish divergence is visible on the 3D RSI — price made higher highs while RSI made lower highs.
Volume is shrinking with each push up, suggesting buyer momentum is fading.
Price is pressing into all-time highs without conviction, signaling potential for a pullback.
🔻 Downside Targets
Target 🎯 Level Why It Matters
Target 1 $93,300 (50% Fib) Midpoint of last impulse + first strong demand area.
Target 2 $82,500 (61.8% Fib) Volume-profile support + key confluence zone.
🔎 What Confirms the Setup?
Breakdown below $108K structure
Daily close below $105K with increasing volume
RSI losing midline support = momentum shift confirmed
❌ Invalidation
Daily close > $112K with strong volume = idea invalid
Would suggest continuation toward blue-sky breakout
✅ Summary
Bearish divergence + volume drop = classic topping signals
Risk is well-defined, with Fib-backed targets offering clean R:R
Trade cautiously — momentum is fading, not gone yet
📛 Disclaimer: This is not financial advice. Do your own research and manage risk according to your plan.
#Bitcoin #BTC #CryptoAnalysis #BearishDivergence #RSI #VolumeProfile #Fibonacci #TradingView

Bitcoin's 4-year bullish cycle is coming to an end.The price reversal and manipulation zone could be between $120K and $133K, indicating a big bearish movement.
Quarterly analysis indicates a target of approximately $24,750.
QT + ICT + SMC
- Sainty

BTCUSDTHello Traders! 👋
What are your thoughts on BITCOIN?
In our previous outlook, we anticipated a pullback to the channel bottom followed by a bullish move, and so far, price has followed that scenario perfectly.
Bitcoin is now approaching the channel top and a major resistance zone. At this point, we are watching two potential scenarios:
Scenario 1 – Pullback Before Continuation:
If price rejects the resistance, a correction toward the midline of the channel (which aligns with a key support level) may occur. This could offer a strong entry point for the next bullish wave.
Scenario 2 – Breakout and Retest:
If Bitcoin breaks above the channel and resistance zone, we can look for buy opportunities on the pullback to the broken level, with potential targets at higher levels.
Price action in this area is crucial. Both a midline pullback and a resistance breakout could provide valuable trading setups.
Is Bitcoin gearing up for a breakout, or is another correction coming first? Share your view below! 🤔👇
Don’t forget to like and share your thoughts in the comments! ❤️

BTCUSDT: buy or sell plans for near futureBTCUSDT: buy or sell plans for near future. Very easy and clear setups are shown. Pay attention to the timeframes that I have indicated. You can either buy or sell immediately after close, or wait for pullback to gain more.
Cheers
₿itcoin: Continuing B WaveBitcoin has recently reclaimed the key $106,000 level. Under our primary scenario, we anticipate continued increases into the blue Target Zone between $117,553 and $130,891 – where green wave B is expected to conclude. From that corrective peak, we project a significant move lower in wave C, which should ultimately pull prices into the lower blue Target Zone between $62,395 and $51,323. This range is expected to mark the completion of orange wave a. We then foresee a brief corrective rally before wave (ii) completes its broader correction with a final sell-off.
📈 Over 190 precise analyses, clear entry points, and defined Target Zones - that's what we do.
