TAO Price Prediction 2026. What will be next with Bittensor?If we do end up seeing continued interest in the AI sector overall around the world, and this sector doesn't burst like the NFT sector did, then I'm expecting continued growth (but not colossal gains)! MEXC:TAOUSDT
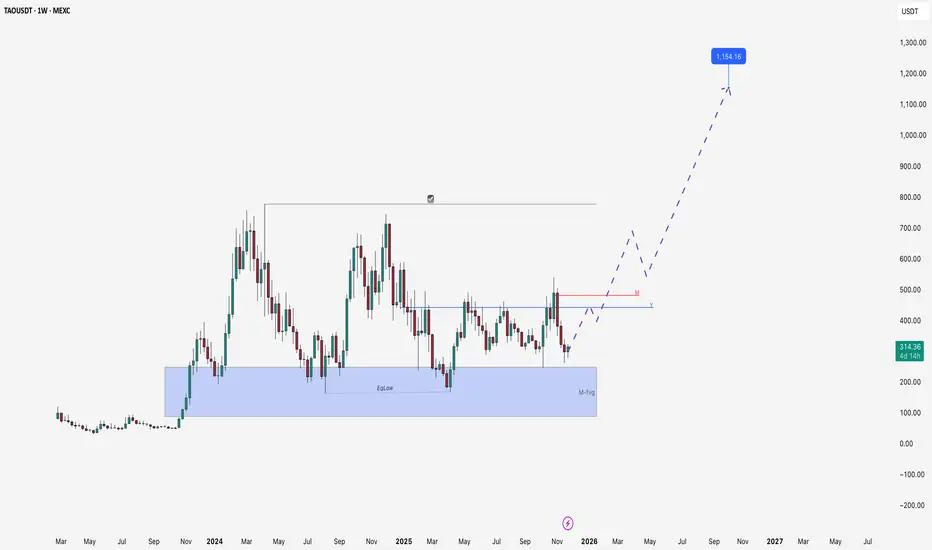
We've been in a simple sideways movement for a year and a half now! Essentially, since the listing, it's been following the usual model but on higher timeframes—
impulse - sideways - and there should be another impulse.
Then, in a bearish trend (which will be deeper than the current correction), and once the hype around artificial intelligence fades, we'll see a close and a price retracement back to the levels of first taking out the eqlow and then filling the monthly FVG! At this stage, in December, it would be great to see a test of the yearly open, followed by continuation to taking out the highs and movement toward that indicated price target!
Thanks for supporting this idea
Bittensorsignals
FireHoseReel | TAO: Breakout Loading Don’t Be Late This Time🔥 Welcome FireHoseReel !
Let’s break down what’s happening with TAO (Bittensor) right now.
👀 TAO – Price Action Overview
After the recent drop, TAO has formed a strong support at $267.6. From this level, buy volume increased and price started pushing upward toward its resistances. Along the way, TAO managed to break several multi-timeframe resistances, showing that seller pressure has weakened and buyers are stepping in more confidently.
Our long trigger is at $310, and a clean breakout above this level can give us a valid long setup.
📊 Volume Analysis
Following the recent declines, TAO’s volume temporarily dropped. However, during the last sell-off, buy volume noticeably increased, causing a sharp move and breaking the $310 support earlier.
For a proper breakout this time, we need strong buy volume to trigger a short squeeze above the resistance zone.
✔️ Price Behavior Near Resistance
TAO is currently interacting with this resistance for the first touch, which often leads to rejection.
Better long setups typically form after the second touch and onward, when buyers show stronger control and volume convergence improves.
🔗 TAO/BTC Pair Perspective Looking at the TAO/BTC pair, price is approaching a key resistance zone sitting at the top of its previous trading range.
A breakout above this level can create a high-momentum move, especially if Bitcoin dominance rises.
This alignment increases the probability of continuation on the TAO/USDT pair as well.
✍️ Long Scenario
A long setup becomes valid if the following conditions align:
• Breakout above $310
• Increase in Bitcoin dominance (BTC.D)
• Decrease in USDT dominance (USDT.D)
• Strong buy volume and clean multi-timeframe volume convergence
• Ideally entering after the second touch into resistance
If these conditions are met, the long scenario becomes much stronger and more reliable.
🛞 Risk Management & Disclaimer
Please remember to always use proper risk management and position sizing. Nothing in this analysis is financial advice. The market can change quickly, so always trade based on your own strategy, research, and risk tolerance. You are fully responsible for your own trades.

Bittensor (TAO)📊 General Overview of the Analysis
TAO coin, after being listed, initially moved downward within a descending channel. Upon breaking out above the channel, the price experienced an upward rally to its previous peak but then entered another descending channel.
🕰 Daily Timeframe Analysis
🔸 Current Status: After the upward movement, the price has entered a consolidation range (yellow zone).
🔸 Fake Move: The drop below this range suggests seller weakness.
🔸 Forecast: Breaking above the yellow zone could propel TAO to higher levels.
⏰ 4-Hour Timeframe Analysis
🔹 After rebounding from the top of the descending channel, the price responded positively to the midline and rose again.
🔹 Expected Movement: There’s potential for breaking out of the descending channel from the top.
🔹 Suggested Entry Point:
A confirmed price stabilization above the red zone can signal a secure entry.
🎯 Price Targets (Fibonacci Levels)
🔹 1.618
🔹 2.618
📈 RSI Indicator Analysis
🔸 On the daily timeframe, RSI is positioned in an ascending channel.
🔸 Forecast: A breakout above the midline of this ascending RSI channel could offer an early entry signal for TAO.
📝 Conclusion and Final Note
Technical analysis indicates that TAO has significant potential for further upward movement. Stabilization above the red zone and movement toward Fibonacci targets highlight the coin's appeal for long-term trades.
💡 Advice: Always employ risk management and incorporate your personal analysis into decision-making.
💡 Reminder: This analysis is for educational purposes only and should not be considered as financial advice.

TAOUSDT Strong buy signal above the 1D MA50Bittensor (TAOUSDT) has been trading within a Channel Up pattern since November 20 2023. Both of its Higher Lows have been formed on the 1D MA100 (green trend-line) with the latest being on March 30.
Today the price broke above the 1D MA50 (blue trend-line) for the first time in 2 weeks (since March 26). If the candle closes above it, we expect that to be the start of the new Bullish Leg to a Higher High, similar to the January 24 break-out. Our target is 1800 (+295.98% from the Low, similar to the previous Bullish Leg).
-------------------------------------------------------------------------------
** Please LIKE 👍, FOLLOW ✅, SHARE 🙌 and COMMENT ✍ if you enjoy this idea! Also share your ideas and charts in the comments section below! This is best way to keep it relevant, support us, keep the content here free and allow the idea to reach as many people as possible. **
-------------------------------------------------------------------------------
💸💸💸💸💸💸
👇 👇 👇 👇 👇 👇

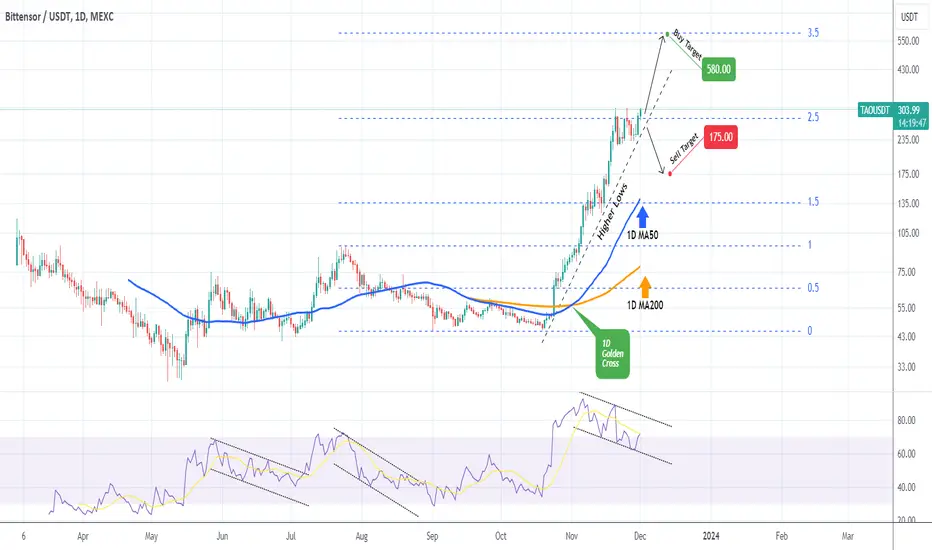
TAOUSDT If this line holds, it can reach $580.00Bittensor (TAOUSDT) is on a remarkable parabolic rally since the October 19 bottom, supported by a Higher Lows trend-line. Below that, is the natural technical Support, the 1D MA50 (blue trend-line). Technically every bullish leg of TAO during this run targets the +0.5 Fibonacci interval, where it consolidates until the next rally to the +0.5 Fib. As you can see, the first consolidation was on the 1.5 Fib, then the 2.5 Fib, where it currently trades sideways.
As long as the Higher Lows trend-line holds, we will target the 3.5 Fib extension at $580. If the Higher Lows trend-line breaks, we will take the loss and target a potential contact with the 1D MA50, with current projection estimates putting a target at $175.00 (but can change as the 1D MA50 rises).
-------------------------------------------------------------------------------
** Please LIKE 👍, FOLLOW ✅, SHARE 🙌 and COMMENT ✍ if you enjoy this idea! Also share your ideas and charts in the comments section below! This is best way to keep it relevant, support us, keep the content here free and allow the idea to reach as many people as possible. **
-------------------------------------------------------------------------------
💸💸💸💸💸💸
👇 👇 👇 👇 👇 👇