BOME Reclaim Attempt After Descending Channel BreakBOME spent an extended period trading inside a well-defined descending channel following a sharp sell-off. Price has now broken above the lower channel boundary and is attempting to reclaim structure, signaling a potential shift from pure continuation to a recovery phase.
Currently, price is holding above the recent local support zone around zero point zero zero zero six three. As long as this level is defended, upside continuation toward the mid and upper channel resistance becomes possible, with the next major resistance sitting near zero point zero zero zero eight one.
If price fails to hold this reclaimed area and slips back below the recent support, the move would be classified as a failed reclaim, and continuation toward lower demand zones remains likely.
This setup is driven by descending channel dynamics, support reclaim behavior, and post-break stabilization. Confirmation above reclaimed structure is required before stronger continuation.
BOME

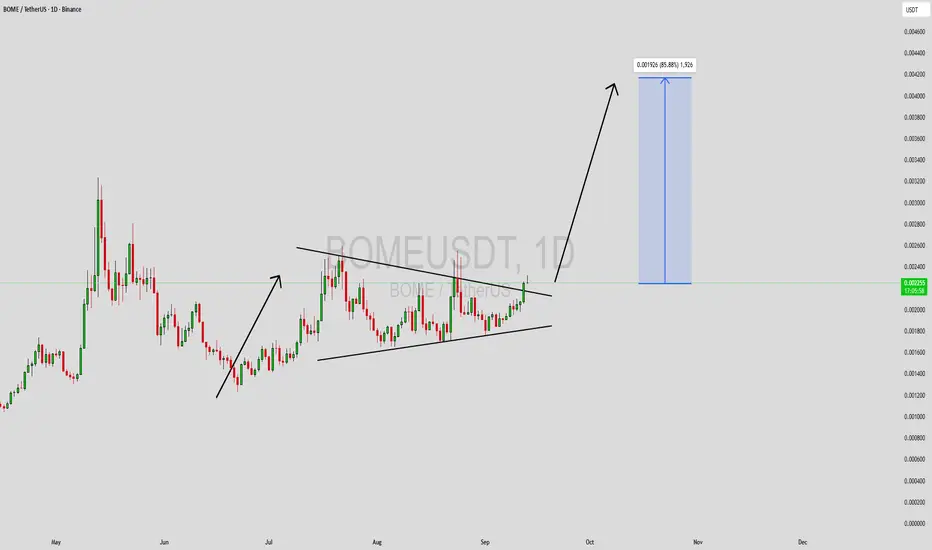
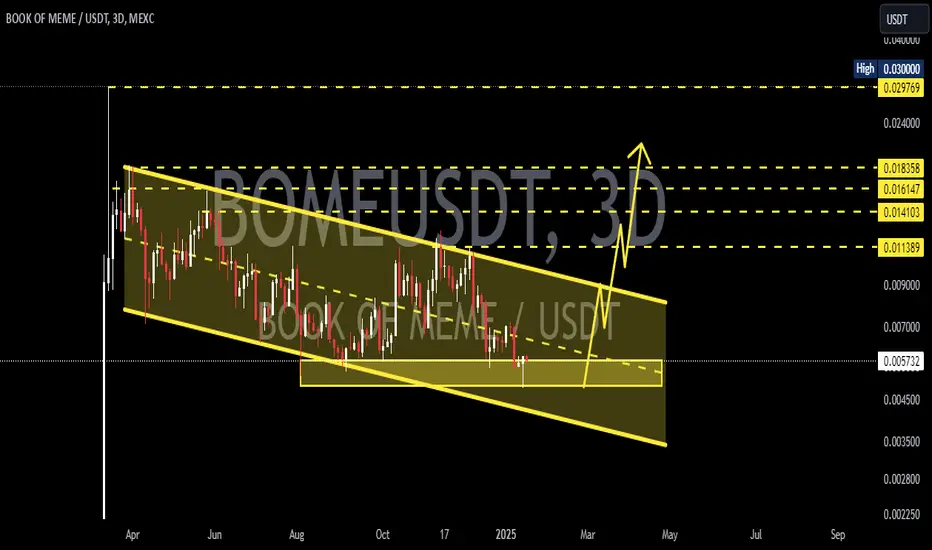
BOMEUSDT Forming Bullish PennantBOMEUSDT is currently forming a bullish pennant pattern, which often signals continuation of upward momentum after a strong rally. This consolidation phase, combined with steady trading volume, reflects investor confidence and positions the pair for a potential breakout to the upside. Market participants are increasingly taking interest, making this setup attractive for both traders and investors.
The bullish pennant structure suggests that BOMEUSDT could gain strength once resistance is cleared, opening the path for a sharp upward move. Technical indicators are aligned with this view, as price action is holding above key support levels while showing signs of accumulation. A breakout confirmation would likely accelerate momentum, attracting more buyers into the market.
With an expected gain projection of 70% to 80%+, this setup offers a favorable risk-to-reward ratio. Traders watching BOMEUSDT will be focused on upcoming candles to confirm bullish continuation. If momentum sustains, the pair could see strong upside performance in the short to medium term.
✅ Show your support by hitting the like button and
✅ Leaving a comment below! (What is You opinion about this Coin)
Your feedback and engagement keep me inspired to share more insightful market analysis with you!
BOOK OF MEME · Leverage vs Spot · Should I Plan or Not?With the log chart we can focus on growth potential, the all-time high, highs and lows, the bigger picture, the chart structure and long-term cycles.
With the linear chart, we can know the truth of a pair. Are we looking at a cycle top or bottom prices?
BOMEUSDT (BOOK OF MEME) is bullish based on current price action and trading volume.
Looking at this linear chart, it is easy to see BOME consolidating sideways after hitting bottom. It is easy to see a major cycle (left), a major crash and then the market going sideways.
If I were to show a log chart, the action after February would be really pronounced and you would see lots of bullish and bearish moves. These are indeed happening but are minimum—small—compared to how the market actually moves. Market noise.
If I were to focus on the short-term, I would have to become Nostradamus in order to be able to predict the next move.
If I focus on the long-term as I usually do, I can easily predict what is going to happen next.
As a group, we cannot beat the market because we are the market; but, there is no need to "beat" the market, we only need to make money and there are many ways to make money; choose what works for you. We choose low risk vs a high potential for reward.
We choose simplicity and a strategy that works. Literally, just buy and hold.
I understand leverage (margin) and I use it of course, but I cannot cry if I incur a major loss. I cannot cry, blame and complain if things go wrong; why? Because before making the first purchase, the first move; before making a decision or any trade, the first thing to consider, adapt and accept, is the fact that all money can be gone in a flash, that's the thing about leverage trades. If things go right, you get to win big but, if things go wrong, you get to lose everything... Not really, if you control your position size your risk is limited.
Ok. Asymmetric risk/reward. Maximum 5% out of the risky trading capital goes on a single trade. It can be 3% or even 2% or 1%.
If you can't make money slow, you won't be able to make it fast. Making money is an art and trading is the same. It is a craft, a profession, a job, a career; call it what you want, but it takes effort, and, since there are so many smart people doing the same, we have to be smart when we decide to participate.
How can I be smart when trading?
Build a plan before taking action.
I love you. I am literally feeling true love right now as I write this, I hope it reaches you.
Thanks a lot for your continued support, it is appreciated.
Namaste.

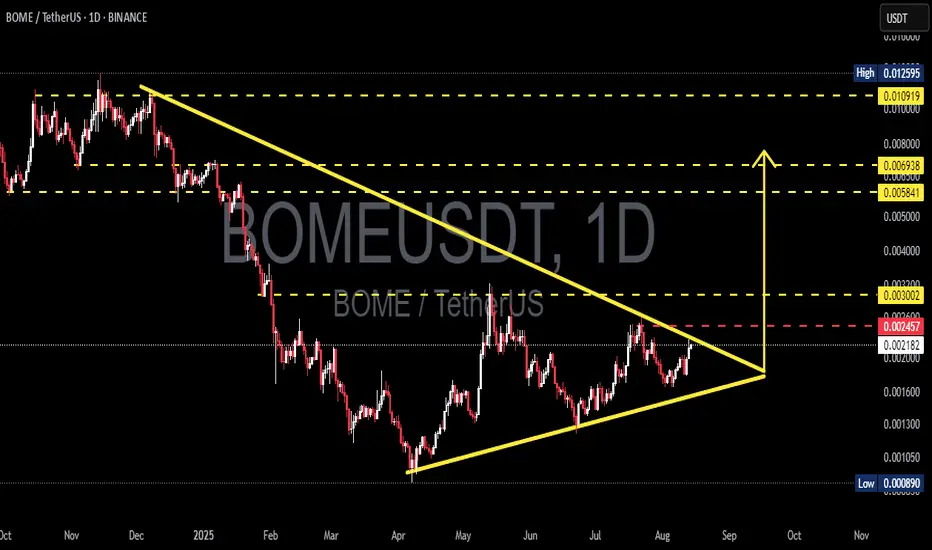
BOME/USDT — Symmetrical Triangle on the Verge of a Explosion?BOME/USDT has spent the past several months moving inside a Symmetrical Triangle pattern, formed by a series of lower highs from the peak around 0.0125 and higher lows from the April 2025 bottom at 0.000890.
This formation signals a major consolidation phase where buying and selling pressure are converging toward a single decision point (apex).
When price action approaches the tip of such a triangle, it often results in a volatility surge — either to the upside (breakout) or downside (breakdown).
Currently, price is testing the critical 0.00245–0.00255 zone, which will act as the gateway to the next major move.
---
Key Levels to Watch
Major Resistance:
0.00245–0.00255 → Upper trendline + horizontal resistance.
0.003002 → Initial breakout target & historical resistance.
0.005841–0.006938 → Strong supply zone from the previous rally.
0.010919 → Psychological target before the peak.
0.012595 → Main chart high.
Key Support:
0.00205–0.00215 → Rising trendline (dynamic support).
0.00170–0.00130 → Minor historical supports.
0.000890 → Yearly low and major support.
---
Pattern Characteristics
The Symmetrical Triangle is a neutral formation typically accompanied by:
Declining volume during consolidation.
Strong volume expansion upon breakout.
Initial move targets often equal the height of the triangle from the breakout point — providing significant upside/downside room.
---
Bullish Scenario
1. Breakout Confirmation: Daily close above 0.00255 with strong volume.
2. First Target: 0.003002.
3. Next Target: Sustained momentum → 0.00584–0.00694.
4. Extended Target: Breaking through the supply zone could drive price to 0.0109–0.0126.
5. Invalidation: Price re-enters the triangle and closes below 0.00220–0.00215.
---
Bearish Scenario
1. Rejection: Failure to break 0.00255 followed by a daily close below 0.00215.
2. Downside Target: 0.00200 → 0.00170–0.00130.
3. Breakdown Risk: A move below the rising trendline could trigger a retest of 0.000890.
4. Invalidation: Price reclaims 0.00245 and holds.
---
Trading Notes
Long consolidations like this often precede sharp moves — patience is key.
Wait for confirmation: Avoid entering prematurely; look for a clear breakout with volume.
Reward/Risk potential is attractive for swing traders in this setup.
#BOME #BOMEUSDT #Crypto #Altcoin #PriceAction #SymmetricalTriangle #Breakout #SupportResistance #ChartPattern #CryptoAnalysis
The meme coin you must haveHello friends🙌
Given the decline we had, you can see that the price has exited the descending channel and entered the ascending channel. Now we can buy in steps with capital and risk management.
Follow us for more signals🔥
*Trade safely with us*

0.002198-0.002671 The key is whether it can break above
Hello, traders.
If you "Follow", you can always get new information quickly.
Have a nice day today.
-------------------------------------
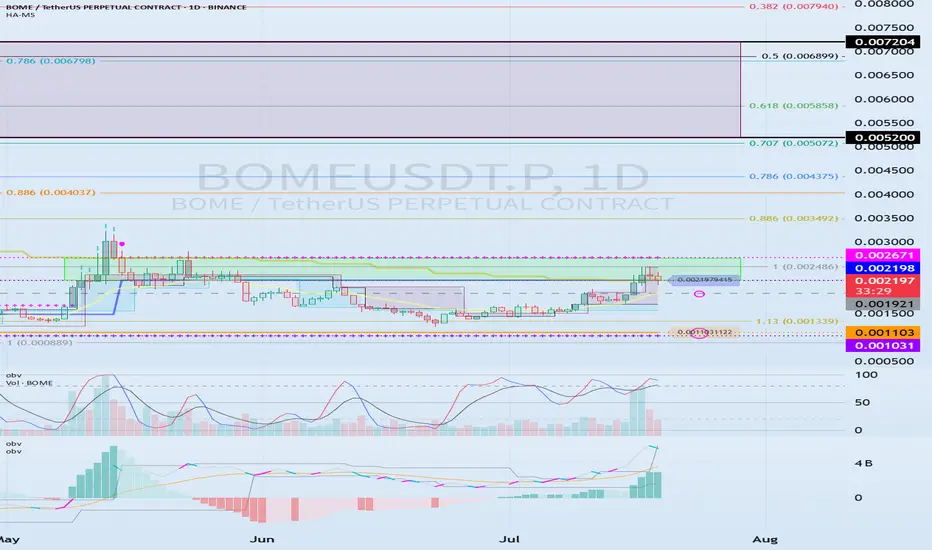
(BOMEUSDT.P 1D chart)
BOME is a BOOK OF MEME, which is a meme coin and belongs to the Solana Ecosystem.
If the price breaks through the 0.002198-0.002671 section upward and maintains, it is expected to rise to around 0.005200-0.007204.
As a condition for this,
- The K of the StochRSI indicator should show an upward trend with K > D below the overbought section.
- The PVT-MACD oscillator indicator should show an upward trend. (If possible, it should be above the 0 point.)
- The OBV indicator of the Low Line ~ High Line channel should show an upward trend. (If possible, it should be above the High Line. It should maintain a state where at least OBV > OBV EMA.)
When the above conditions are met, if the 0.002198-0.002671 section breaks through upward, it is expected to continue the upward trend.
If not and it falls, you should check if it is supported near 0.001921.
This is because I think that the upward trend can continue if it receives support near the 0.001921 point, which is the volume profile section.
Therefore, if it falls below 0.001921, you should stop trading and watch the situation.
You can trade with a SHORT position in futures trading, but since it falls below the volume profile section, you should be aware of the volatility.
Therefore, if you insist on trading, a short and quick response is required.
-
(15m chart)
The trading method is simple.
Buy near DOM(-60) ~ HA-Low, and sell near HA-High ~ DOM(60).
However, if it falls from DOM(-60) ~ HA-Low, it is likely to show a stepwise downtrend, and if it rises from HA-High ~ DOM(60), it is likely to show a stepwise uptrend.
Therefore, you should maximize your profits by taking a split transaction format.
Other indicators can be used as points where you can conduct split transactions depending on the situation.
That is, sell about 25% at the support and resistance points drawn on the 1M, 1W, and 1D charts, and sell about 10% at the support and resistance points on the 15m chart to maximize your profits.
While conducting transactions in this manner, you may wonder if you can actually drag the transaction to around 0.005200-0.007204, but it is possible.
It is good to hold to make a big profit, but since the current price range is in the support and resistance range, I think it is an unstable range to just hold.
-
Thank you for reading to the end. Wishing you a successful trade.
--------------------------------------------------
BOMEUSDT 1DBOME ~ 1D Analysis
#BOME This trade is very high risk. Buy gradually from here with a short -term target of at least 10%+.

Did we hit the bottom on BOME? Is it time for a rise to 0.0105?Currently, on BOME, Smart Money has created an equality pattern AB=CD.
Point C is at the 68.8 Fibonacci level of wave AB.
Point D is at the 127.2 Fibonacci level of wave AB.
Additionally, on the D1 timeframe, we have a trend reversal candle.
At the moment, the price should bounce upwards to the 61.8 retracement level of wave AD, which is around 0.0105$.

BOMEUSDT 3DBOME ~ 3D
#BOME This trade is very high risk. But if you still have Conviction on this coin,. This support block is very attractive to start buying back,.
$BOME vs. $PEPE ECONOMICS:BOME vs. CRYPTOCAP:PEPE
here we go..
300 days...
if only if magic happen..
let it go...

06.01.2025 - Will BOME drop to the FVG to launch the rocket?Current Situation on BOME:
1) Accumulation Zone:
We were in a large accumulation zone (marked in blue) – someone was loading bags before the move.
2) Breakout of the Accumulation Zone:
The accumulation zone was broken, and stop losses were collected (marked with the line labeled $$$) because many traders shorting placed their stop losses there.
3) Double Top Setup:
During the stop loss collection, a strong DOUBLE TOP setup was formed. Many traders seeing such a setup start shorting and place their stop losses above the DOUBLE TOP.
4) BTC Influence:
Something interesting happened here: BTC started pumping upward, so BOME followed. What was the goal? Obviously, to collect liquidity – taking money from stop losses.
5) Important Detail:
The price collected stop losses only with the wick and closed below the DOUBLE TOP. My guess is that after this brief breakout of the DOUBLE TOP, many traders initiated long positions – after all, it seemed we were heading "to the moon." However, I suspect this is a manipulation. Those who opened longs likely set their stop losses below the last low (the so-called Higher Low).
Possible Scenario to Watch:
6) Liquidity Below HL:
If the breakout in point 5 was manipulation, we should drop at least to the HL to collect the liquidity below it.
7) Change of Character (ChoCh):
If we drop below the ChoCh (Change of Character) and then briefly move upward above that level to collect at least one Inducement (i.e., liquidity from local shorts – this liquidity acts as fuel), we would have a clear path for further declines.
8) Target Below Accumulation Zone:
At this stage, we need to consider where the price might fall. The best spot would be below the accumulation zone, where there is a lot of $$$ to grab. Additionally, collecting liquidity from the lower side would provide another strong confirmation for future upward movement. This confirmation is called a Double Purge – wiping out both shorts (point 2) and longs. This collects all the available money.
9) FVG Zone:
If we drop below the accumulation zone and collect stop losses, we will be close to the area containing the last FVG (Fair Value Gap). Closing part of this gap (or the entire gap) would serve as another confirmation that it’s time to launch the rocket.
Important Note:
For points 7, 8, and 9 to occur, favorable conditions on BTC will be necessary.

BOME vs PEPE - GMMA indicatorIn today’s update, I would like to discuss the comparison of GMMA indicator behavior on BOME in relation to what the GMMA indicator showed in the past on PEPE.
The comparative analysis revealed that on both PEPE and BOME:
We observe a local peak both in the price and on the GMMA indicator (the first blue drawn line on both GMMA indicators).
A local trough both in the price and on the GMMA indicator (the second blue drawn line on both GMMA indicators).
A local peak in the price and a peak on the GMMA indicator (the third blue drawn line on both GMMA indicators) – the peak on the indicator is lower than the previous peak marked in step one.
A local trough in the price and a trough on the GMMA indicator (the fourth blue drawn line on both GMMA indicators) – the trough on the indicator is higher than the previous peak marked in step one.
An upward move on the indicator to the orange average and a temporary shift to green, followed shortly by another significant drop below the orange average.
On PEPE, in step 6, we observe the final breakout above the orange average and the indicator turning green. This point was a high-quality moment to invest in PEPE.
On BOME, I anticipate a similar breakout above the orange average on the indicator and a color change from red to green.
From this point, dynamic increases should begin, reaching up to the 261.8 level measured from the global decline (from the March peak to the August trough).
The 261.8 level is around $0.068–$0.069.
Currently, BOME is consolidating around the maximum range of the corrective move driving the uptrend. It looks like an accumulation phase before a potential dynamic increase

BOME Long ideaAn idea for entering a long position on BOME.
If BOME drops to the upper boundary of the ORDER BLOCK zone (1-hour interval) and the area where we have 50% of an unfilled Fair Value Gap (FVG from the 15-minute interval), this would be a good spot to trigger a long position:
Entry: 0.00585
Stop Loss: 0.005427
Take Profit: 0.068 (Zone near the 261.8 external Fibonacci retracement level of the entire downward move)"

BOMEUSDT 3DBOME ~ 3D
#BOME Still rejected from the resistance line of this pattern. If you still have Conviction on this coin,. This support block would be a very good buying place for now,. With a minimum target of 20%++

BOME to the athBOME is one of MEME coins, alt season is here and meme should go like every alt season. TA and PA is bullish
NOT A FINANCIAL ADVICE
ALWAYS USE STOPLOSS AND MANAGE YOUR RISK

BOME Long Spot Trade (Potential Trend Reversal)Market Context:
BOME has shown signs of a potential upward trend after reclaiming its 21-week EMA. The memecoin sector's recent growth could further support this setup, providing a strong risk-to-reward opportunity.
Trade Setup:
Entry Zone: Around $0.009
Take Profit Targets:
First target: $0.012
Second target: $0.016
Third target: $0.020
Stop Loss: Daily close below $0.007
This trade seeks to capitalize on the recent EMA reclaim and the potential for upside in the memecoin sector.

BOMEUSDT - Targeting a 200% UpsideBOME/USDT has been quietly consolidating on the hourly chart, showing signs of building a strong base for a potential breakout. This calm phase often precedes significant moves, and the current setup looks like an opportunity to capture a major rally.
Why This Trade?
Consolidation Zone: The price has been stabilizing within a narrow range, suggesting that sellers are losing momentum, and a breakout could be imminent.
Volume Dynamics: While volumes remain steady, any uptick in activity could signal the beginning of a new bullish phase.
Risk-Reward Balance: With a target of +200%, this trade offers an excellent potential reward for calculated risk.
This setup is not about rushing into the market but about positioning strategically for the next big move. As always, patience and discipline will be key to letting the trade play out successfully. Let’s see how BOME performs! 🚀
dyor

BOME falling wedge breakout soon!A 1-2 , 1-2 scenario for bome this breakout will be massive. Bome is sidelined to be bearish for atleast 200 days and this is the waiting game for now. breakout is imminent!!

BOME is now bullishIt seems that an ABC with terminal C is over and the price has entered a bullish phase.
The best range for Rebuy is the green range.
If the price returns to the green range, we will look for buy/long positions
Closing a daily candle below the invalidation level will violate the analysis.
For risk management, please don't forget stop loss and capital management
Comment if you have any questions
Thank You

Book of Meme BOME price looks "tasty"#BOME is another #Solanamemcoin that looks good.
It's a little expensive now, but if the price of OKX:BOMEUSDT drops to at least 0.0077-0.0081, it will be just right to take a “tasty” long.
🔝 And the prospects for #BOOKofMeme price growth are at least +250-300%.
_____________________
Did you like our analysis? Leave a comment, like, and follow to get more

BOME Long Position (Retest of 21-day EMA)Market Context: BOME is approaching the 21-day EMA after a Market Structure Shift (MSS). We're looking for a retest of the trend to form a higher low, while sweeping liquidity at the $0.075 level. This provides a potential opportunity for entry.
Trade Setup:
Entry: $0.007 - $0.008
Take Profit:
First target: $0.012
Second target: $0.016
Third target: $0.020
Stop Loss: Daily close below $0.006
This setup seeks to capture the bounce from the higher low, capitalizing on the anticipated continuation of the uptrend. #BOME #Crypto #MarketStructure #21EMA #Trading

BOME at key levelBINANCE:BOMEUSDT
Bome has gone up in a 5-waves move, Leading Diagonal Pattern, and retrace to the key level of 78.6% Fibonacci Retracement, it is on the exact place where you should expect a bounce. And after 5 loosing days, it seems like we are making a bullish Harami Candlestick. Risk-Reward ratio is huge here.

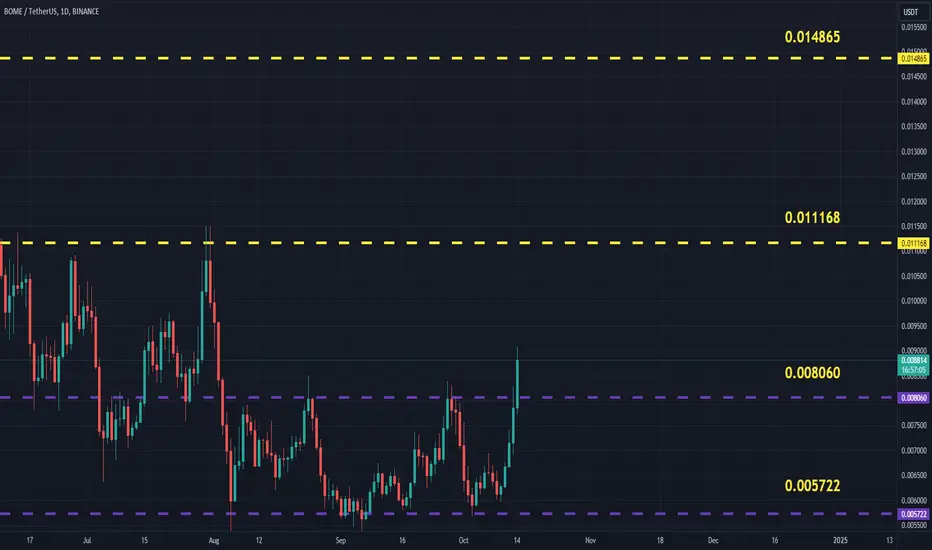
BOMEUSDT (BOOKOFMEME) Updated till 14-10-24BOMEUSDT (BOOKOFMEME) Daily timeframe range. meme coins got good potential in next run if retail interest keeps up. now in here it got out of 0.008060 if PA can defend 0.008060 that can push it to 0.011168.