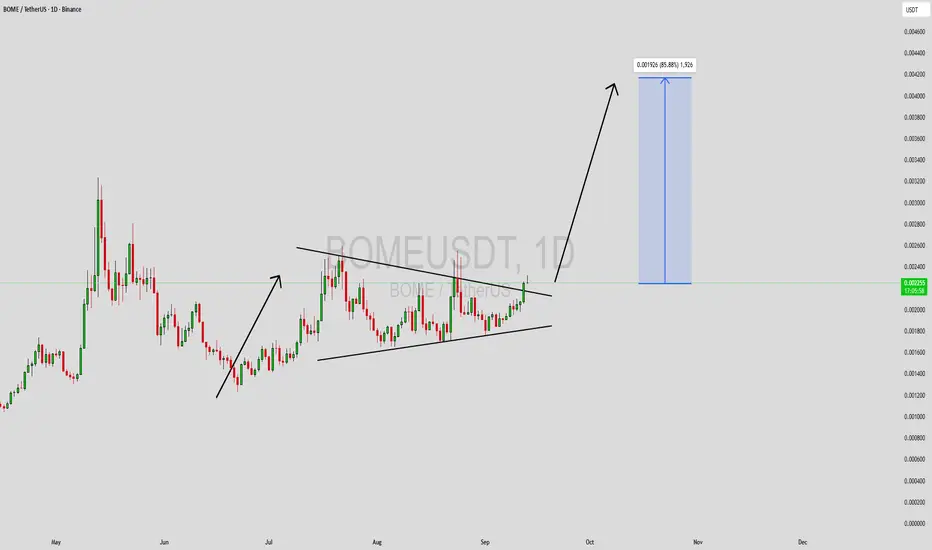
BOMEUSDT Forming Bullish PennantBOMEUSDT is currently forming a bullish pennant pattern, which often signals continuation of upward momentum after a strong rally. This consolidation phase, combined with steady trading volume, reflects investor confidence and positions the pair for a potential breakout to the upside. Market participants are increasingly taking interest, making this setup attractive for both traders and investors.
The bullish pennant structure suggests that BOMEUSDT could gain strength once resistance is cleared, opening the path for a sharp upward move. Technical indicators are aligned with this view, as price action is holding above key support levels while showing signs of accumulation. A breakout confirmation would likely accelerate momentum, attracting more buyers into the market.
With an expected gain projection of 70% to 80%+, this setup offers a favorable risk-to-reward ratio. Traders watching BOMEUSDT will be focused on upcoming candles to confirm bullish continuation. If momentum sustains, the pair could see strong upside performance in the short to medium term.
✅ Show your support by hitting the like button and
✅ Leaving a comment below! (What is You opinion about this Coin)
Your feedback and engagement keep me inspired to share more insightful market analysis with you!
Bomesignals
BOMEUSDT Forming Bullish PennantBOMEUSDT is currently shaping a bullish pennant pattern, which typically indicates a period of consolidation before the next strong upward move. This pattern, combined with rising trading volume, highlights growing momentum and increased interest from market participants. If confirmed, this setup could drive a powerful breakout rally, with expected gains ranging between 70% to 80%+, making it an attractive opportunity for traders seeking high-potential setups.
The price action suggests that BOMEUSDT has been steadily building strength, with buyers maintaining control and supporting higher lows. A breakout above the pennant’s resistance could open the door to rapid upward movement, especially with volume confirming the momentum shift. Such formations are often seen as strong continuation signals, reflecting renewed confidence in the asset’s upside potential.
Investor sentiment around BOMEUSDT is also improving, with heightened interest suggesting strong demand in upcoming sessions. As more traders recognize the bullish technical pattern and increasing participation, the pair could capture even greater traction in the market. This aligns with the overall expectation that BOMEUSDT may deliver significant gains in the short to mid-term if momentum continues.
✅ Show your support by hitting the like button and
✅ Leaving a comment below! (What is You opinion about this Coin)
Your feedback and engagement keep me inspired to share more insightful market analysis with you!

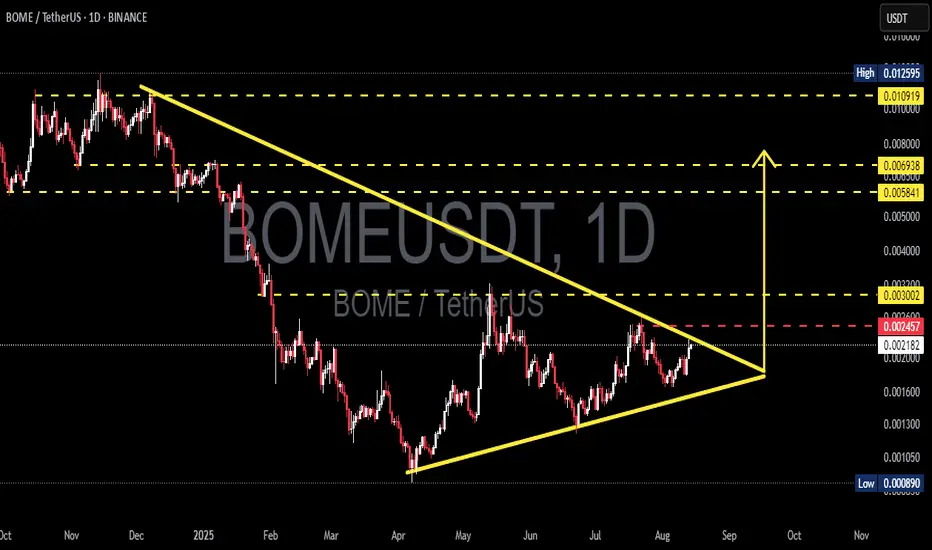
BOME/USDT — Symmetrical Triangle on the Verge of a Explosion?BOME/USDT has spent the past several months moving inside a Symmetrical Triangle pattern, formed by a series of lower highs from the peak around 0.0125 and higher lows from the April 2025 bottom at 0.000890.
This formation signals a major consolidation phase where buying and selling pressure are converging toward a single decision point (apex).
When price action approaches the tip of such a triangle, it often results in a volatility surge — either to the upside (breakout) or downside (breakdown).
Currently, price is testing the critical 0.00245–0.00255 zone, which will act as the gateway to the next major move.
---
Key Levels to Watch
Major Resistance:
0.00245–0.00255 → Upper trendline + horizontal resistance.
0.003002 → Initial breakout target & historical resistance.
0.005841–0.006938 → Strong supply zone from the previous rally.
0.010919 → Psychological target before the peak.
0.012595 → Main chart high.
Key Support:
0.00205–0.00215 → Rising trendline (dynamic support).
0.00170–0.00130 → Minor historical supports.
0.000890 → Yearly low and major support.
---
Pattern Characteristics
The Symmetrical Triangle is a neutral formation typically accompanied by:
Declining volume during consolidation.
Strong volume expansion upon breakout.
Initial move targets often equal the height of the triangle from the breakout point — providing significant upside/downside room.
---
Bullish Scenario
1. Breakout Confirmation: Daily close above 0.00255 with strong volume.
2. First Target: 0.003002.
3. Next Target: Sustained momentum → 0.00584–0.00694.
4. Extended Target: Breaking through the supply zone could drive price to 0.0109–0.0126.
5. Invalidation: Price re-enters the triangle and closes below 0.00220–0.00215.
---
Bearish Scenario
1. Rejection: Failure to break 0.00255 followed by a daily close below 0.00215.
2. Downside Target: 0.00200 → 0.00170–0.00130.
3. Breakdown Risk: A move below the rising trendline could trigger a retest of 0.000890.
4. Invalidation: Price reclaims 0.00245 and holds.
---
Trading Notes
Long consolidations like this often precede sharp moves — patience is key.
Wait for confirmation: Avoid entering prematurely; look for a clear breakout with volume.
Reward/Risk potential is attractive for swing traders in this setup.
#BOME #BOMEUSDT #Crypto #Altcoin #PriceAction #SymmetricalTriangle #Breakout #SupportResistance #ChartPattern #CryptoAnalysis
The meme coin you must haveHello friends🙌
Given the decline we had, you can see that the price has exited the descending channel and entered the ascending channel. Now we can buy in steps with capital and risk management.
Follow us for more signals🔥
*Trade safely with us*

BOMEUSDT 1DBOME ~ 1D Analysis
#BOME This trade is very high risk. Buy gradually from here with a short -term target of at least 10%+.

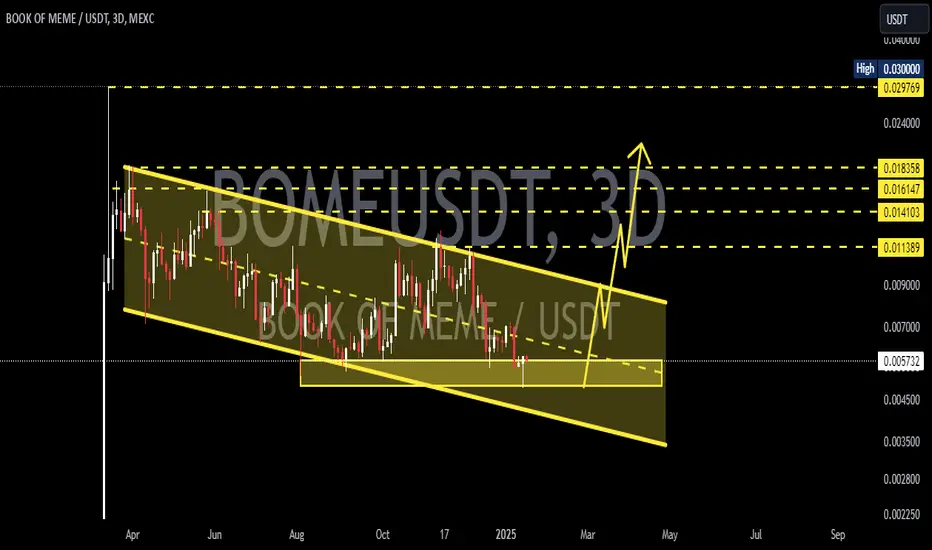
BOMEUSDT 3DBOME ~ 3D
#BOME This trade is very high risk. But if you still have Conviction on this coin,. This support block is very attractive to start buying back,.
BOMEUSDT 3DBOME ~ 3D
#BOME Still rejected from the resistance line of this pattern. If you still have Conviction on this coin,. This support block would be a very good buying place for now,. With a minimum target of 20%++

BOMEUSDT - Targeting a 200% UpsideBOME/USDT has been quietly consolidating on the hourly chart, showing signs of building a strong base for a potential breakout. This calm phase often precedes significant moves, and the current setup looks like an opportunity to capture a major rally.
Why This Trade?
Consolidation Zone: The price has been stabilizing within a narrow range, suggesting that sellers are losing momentum, and a breakout could be imminent.
Volume Dynamics: While volumes remain steady, any uptick in activity could signal the beginning of a new bullish phase.
Risk-Reward Balance: With a target of +200%, this trade offers an excellent potential reward for calculated risk.
This setup is not about rushing into the market but about positioning strategically for the next big move. As always, patience and discipline will be key to letting the trade play out successfully. Let’s see how BOME performs! 🚀
dyor

BOMEUSDT - The Next Memecoin Rocketing on the Solana Wave!BOMEUSDT, the trending memecoin on the Solana blockchain, is capturing attention as Solana itself starts to surge. With a breakout on the horizon, this coin is poised for a potential trend change that could lead to significant gains. As the Solana ecosystem heats up, all eyes are on BOMEUSDT.
Now's the time to watch for key resistance levels—if they break, we could see explosive movement. Stay tuned and be ready to ride this wave, but remember to manage your risk!
BOMEUSDT Currently trading at $0.0081
Buy level: Above $0.0082
Stop loss: Below $0.0067
TP1: $0.0099
TP2: $0.011
TP3: $0.014
TP4: $0.018
Max Leverage 3x
Follow Our Tradingview Account for More Technical Analysis Updates, | Like, Share and Comment Your thoughts

BOMEUSDTBOME ~ 1D
#BOME This green gem meme is moving in a descending channel for now.
We have Conviction on this green gem which will performance when the bulls have returned.
Perhaps small gradual buying is very attractive in this descending channel, bulls will be in control when this descending channel is successfully broken.

BOOK OF MEME (BOME) a setup for upto 27% pumpHi dear friends, hope you are well and welcome to the new trade setup of BOOK OF MEME (BOME) with US Dollar pair.
Recently we caught almost 20% pump of BOME as below:
Now on a 4-hr time frame, BOME is completing the final leg of a bullish Gartley move for the next price reversal.
Note: Above idea is for educational purpose only. It is advised to diversify and strictly follow the stop loss, and don't get stuck with trade.

BOMEUSD 1WBOME ~ 1D
#BOME The sleeping green gem will wake up again after successfully breaking through the resistance line of this pattern.
Buy after breaking through this resistance line, with a minimum target of 20%+

BOOK OF MEME (BOME) completed a setup for upto 15.50% pumpHi dear friends, hope you are well and welcome to the new trade setup of BOOK OF MEME (BOME) with US Dollar pair.
Recently we caught almost 20% pump of BOME as below:
Now on a 2-hr time frame, BOME has formed a bullish Gartley move for the next price reversal.
Note: Above idea is for educational purpose only. It is advised to diversify and strictly follow the stop loss, and don't get stuck with trade.

BOME / BOMEUSDTGood Luck >>
• Warning •
Any deal I share does not mean that I am forcing you to enter into it, you enter in with your full risk, because I'll not gain any profits with you in the end.
The risk management of the position must comply with the stop loss.
(I am not sharing financial or investment advice, you should do your own research for your money.)

BOMEUSD 12HBOME ~ 12H
#BOME We will start making purchases gradually after ECONOMICS:BOME successfully breaks through the Block Line. This resistance line with a minimum target of 10%+

Exciting news for BOME lovers! BOOK OF MEMEThis chart suggests there might be a potential surge in the value of $COINEX:BOMEUSDT!
While the chart itself is easy to understand, it's important to do your own research before making any trades.
Here's my take: Consider entering a long trade (buying) if the price goes above $0.014900 .
But remember, this is just my personal analysis, and it's crucial to conduct your own in-depth investigation before making any financial decisions.
Wishing you the best of luck!

$BOME R U STILL IN? 1ST LEVEL BREAKEDThis morning, when it broke the 0.018, it was quite satisfying, but we still have to wait. Trading memes requires a lot of bets. BOME closed a level and tested a new support very close (the 5 DAILY EMA of the Binance chart and also Dextools). The next goal is to close a daily above 0,016867: I've updated the chart with all Fibonacci indicator levels. Big support remains EMA 10 daily. Close below invalid the trade.

#BOME/USDT SPOT LONG ENTRY#BOMEUSDT Guys I showing a trendline in 4h time frame and it is broken with good volume. Maybe it can go up to 0.028698!💎🌈
BINANCE:BOMEUSDT
#BOME/USDT SPOT LONG ENTRY
Leverage: 1x
Entries: $0.014816
Take profit 1: $0.015848
Take profit 2: $0.019848
Take profit 3: $0.028698
Stop Loss: $0.012481
NOTE: This is just my prediction. Be sure to use STOPLOSS and remember that I am not a financial adviser. your money, your risk!

BOME/USDT | Last Chance To Buy?The Bome/USDT chart appears to be exhibiting bullish signals, suggesting a potentially strong upward trend ahead. There is a notable bullish wave forming, and there is a possibility that the price may see a significant increase in the coming days, possibly ranging between 40% to 80% based on the current market indications. However, it is crucial to exercise caution and conduct your own research (DYOR) before making any investment decisions. Please note that the information provided here is not financial advice, but rather an observation based on the current market conditions.

BOME long 0.01484🚀BOME coin gives a good entry point.
Entry pattern "Breakaway from level"
🤖 First target 0.1948
Further empty. A good impulse is possible!
