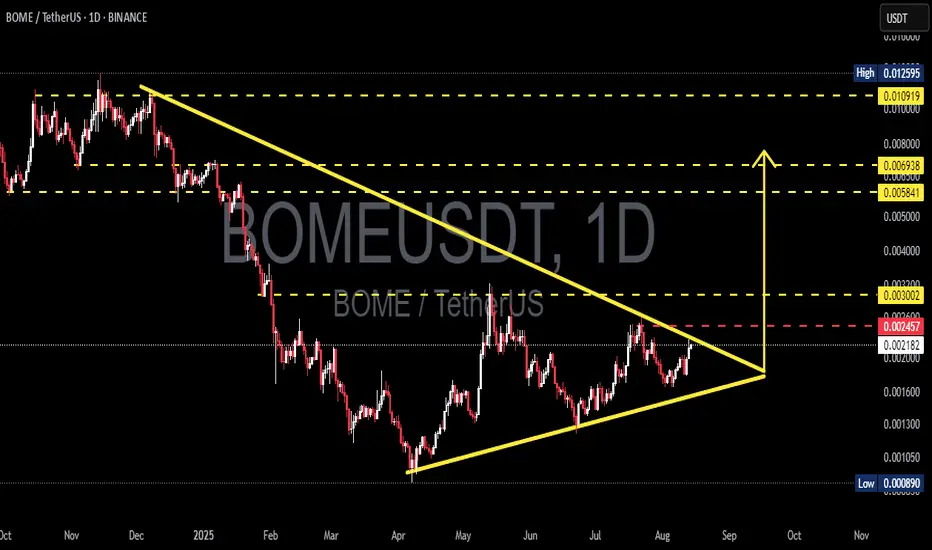
BOME/USDT — Symmetrical Triangle on the Verge of a Explosion?BOME/USDT has spent the past several months moving inside a Symmetrical Triangle pattern, formed by a series of lower highs from the peak around 0.0125 and higher lows from the April 2025 bottom at 0.000890.
This formation signals a major consolidation phase where buying and selling pressure are converging toward a single decision point (apex).
When price action approaches the tip of such a triangle, it often results in a volatility surge — either to the upside (breakout) or downside (breakdown).
Currently, price is testing the critical 0.00245–0.00255 zone, which will act as the gateway to the next major move.
---
Key Levels to Watch
Major Resistance:
0.00245–0.00255 → Upper trendline + horizontal resistance.
0.003002 → Initial breakout target & historical resistance.
0.005841–0.006938 → Strong supply zone from the previous rally.
0.010919 → Psychological target before the peak.
0.012595 → Main chart high.
Key Support:
0.00205–0.00215 → Rising trendline (dynamic support).
0.00170–0.00130 → Minor historical supports.
0.000890 → Yearly low and major support.
---
Pattern Characteristics
The Symmetrical Triangle is a neutral formation typically accompanied by:
Declining volume during consolidation.
Strong volume expansion upon breakout.
Initial move targets often equal the height of the triangle from the breakout point — providing significant upside/downside room.
---
Bullish Scenario
1. Breakout Confirmation: Daily close above 0.00255 with strong volume.
2. First Target: 0.003002.
3. Next Target: Sustained momentum → 0.00584–0.00694.
4. Extended Target: Breaking through the supply zone could drive price to 0.0109–0.0126.
5. Invalidation: Price re-enters the triangle and closes below 0.00220–0.00215.
---
Bearish Scenario
1. Rejection: Failure to break 0.00255 followed by a daily close below 0.00215.
2. Downside Target: 0.00200 → 0.00170–0.00130.
3. Breakdown Risk: A move below the rising trendline could trigger a retest of 0.000890.
4. Invalidation: Price reclaims 0.00245 and holds.
---
Trading Notes
Long consolidations like this often precede sharp moves — patience is key.
Wait for confirmation: Avoid entering prematurely; look for a clear breakout with volume.
Reward/Risk potential is attractive for swing traders in this setup.
#BOME #BOMEUSDT #Crypto #Altcoin #PriceAction #SymmetricalTriangle #Breakout #SupportResistance #ChartPattern #CryptoAnalysis
BOMEUSD
The meme coin you must haveHello friends🙌
Given the decline we had, you can see that the price has exited the descending channel and entered the ascending channel. Now we can buy in steps with capital and risk management.
Follow us for more signals🔥
*Trade safely with us*

BOMEUSDT 1DBOME ~ 1D Analysis
#BOME This trade is very high risk. Buy gradually from here with a short -term target of at least 10%+.

BOMEUSDT 3DBOME ~ 3D
#BOME This trade is very high risk. But if you still have Conviction on this coin,. This support block is very attractive to start buying back,.
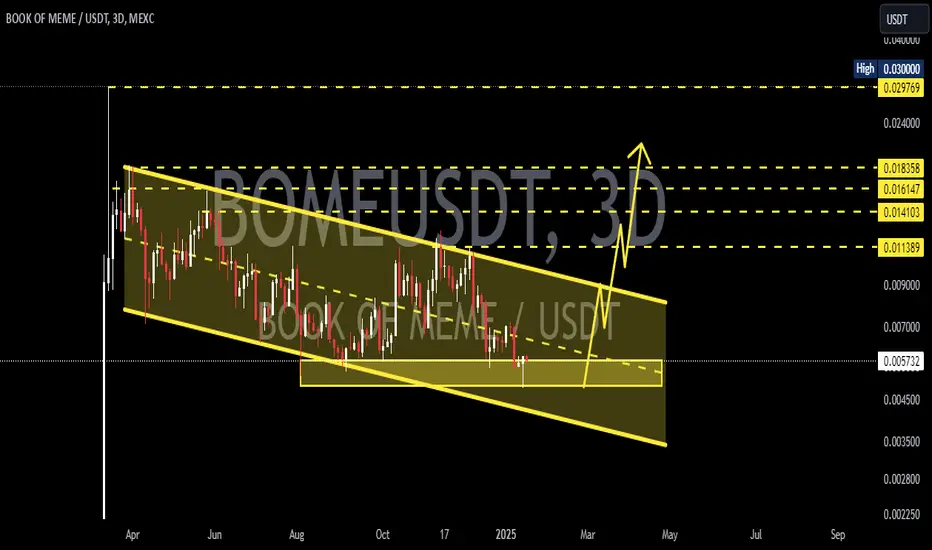
BOMEUSDT 3DBOME ~ 3D
#BOME Still rejected from the resistance line of this pattern. If you still have Conviction on this coin,. This support block would be a very good buying place for now,. With a minimum target of 20%++

BOMEUSDT - Targeting a 200% UpsideBOME/USDT has been quietly consolidating on the hourly chart, showing signs of building a strong base for a potential breakout. This calm phase often precedes significant moves, and the current setup looks like an opportunity to capture a major rally.
Why This Trade?
Consolidation Zone: The price has been stabilizing within a narrow range, suggesting that sellers are losing momentum, and a breakout could be imminent.
Volume Dynamics: While volumes remain steady, any uptick in activity could signal the beginning of a new bullish phase.
Risk-Reward Balance: With a target of +200%, this trade offers an excellent potential reward for calculated risk.
This setup is not about rushing into the market but about positioning strategically for the next big move. As always, patience and discipline will be key to letting the trade play out successfully. Let’s see how BOME performs! 🚀
dyor

BOME is now bullishIt seems that an ABC with terminal C is over and the price has entered a bullish phase.
The best range for Rebuy is the green range.
If the price returns to the green range, we will look for buy/long positions
Closing a daily candle below the invalidation level will violate the analysis.
For risk management, please don't forget stop loss and capital management
Comment if you have any questions
Thank You

Book of Meme BOME price looks "tasty"#BOME is another #Solanamemcoin that looks good.
It's a little expensive now, but if the price of OKX:BOMEUSDT drops to at least 0.0077-0.0081, it will be just right to take a “tasty” long.
🔝 And the prospects for #BOOKofMeme price growth are at least +250-300%.
_____________________
Did you like our analysis? Leave a comment, like, and follow to get more

BOME at key levelBINANCE:BOMEUSDT
Bome has gone up in a 5-waves move, Leading Diagonal Pattern, and retrace to the key level of 78.6% Fibonacci Retracement, it is on the exact place where you should expect a bounce. And after 5 loosing days, it seems like we are making a bullish Harami Candlestick. Risk-Reward ratio is huge here.

BOME looks bullish (4H)It seems that a correction wave has ended.
We have a support range on the chart in which we are looking for buy/long positions on this range.
The targets are clear on the chart.
Closing a daily candle below the invalidation level will violate the analysis.
For risk management, please don't forget stop loss and capital management
When we reach the first target, save some profit and then change the stop to entry
Comment if you have any questions
Thank You

BOMEUSDT - The Next Memecoin Rocketing on the Solana Wave!BOMEUSDT, the trending memecoin on the Solana blockchain, is capturing attention as Solana itself starts to surge. With a breakout on the horizon, this coin is poised for a potential trend change that could lead to significant gains. As the Solana ecosystem heats up, all eyes are on BOMEUSDT.
Now's the time to watch for key resistance levels—if they break, we could see explosive movement. Stay tuned and be ready to ride this wave, but remember to manage your risk!
BOMEUSDT Currently trading at $0.0081
Buy level: Above $0.0082
Stop loss: Below $0.0067
TP1: $0.0099
TP2: $0.011
TP3: $0.014
TP4: $0.018
Max Leverage 3x
Follow Our Tradingview Account for More Technical Analysis Updates, | Like, Share and Comment Your thoughts

BOMEUSDTBOME ~ 1D
#BOME This green gem meme is moving in a descending channel for now.
We have Conviction on this green gem which will performance when the bulls have returned.
Perhaps small gradual buying is very attractive in this descending channel, bulls will be in control when this descending channel is successfully broken.

BOMEUSDT Descending ChannelBOMEUSDT technical analysis update
BOME price has been trading inside a descending channel pattern for the last 150 days and is now bouncing off the channel support line. We can expect a bullish move from the current level. If the price breaks out of the channel pattern, we can expect a strong bullish move in BOME.
Regards
hexa

Bullish Momentum with Overbought SignalsThe market sentiment for BOME is currently bullish. Recent technical indicators show strong upward momentum, but caution is warranted due to potential overbought conditions.
Key Factors Influencing BOME Price
1. Technical Indicators:
The histogram value is 0.000229, MACD line is 0.000423, and the signal line is 0.000194, indicating a bullish trend.
%K at 91.79 and %D at 93.90, indicating overbought conditions.
The RSI stands at 76.54, suggesting that BOME is in overbought territory.
2. Price Trends and Resistance Levels:
Potential Market Scenarios
Bullish Scenario:
A decisive break above the local resistance at $0.011635 could lead to further upward movement, targeting the solid resistance at $0.012500.
Bearish Scenario:
If BOME fails to break above the local resistance, it could retest the support levels at $0.008981 and $0.007604. A break below $0.007604 could signal further declines.
When to Buy BOME for Investment
Current Situation:
Given BOME's current price at $0.010603 and the technical indicators suggesting overbought conditions, a cautious approach is warranted.
Optimal Buying Strategy:
Wait for a Pullback: Considering the Stochastic Oscillator and RSI indicating overbought conditions, waiting for a pullback towards the local support level at $0.008981 could offer a better entry point.
Solid Support Level: If the price drops further, the solid support at $0.007604 is a strong level to consider for investment. Historically, BOME has found significant buying interest at this level, making it a safer entry point.
Gradual Accumulation: Alternatively, adopting a dollar-cost averaging (DCA) strategy by buying small amounts at regular intervals can mitigate the risk of market timing and take advantage of potential dips.
Conclusion and Market Outlook
BOME is currently positioned with significant support and resistance levels to watch. The bullish MACD and overall market activity suggest room for growth, but monitoring the key resistance levels and potential overbought conditions is crucial.

BOME UPDATE (6H)It seems we have a large diametric for BOME. We seem to be in wave C now.
The green range is a Flip, which is a support.
We expect to move up to the lower red box. Actually, the target for this move is the lower red box.
Closing a candle above the invalidation level will violate the analysis
For risk management, please don't forget stop loss and capital management
Comment if you have any questions
Thank You

#BOME Reaches a Critical Support Line | Is This the Moment? Yello, Paradisers! Are you ready for what could be a pivotal moment for #BOME? Let's dive into the details and see what's happening!
💎#BOME is currently trading within a descending channel, with the price consistently respecting the channel's boundaries. Right now, #BOMEUSDT is retesting a significant support zone at $0.0070-$0.0077.
💎Historically, this zone has provided a bullish push, and we might be on the brink of another upward movement.
💎#BOOKOFMEME has reached a new all-time low, touching the channel's lower boundary. This scenario significantly increases the chances of a bullish rally towards the upper channel and a potential breakout.
💎If the major support zone ($0.0070-$0.0077) holds, we could see a strong bullish momentum. In case it fails, the next support at $0.0064 might come into play, potentially providing another bullish push for $BOME.
💎However, if the price continues to fall and breaks below $0.0064, we might witness a bearish continuation for the #BOMEUSDT.
Stay disciplined and focused, Paradisers. The next move could be crucial for this particular asset.
MyCryptoParadise
iFeel the success🌴

BOME looks bearishBOME seems to be forming a FLAT pattern.
The flat pattern consists of 3 ABC waves.
It seems that we are now in wave B of this flat. Wave B looks like a triangle, we are now in the last wave of this triangle (wave e).
The targets are clear on the picture.
Closing a daily candle above the invalidation level will violate the analysis
For risk management, please don't forget stop loss and capital management
Comment if you have any questions
Thank You

BOME, Correction almost complete. TIME TO SEED for multiple Xs!After reaching parabolic levels at 0.028, this much hyped meme coin corrected heavily to 0.009 levels.
Based on the recent price action this is nearing conclusion of its correction and a re-attempt upside reversal is in order now.
The prospect of this returning to its previous peak levels at x3 is very high.
SEED at the current range. The thinning price movement is suggesting a shifting trend soon.
Spotted at 0.00950
TAYOR.

BOME still looks bearishIt looks like on the chart we have an ABC or more complex pattern that we are now in wave B.
Wave B appears to be a diametric. We are now in wave f from B.
After the completion of wave B, we expect to have another bear hair for wave C.
Closing a daily candle above the invalidation level will violate the analysis
For risk management, please don't forget stop loss and capital management
When we reach the first target, save some profit and then change the stop to entry
Comment if you have any questions
Thank You

BOME UPDATE (6H)This analysis is an update to the analysis you see in the "Related Ideas" section.
We have a change of perspective for Bome.
We are still within the supply range of the previous analysis. But on BOME, the bullish signs are increasing.
There is not much chart data and therefore the analysis of this symbol is much more complicated and difficult.
It seems that the price has completed a bearish correction phase and is now completing a bullish correction phase.
By maintaining the green range, it can move towards the targets.
Closing a daily candle below the invalidation level will violate the analysis.
Hi, dear traders. how are you ? Today we have a viewpoint to BUY/LONG the ICP symbol.
For risk management, please don't forget stop loss and capital management
When we reach the first target, save some profit and then change the stop to entry
Comment if you have any questions
Thank You

BOOK OF MEME (BOME) a setup for upto 27% pumpHi dear friends, hope you are well and welcome to the new trade setup of BOOK OF MEME (BOME) with US Dollar pair.
Recently we caught almost 20% pump of BOME as below:
Now on a 4-hr time frame, BOME is completing the final leg of a bullish Gartley move for the next price reversal.
Note: Above idea is for educational purpose only. It is advised to diversify and strictly follow the stop loss, and don't get stuck with trade.

BOMEUSD 1WBOME ~ 1D
#BOME The sleeping green gem will wake up again after successfully breaking through the resistance line of this pattern.
Buy after breaking through this resistance line, with a minimum target of 20%+

BOME analysis (4H)BOME has a strong resistance range ahead.
It appears to be forming a triangle or a more complex pattern.
When you reach the supply range, you can look for buy/long positions.
Demand range can be a good place to save profit.
Closing a daily candle above the invalidation level will violate the analysis
For risk management, please don't forget stop loss and capital management
Comment if you have any questions
Thank You
