BONK/USDT at a Breakpoint — Relief Rally or Trend Reversal?BONK/USDT is still trading within a clear primary downtrend structure that has been in place since the July–August 2025 peak. This is defined by a well-respected descending trendline (yellow line), which has acted as a dynamic resistance and rejected price multiple times.
Recently, in early January 2026, price showed a strong bullish reaction from the lower demand area, suggesting a potential relief rally or early-stage short-term reversal.
---
📐 Technical Structure & Patterns
🔻 Descending Trendline (Primary Bearish Structure)
Price remains below the descending trendline that has guided the downtrend for months.
Previous rallies failed at this trendline, confirming it as a strong dynamic resistance.
As long as price does not achieve a daily close above the trendline, the broader structure remains bearish.
🔄 Potential Bullish Reaction / Relief Rally
Strong bounce from the major support zone around 0.0000073 – 0.0000080.
Large bullish impulse candle indicates short covering or early accumulation.
Momentum is improving, but no confirmed breakout yet.
---
🟡 Key Support & Resistance Levels
Key Support:
0.00000830 – 0.00000730 → Major demand zone
Breakdown below this area could trigger further downside continuation.
Key Resistance Levels:
0.00001134 → nearest resistance
0.00001355
0.00001527
0.00001915 → critical resistance
Trendline zone + 0.00002100 – 0.00002537 → reversal confirmation area
---
🚀 Bullish Scenario
This scenario becomes valid if:
Price breaks and closes above the descending trendline on the daily timeframe
Supported by increasing volume
Bullish Targets (Step-by-Step):
1. 0.00001355
2. 0.00001527
3. 0.00001915
4. 0.00002537 – 0.00002774
📌 Interpretation:
A successful breakout above the trendline combined with a resistance reclaim would signal a trend shift from bearish continuation to bullish reversal.
---
⚠️ Bearish Scenario
This scenario remains valid if:
Price gets rejected from the descending trendline
Strong selling pressure appears around 0.00001134 – 0.00001355
Price breaks back below 0.00000830
Bearish Continuation Targets:
Retest of 0.00000730
Breakdown below this level could lead to new lower lows
📌 Interpretation:
The current bounce may only represent a dead cat bounce or corrective move within the larger downtrend.
---
🧠 Conclusion
BONK/USDT is currently at a critical decision zone.
The higher-timeframe structure remains bearish, but the recent bullish reaction opens the door for a short-term relief rally or early reversal attempt.
➡️ The key confirmation lies in a clean breakout above the descending trendline.
➡️ Until then, bias remains cautious (bearish to neutral).
---
#BONK #BONKUSDT #CryptoAnalysis #TechnicalAnalysis #Downtrend #Trendline #BullishReversal #BearishScenario #Altcoin #Memecoin #PriceAction #SupportResistance #CryptoTrading
Bonkusd

BONK/USDT - Decision Point Strong Downside Pressure?BONK/USDT on the 4D timeframe is entering its most critical phase since mid-2025. The price is now sitting right at the major horizontal support at 0.0000097–0.0000098, while a persistent descending trendline continues to press from above, forming a clear descending triangle — a pattern that often precedes a major move.
What makes this chart even more interesting is the Golden Accumulation Zone at 0.0000048–0.0000039. This area has historically acted as a strong demand block, triggering notable reversals. With the price trapped between a hard floor and a tightening ceiling, BONK is preparing for its next significant expansion — either a breakout reversal or a capitulation drop into the accumulation zone.
---
Market Structure Breakdown
1. Descending Triangle — Sellers in Control
The series of lower highs along the yellow trendline reflects sustained selling pressure. Every bounce is getting weaker, showing that buyers are losing strength. Classic bearish continuation structure.
2. Horizontal Support — “Bounce or Breakdown” Level
The support at 0.0000097–0.0000098 is the final floor before a larger directional move.
If price holds → potential reversal.
If it breaks → freefall into the lower liquidity zone.
3. Accumulation Zone (0.0000048–0.0000039) — Where Smart Money Acts
This yellow block below is a major historical demand area. If price dips into this zone, it often becomes a hotspot for:
long-term accumulation,
liquidity-based reversals,
and aggressive V-shape recoveries.
This is where large buyers typically reload.
---
Bullish Scenario — Reversal Only Needs a Confirmed Breakout
For a bullish reversal, BONK must break above the descending trendline with a strong 4D close and higher volume. This signals a failure of the bearish continuation pattern.
If the breakout is confirmed:
TP1: 0.000013 → first major resistance
TP2: 0.000019 → previous swing zone
Extended: momentum could push further into mid-2025 value territory
SL: below the breakout retest to avoid fakeouts
A failed descending triangle breakdown often leads to a sharp upside move.
---
Bearish Scenario — Breakdown Unlocks the Golden Zone
A 4D close below 0.0000097 with strong selling volume opens the path directly to 0.0000048–0.0000039.
This drop is not just a correction — it is:
a liquidity sweep,
long-wipeout territory,
and a structural reset before a higher-timeframe reversal.
Bearish Target:
Primary: 0.0000048–0.0000039
Extreme: previous wick low (historical liquidity)
This zone is likely to attract long-term buyers waiting for maximum discount levels.
---
BONK/USDT is standing at a rare market juncture.
A breakout → mid-trend reversal begins.
A breakdown → deep discount retest of the Golden Accumulation Zone.
The setup is clear, the structure is clean, and the risk-reward potential is high.
---
#BONK #BONKUSDT #CryptoAnalysis #AltcoinAnalysis #BreakoutOrBreakdown #DescendingTriangle #SupportZone #Accumulation #MarketStructure

#BONK/USDT — Accumulation Zone Before a Potential Major Revers#BONK
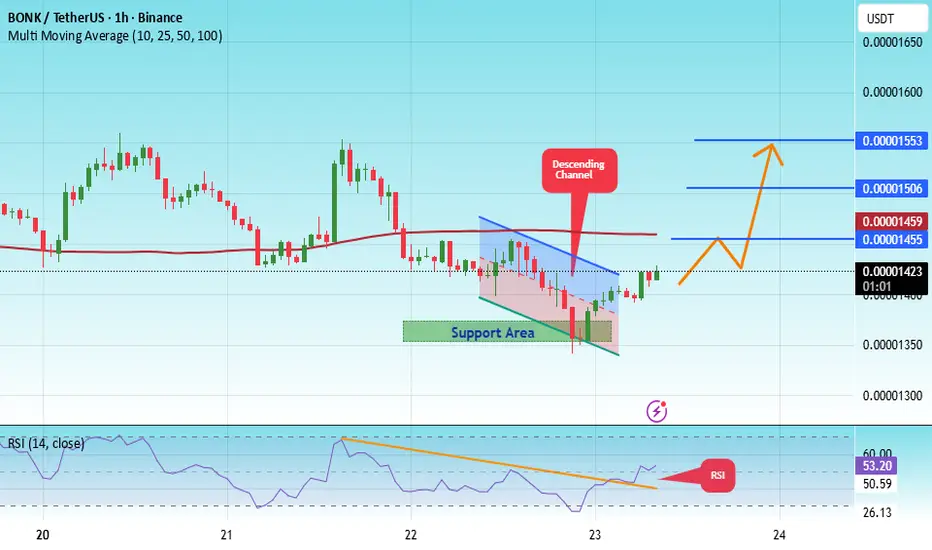
The price is moving within a descending channel on the 1-hour frame, adhering well to it, and is heading for a strong breakout and retest.
We have a bearish trend on the RSI indicator that is about to be broken and retested, which supports the upward breakout.
There is a major support area in green at 0.00001356, which represents a strong support point.
We are heading for consolidation above the 100 moving average.
Entry price: 0.00001422
First target: 0.00001455
Second target: 0.00001506
Third target: 0.00001553
Don't forget a simple matter: capital management.
When you reach the first target, save some money and then change your stop-loss order to an entry order.
For inquiries, please leave a comment.
Thank you.
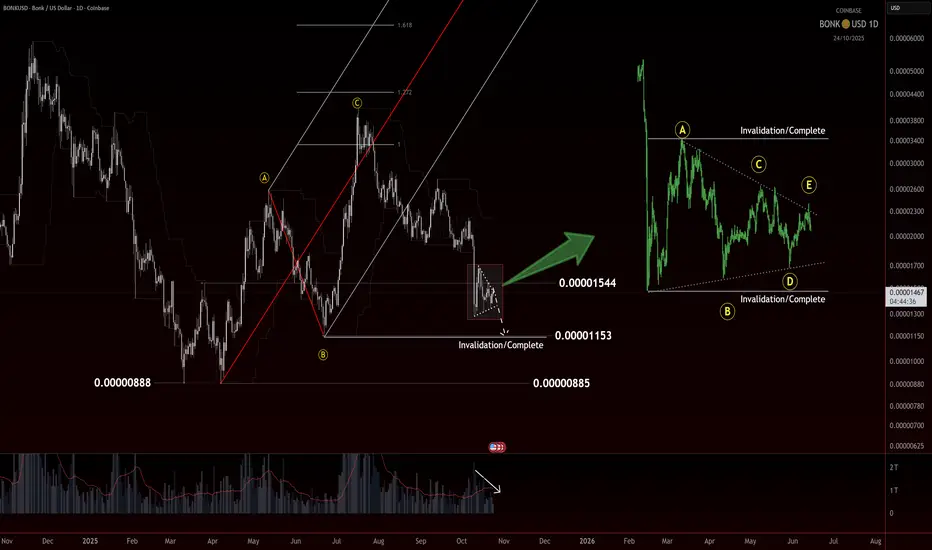
BONK: ALTsummers darling is dumping.BONK – One of the First Runner of #ALTSummer
BONK was one of the first tokens to blast off this summer, setting the pace for early alt momentum. It completed what looks like a clean five-wave impulse up, but now we’re seeing the market digest that move.
If the structure were still strongly bullish, we’d expect a simple internal retracement into the summer impulse before continuation. Instead, the current price action is drifting lower and looks ready to sweep the origin of that move. That tells us this may be more than just a pullback.
On the hard right edge, the structure is giving off triangle vibes. The range is tightening, volume is contracting, and the swings are overlapping. In Elliott Wave terms, a triangle is often the final pattern before the last move of a sequence. It’s the market coiling up before making its decision.
If this forms and finishes as a triangle, we can use it to anchor the count. A clean thrust and sweep of the pivot could trigger short-term upside and possibly close out the current leg. From there, the key question becomes whether that push is the start of something new or simply the last gasp before one more low.
For now, I’m watching how BONK handles this pattern. If it holds and breaks above the triangle invalidation, that would confirm a short-term bullish response. If it completes and breaks lower, the summer impulse is likely complete, and the next real opportunity will come from the base that forms afterward.
Trade safe, trade clarity.
TonyTalon
#BONK/USDT — Accumulation Zone Before a Potential Major Revers#BONK
The price is moving within a descending channel on the 1-hour frame, adhering well to it, and heading for a strong breakout and retest.
We have a bearish trend on the RSI indicator that is about to be broken and retested, which supports the upward breakout.
There is a major support area in green at 0.00001425, which represents a strong support point.
We are heading for consolidation above the 100 moving average.
Entry price: 0.00001439
First target: 0.00001476
Second target: 0.00001513
Third target: 0.00001571
Don't forget a simple matter: capital management.
When you reach the first target, save some money and then change your stop-loss order to an entry order.
For inquiries, please leave a comment.
Thank you.

$BONK: time to refill our bagsI believe we’re heading toward a new all-time high for Bitcoin (BTC).
Both CRYPTOCAP:OTHERS and CRYPTOCAP:TOTAL3 are showing strong bullish momentum, entering extremely oversold territory — a signal often preceding a major recovery.
November is also a historically bullish month for altcoins, which strengthens the case for an upcoming rally.
The probability of a +100% uptrend is very high.
The head and shoulders pattern was invalidated by the October 11th event, which completely shifted the market structure.
In my view, this is the perfect time to take positions and patiently wait for the market reset to play out.
🎯 Take-Profit Targets (based on Fibonacci levels):
TP1: $0.00001865
TP2: $0.00002145
TP3: $0.00002600
TP4: $0.00003220
Historically, when SEED_DONKEYDAN_MARKET_CAP:BONK starts pumping, it almost always reaches around $0.00003200 — and if that happens, we could see a parabolic move up to $0.00005000, marking the top of the altseason.
DYOR (Do Your Own Research).
#BTC #BONK #Altseason #CryptoMarket #Bullish #TradingSetup #Fibonacci #CryptoAnalysis #NovemberRally

BONK/USDT — Accumulation Zone Before a Potential Major Reversal?BONK is once again testing its historical demand zone between 0.000015–0.0000196 USDT, an area that has repeatedly acted as a strong defensive wall for buyers.
Each previous visit to this zone has sparked a surge in buying pressure, leading to significant rebounds. Now, the market faces the same critical point — a decisive moment that will determine whether this is the final phase of accumulation or the beginning of a deeper breakdown.
---
Technical Structure and Pattern Insight
On the 3-day timeframe, BONK has formed a clear triple-bottom pattern, marked by three rounded lows occurring around the same price range.
This formation typically represents institutional accumulation, as large players consistently defend a specific level to absorb selling pressure.
However, this pattern remains unconfirmed until the price manages to break and close above the key resistance near 0.00002710.
A breakout with strong volume from that level would confirm a potential mid-term bullish reversal and signal the start of a new accumulation-to-expansion phase.
---
Bullish Scenario — Reversal Potential
If BONK holds and rebounds from the current demand zone, it could mark the beginning of a major structural reversal.
The first leg of recovery would aim toward previous resistance levels, where prior distribution occurred.
A confirmed 3D close above the neckline would be a strong bullish validation, showing that buying pressure has regained market control.
In this case, BONK would likely form a macro higher low, reinforcing a shift in momentum from accumulation to a fresh bullish trend.
---
Bearish Scenario — Breakdown Risk
On the other hand, if BONK fails to defend this zone and closes a 3D candle below 0.000015, the bullish structure becomes invalidated.
Such a breakdown would open the door to a retest of lower support regions and indicate that the downtrend remains intact.
This would confirm that the market is not yet ready for a sustainable recovery and that further accumulation might be needed before any significant bullish move can develop.
---
Strategic Outlook
BONK currently stands at a critical equilibrium point — the boundary between reversal and continuation.
If the demand zone holds, the triple-bottom formation could trigger a strong upward expansion.
If it breaks, bearish continuation becomes highly probable, bringing the market into a new consolidation phase near previous lows.
Traders are advised to wait for confirmation before positioning, manage risk carefully, and avoid overexposure.
The next move will likely define BONK’s mid-term trend direction, determining whether this accumulation is the beginning of a new cycle — or merely a pause before the next leg down.
#BONK #BONKUSDT #CryptoAnalysis #AltcoinSetup #TechnicalAnalysis #MarketStructure #SwingTrade #TripleBottom #DemandZone #ReversalSetup #CryptoTA #PriceAction #BreakoutStrategy

Bonk InuSEED_DONKEYDAN_MARKET_CAP:BONK 💹
Bonk Inu, one of the pioneers of the Solana memecoin category, is heading toward new highs with a broadening wedge.

BUY AND HOLDHello friends
Due to the growth of the currency, the price of this currency has entered a correction after the growth, and given the good situation that has been provided, we can buy in steps with risk and capital management and move with it to the specified goals.
Note that the holding period is at least 3 months, so be patient and observe capital management.
*Trade safely with us*

BONK/USDT – Demand Zone Retest as Key SupportCurrently, BONK/USDT is once again testing its major demand zone (yellow box), which has acted as a strong battleground between buyers and sellers multiple times since early 2024. This area now serves as the “last line of defense” before the price risks entering a deeper corrective phase.
---
🔑 Key Levels
Main Support (Demand Zone): 0.0000227 – the decisive area.
Bullish Targets (Step-by-step Resistances):
🎯 TP1: 0.0000273
🎯 TP2: 0.0000354
🎯 TP3: 0.0000524
Recent Local High: 0.0000622
---
🐂 Bullish Scenario
As long as price holds and rebounds inside the yellow demand zone, there’s a strong chance of a reversal bounce.
Confirmation comes from a 3D bullish engulfing candle with strong volume.
If BONK breaks above TP1, momentum could extend toward TP2, and eventually TP3, offering more than +130% upside from current levels.
A new higher low structure would start forming, signaling a potential mid-term trend shift back to bullish.
---
🐻 Bearish Scenario
If the 3D candle closes below the yellow demand zone, this support flips into a new resistance.
A breakdown would open the door for BONK to revisit lower support levels from early 2024 consolidation.
Bearish momentum could accelerate as trapped buyers inside the demand zone exit their positions.
---
📌 Technical Pattern & Market Structure
The demand zone has historically acted as a reliable accumulation area, preventing deeper drops.
Repeated sharp rejections at resistance suggest significant supply pressure above.
In short, BONK is now in a “decisive range”: either it starts a new accumulation phase (bullish case) or breaks down into another bearish leg.
---
🎯 Trading Strategy
Conservative Entry: wait for a confirmed 3D bullish close above the demand zone.
Aggressive Entry: scale in within the demand zone, add more if bullish confirmation appears.
Stop Loss: below the demand zone (~10–15% lower).
Take Profit: scale out at TP1 → TP2 → TP3.
Risk Management: never risk more than 1–3% of your capital per trade.
---
📝 Conclusion
BONK is at a critical decision point. If the demand zone holds, there’s strong upside potential with staged targets up to +130%. But if it breaks down, the bearish trend regains dominance, exposing lower support levels.
⚖️ The market’s reaction at this demand zone will define the mid-term direction. Traders should wait for a 3D candle confirmation before committing to larger positions.
#BONK #BONKUSDT #Crypto #CryptoTrading #TechnicalAnalysis #SupportResistance #DemandZone #Breakout #SwingTrading

BONK; Heikin Ashi Trade Idea📈 Hey Traders!
Here’s a fresh outlook from my trading desk. If you’ve been following me for a while, you already know my approach:
🧩 I trade Supply & Demand zones using Heikin Ashi chart on the 4H timeframe.
🧠 I keep it mechanical and clean — no messy charts, no guessing games.
❌ No trendlines, no fixed sessions, no patterns, no indicator overload.
❌ No overanalyzing market structure or imbalances.
❌ No scalping, and no need to be glued to the screen.
✅ I trade exclusively with limit orders, so it’s more of a set-and-forget style.
✅ This means more freedom, less screen time, and a focus on quality setups.
✅ Just a simplified, structured plan and a calm mindset.
💬 Let’s Talk:
💡Do you trade supply & demand too ?
💡What’s your go-to timeframe ?
💡Ever tried Heikin Ashi ?
📩 Got questions about my strategy or setup? Drop them below — ask me anything, I’m here to share.
Let’s grow together and keep it simple. 👊
BONKUSDT 4H✅ BONK/USDT — 4H (Binance) | Aug 21, 2025 — Professional Technical Analysis
🔎 Chart Context
• Pair: BONK/USDT
• Exchange: Binance
• Timeframe: 4H
• Current price: 0.00002198
• Price is in a mid-term downtrend, making lower highs and lower lows after rejection from 0.00002877 and 0.00002826.
📊 Key Observations
1. Market Structure
• BONK peaked at 0.00002877 and 0.00002826, then entered a steady decline.
• The current swing low is 0.00002275, with price attempting a short-term bounce.
• Trend remains bearish until the market reclaims higher supply zones.
2. Support & Demand Zones
• 0.00002339 – 0.00002198: Current support block, where buyers are trying to defend.
• 0.00001900 – 0.00001800: Deeper demand zone; main liquidity magnet if current support fails.
3. Resistance & Supply Zones
• 0.00002411 – 0.00002480: Local supply + fair value gap (FVG), likely to act as rejection zone.
• 0.00002740 – 0.00002877: Strong resistance cluster from last highs.
4. Fair Value Gap (FVG)
• FVG sits above 0.00002480 — price may push into this imbalance before resuming the downtrend.
• This is a typical retracement target before continuation lower.
📈 Bullish Scenario (Short-Term Relief Only)
• Price defends 0.00002275–0.00002198.
• A short-term bounce targets:
• TP1: 0.00002411
• TP2: 0.00002480 (FVG fill)
• For a trend reversal, BONK needs a 4H close above 0.00002550 — otherwise, upside remains corrective only.
📉 Bearish Scenario (Higher Probability)
• BONK rejects from 0.00002411–0.00002480 FVG zone.
• Price resumes decline toward:
• TP1: 0.00002200 (recent low)
• TP2: 0.00001900–0.00001800 (major liquidity target)
• Breakdown below 0.00001800 would open deeper extension into 0.00001650.
⚡ Trading Plan
• Short Setup (Preferred):
• Entry: 0.00002411 – 0.00002480 (FVG rejection)
• TP1: 0.00002200
• TP2: 0.00001900
• Stop: Above 0.00002550
• Long Setup (Countertrend, Risky):
• Entry: 0.00002200 – 0.00002198 (demand defense)
• TP: 0.00002450
• Stop: Below 0.00002150
✅ Conclusion
BONK/USDT on 4H remains in a bearish corrective structure, with the most probable path being a short-term bounce into 0.00002480 FVG, followed by a continuation lower toward 0.00001900–0.00001800 demand zone. Only a reclaim above 0.00002550 would shift momentum back in favor of bulls.

$BONK: my green zones are back. Time to refill our bags.💥 SEED_DONKEYDAN_MARKET_CAP:BONK – The Solana Meme King 💥
SEED_DONKEYDAN_MARKET_CAP:BONK is the Solana meme coin. It was launched when CRYPTOCAP:SOL was at the bottom, and every CRYPTOCAP:SOL whale remembers it. With a strong community of holders, when SEED_DONKEYDAN_MARKET_CAP:BONK pumps, it does it massively. 🚀
🔹 This altseason shouldn’t be different. If SEED_DONKEYDAN_MARKET_CAP:BONK retraces into my green buy zone, it’s a great “refill your bag” setup.
🔹 Meme coins are not long-term holds – buy as low as possible and take profits once RSI overheats.
🔹 Currently, SEED_DONKEYDAN_MARKET_CAP:BONK has retraced ~50% of its last pump. From here, either:
1️⃣ It starts flying now (then it’s too late to buy), or
2️⃣ It retraces fully – which it has done in every past pump cycle.
📊 Like many altcoins, SEED_DONKEYDAN_MARKET_CAP:BONK is in a descending range and recently got rejected. A solid entry often comes when price hits my green zone with RSI bottoming and confirmed by my RSI Divergence indicator (Daily timeframe).
⚠️ Reminder: Meme coins retrace faster and deeper than most alts, but they also pump higher and sharper than expected. Patience is key.
👉 DYOR & trade safe!
#BONK #Solana #Altseason #CryptoTrading #MemeCoins #RSI #TradingView

BONKUSDT – Let the Market Come to YouIn a possible Q3 correction, BONKUSDT may retest the green box zones below.
These areas are not predictions — they’re prepared zones where I’ll be waiting, not chasing.
🟩 I don’t buy strength blindly. I buy value with structure.
All risk-on markets typically experience significant corrections in the third quarter of the year and struggle to recover from this correction until the end of the year.
🎯 My Strategy
🔔 Set alerts for the green boxes
🕐 Switch to the 1-hour timeframe when triggered
📈 Wait for upward breakout + positive CDV
🎯 Only then: take the shot — one bullet, risk-managed
“Markets reward those who wait with a plan, not those who rush with emotion.”
Let’s stay patient, structured, and consistent.
— UmutTrades 💙
📌I keep my charts clean and simple because I believe clarity leads to better decisions.
📌My approach is built on years of experience and a solid track record. I don’t claim to know it all but I’m confident in my ability to spot high-probability setups.
📌If you would like to learn how to use the heatmap, cumulative volume delta and volume footprint techniques that I use below to determine very accurate demand regions, you can send me a private message. I help anyone who wants it completely free of charge.
🔑I have a long list of my proven technique below:
🎯 ZENUSDT.P: Patience & Profitability | %230 Reaction from the Sniper Entry
🐶 DOGEUSDT.P: Next Move
🎨 RENDERUSDT.P: Opportunity of the Month
💎 ETHUSDT.P: Where to Retrace
🟢 BNBUSDT.P: Potential Surge
📊 BTC Dominance: Reaction Zone
🌊 WAVESUSDT.P: Demand Zone Potential
🟣 UNIUSDT.P: Long-Term Trade
🔵 XRPUSDT.P: Entry Zones
🔗 LINKUSDT.P: Follow The River
📈 BTCUSDT.P: Two Key Demand Zones
🟩 POLUSDT: Bullish Momentum
🌟 PENDLEUSDT.P: Where Opportunity Meets Precision
🔥 BTCUSDT.P: Liquidation of Highly Leveraged Longs
🌊 SOLUSDT.P: SOL's Dip - Your Opportunity
🐸 1000PEPEUSDT.P: Prime Bounce Zone Unlocked
🚀 ETHUSDT.P: Set to Explode - Don't Miss This Game Changer
🤖 IQUSDT: Smart Plan
⚡️ PONDUSDT: A Trade Not Taken Is Better Than a Losing One
💼 STMXUSDT: 2 Buying Areas
🐢 TURBOUSDT: Buy Zones and Buyer Presence
🌍 ICPUSDT.P: Massive Upside Potential | Check the Trade Update For Seeing Results
🟠 IDEXUSDT: Spot Buy Area | %26 Profit if You Trade with MSB
📌 USUALUSDT: Buyers Are Active + %70 Profit in Total
🌟 FORTHUSDT: Sniper Entry +%26 Reaction
🐳 QKCUSDT: Sniper Entry +%57 Reaction
📊 BTC.D: Retest of Key Area Highly Likely
📊 XNOUSDT %80 Reaction with a Simple Blue Box!
📊 BELUSDT Amazing %120 Reaction!
📊 Simple Red Box, Extraordinary Results
📊 TIAUSDT | Still No Buyers—Maintaining a Bearish Outlook
📊 OGNUSDT | One of Today’s Highest Volume Gainers – +32.44%
📊 TRXUSDT - I Do My Thing Again
📊 FLOKIUSDT - +%100 From Blue Box!
📊 SFP/USDT - Perfect Entry %80 Profit!
📊 AAVEUSDT - WE DID IT AGAIN!
I stopped adding to the list because it's kinda tiring to add 5-10 charts in every move but you can check my profile and see that it goes on..

#BONK/USDT About to Break Out !#BONK
The price is moving within a descending channel on the 1-hour frame and is expected to break and continue upward.
We have a trend to stabilize above the 100 moving average once again.
We have a downtrend on the RSI indicator that supports the upward break.
We have a support area at the lower boundary of the channel at 0.00002440, acting as a strong support from which the price can rebound.
We have a major support area in green that pushed the price upward at 0.00002372.
Entry price: 0.00002552.
First target: 0.00002694.
Second target: 0.00002882.
Third target: 0.00003118.
To manage risk, don't forget stop loss and capital management.
When you reach the first target, save some profits and then change the stop order to an entry order.
For inquiries, please comment.
Thank you.

BONK : Best of luck to you...Hello friends🙌
👀Considering the decline we had, you can see that the price was supported by buyers and broke the specified resistance. Now, in the price correction, there is a good opportunity to buy with risk and capital management and in steps and be patient until the specified targets are reached.
🔥Follow us for more signals🔥
*Trade safely with us*

Bonk USDT Buy / Long SetupBonk performing well among all meme sectors, wait for the entry and take risk, if tp hits first then ignore. I already shared this setup on my group, we closed the trade at minor profit, but now this is showing strong momentum on 1hr tf also, that's why sharing.

BONK BONKUSDT Hello, greetings...
🐱🐉 The support and resistance levels in Bonk during the 4-hour timeframe are shown in the graph as I have indicated.
🐱🐉 However, what I want to discuss with you is how we should follow Bonk and how we can maintain control over its strength. I will show this to you...
🐱🏍 First, let's just look at the support, resistance, and our trend...
🐱🏍 When we look at it, we see a strong upward trend showing rapid growth and there is both a support level and a resistance level. It appears that the upward trend will continue until we reach the yellow line. When we reach the yellow trend, the color of things will change.
🐱👤 What I want to explain most to you is the indicator part now...
🐱👤 The blue arrow marks indicate the strength of the trend, the white line is called ADX, which shows how strong the trend is. The purple one is the well-known RSI,
🐱👤 So what is ADX telling us right now?
🐱👤 ADX is still looking upwards and at a high level, so it makes more sense to hold on to our long positions.
🐱🚀 The indicator we know as DI+ and DI- consists of green and red thin lines. What does it tell us?
🐱🚀 If DI+ (green) crosses above DI- (red), it indicates a positive trend and we are currently seeing a significant positive movement. We will use this indicator like this: if ADX turns downward and DI- crosses above DI+, those who are holding long positions should be cautious.
CONTINUE TO HOLD THE POSITION
+DI > -DI
ADX > 25
RSI < 70 → Should not be in an overbought area
BE CAUTIOUS
-DI > +DI
ADX > 25
RSI > 30 → Should not be in an oversold area
BONK – Long Here, Patience RequiredTime to go long on $BONK.
Hard not to bid at this level—the risk/reward is solid.
Still expecting some range-bound price action before the real move kicks in, so patience is key here.
First target: the yearly open—nearly a 2x from current levels. BINANCE:BONKUSDT

Bonk on a tear with fresh volumeBoy this alt market drawdown really taking its toll isnt it?
I think i might of found a relief rally here in Bonk.
Lets see how this prediction plays out

BONKUSDT 1D AnalysisBONK ~ 1D Analysis
#BONK Buy on retesting this support block or buy after successfully breaking this resistance line with a short term target of at least 15%+ and a long term target of $0.000065+

BONK About to Explode or Fakeout? Key Levels Are UnfoldingYello, Paradisers! Is #BONK gearing up for a face-melting rally, or is this just another trap designed for emotional traders?
💎BONKUSDT has recently formed a double bottom, a key reversal pattern that often appears before significant bullish momentum kicks in. This comes after a sustained bearish trend, and we’re now seeing signs of strength re-entering the market.
💎What’s even more interesting, a lookalike of skewed triangle pattern is starting to emerge. These often signal continuation of strength, and when paired with an already bullish reversal, it paints a potentially explosive short-term picture.
💎#BONKUSDT is currently sitting on ascending support around the $0.00001980 level. This zone is further bolstered by the EMA-50, adding extra technical significance. If BONK can continue to hold this level, the price is well-positioned to push higher toward the $0.00002470 mark, a moderate resistance zone that could serve as the next stepping stone in this bullish scenario.
💎If BONK clears this resistance with conviction, momentum could pick up rapidly, opening the doors for an aggressive move toward the $0.00003100 to $0.00003400 region. This is a critical profit-taking zone, not only because of historical resistance but also due to a dense confluence of technical barriers.
💎Zooming into the 12-hour timeframe, BONK has just entered a golden cross formation. This bullish crossover is acting as dynamic support, with the $0.00001800 level becoming an important defensive area for price stability moving forward.
Paradisers, strive for consistency, not quick profits. Treat the market as a businessman, not as a gambler.
MyCryptoParadise
iFeel the success🌴

1000Bonk Day Trading SetupIf you see price starts consolidation at the poi, or see any 5m big green candle then enter with proper SL, will update trade should be closed or not.
