BONK/USDT at a Breakpoint — Relief Rally or Trend Reversal?BONK/USDT is still trading within a clear primary downtrend structure that has been in place since the July–August 2025 peak. This is defined by a well-respected descending trendline (yellow line), which has acted as a dynamic resistance and rejected price multiple times.
Recently, in early January 2026, price showed a strong bullish reaction from the lower demand area, suggesting a potential relief rally or early-stage short-term reversal.
---
📐 Technical Structure & Patterns
🔻 Descending Trendline (Primary Bearish Structure)
Price remains below the descending trendline that has guided the downtrend for months.
Previous rallies failed at this trendline, confirming it as a strong dynamic resistance.
As long as price does not achieve a daily close above the trendline, the broader structure remains bearish.
🔄 Potential Bullish Reaction / Relief Rally
Strong bounce from the major support zone around 0.0000073 – 0.0000080.
Large bullish impulse candle indicates short covering or early accumulation.
Momentum is improving, but no confirmed breakout yet.
---
🟡 Key Support & Resistance Levels
Key Support:
0.00000830 – 0.00000730 → Major demand zone
Breakdown below this area could trigger further downside continuation.
Key Resistance Levels:
0.00001134 → nearest resistance
0.00001355
0.00001527
0.00001915 → critical resistance
Trendline zone + 0.00002100 – 0.00002537 → reversal confirmation area
---
🚀 Bullish Scenario
This scenario becomes valid if:
Price breaks and closes above the descending trendline on the daily timeframe
Supported by increasing volume
Bullish Targets (Step-by-Step):
1. 0.00001355
2. 0.00001527
3. 0.00001915
4. 0.00002537 – 0.00002774
📌 Interpretation:
A successful breakout above the trendline combined with a resistance reclaim would signal a trend shift from bearish continuation to bullish reversal.
---
⚠️ Bearish Scenario
This scenario remains valid if:
Price gets rejected from the descending trendline
Strong selling pressure appears around 0.00001134 – 0.00001355
Price breaks back below 0.00000830
Bearish Continuation Targets:
Retest of 0.00000730
Breakdown below this level could lead to new lower lows
📌 Interpretation:
The current bounce may only represent a dead cat bounce or corrective move within the larger downtrend.
---
🧠 Conclusion
BONK/USDT is currently at a critical decision zone.
The higher-timeframe structure remains bearish, but the recent bullish reaction opens the door for a short-term relief rally or early reversal attempt.
➡️ The key confirmation lies in a clean breakout above the descending trendline.
➡️ Until then, bias remains cautious (bearish to neutral).
---
#BONK #BONKUSDT #CryptoAnalysis #TechnicalAnalysis #Downtrend #Trendline #BullishReversal #BearishScenario #Altcoin #Memecoin #PriceAction #SupportResistance #CryptoTrading
BONKUSDC

BONK/USDT - Decision Point Strong Downside Pressure?BONK/USDT on the 4D timeframe is entering its most critical phase since mid-2025. The price is now sitting right at the major horizontal support at 0.0000097–0.0000098, while a persistent descending trendline continues to press from above, forming a clear descending triangle — a pattern that often precedes a major move.
What makes this chart even more interesting is the Golden Accumulation Zone at 0.0000048–0.0000039. This area has historically acted as a strong demand block, triggering notable reversals. With the price trapped between a hard floor and a tightening ceiling, BONK is preparing for its next significant expansion — either a breakout reversal or a capitulation drop into the accumulation zone.
---
Market Structure Breakdown
1. Descending Triangle — Sellers in Control
The series of lower highs along the yellow trendline reflects sustained selling pressure. Every bounce is getting weaker, showing that buyers are losing strength. Classic bearish continuation structure.
2. Horizontal Support — “Bounce or Breakdown” Level
The support at 0.0000097–0.0000098 is the final floor before a larger directional move.
If price holds → potential reversal.
If it breaks → freefall into the lower liquidity zone.
3. Accumulation Zone (0.0000048–0.0000039) — Where Smart Money Acts
This yellow block below is a major historical demand area. If price dips into this zone, it often becomes a hotspot for:
long-term accumulation,
liquidity-based reversals,
and aggressive V-shape recoveries.
This is where large buyers typically reload.
---
Bullish Scenario — Reversal Only Needs a Confirmed Breakout
For a bullish reversal, BONK must break above the descending trendline with a strong 4D close and higher volume. This signals a failure of the bearish continuation pattern.
If the breakout is confirmed:
TP1: 0.000013 → first major resistance
TP2: 0.000019 → previous swing zone
Extended: momentum could push further into mid-2025 value territory
SL: below the breakout retest to avoid fakeouts
A failed descending triangle breakdown often leads to a sharp upside move.
---
Bearish Scenario — Breakdown Unlocks the Golden Zone
A 4D close below 0.0000097 with strong selling volume opens the path directly to 0.0000048–0.0000039.
This drop is not just a correction — it is:
a liquidity sweep,
long-wipeout territory,
and a structural reset before a higher-timeframe reversal.
Bearish Target:
Primary: 0.0000048–0.0000039
Extreme: previous wick low (historical liquidity)
This zone is likely to attract long-term buyers waiting for maximum discount levels.
---
BONK/USDT is standing at a rare market juncture.
A breakout → mid-trend reversal begins.
A breakdown → deep discount retest of the Golden Accumulation Zone.
The setup is clear, the structure is clean, and the risk-reward potential is high.
---
#BONK #BONKUSDT #CryptoAnalysis #AltcoinAnalysis #BreakoutOrBreakdown #DescendingTriangle #SupportZone #Accumulation #MarketStructure

#BONK/USDT — Accumulation Zone Before a Potential Major Revers#BONK
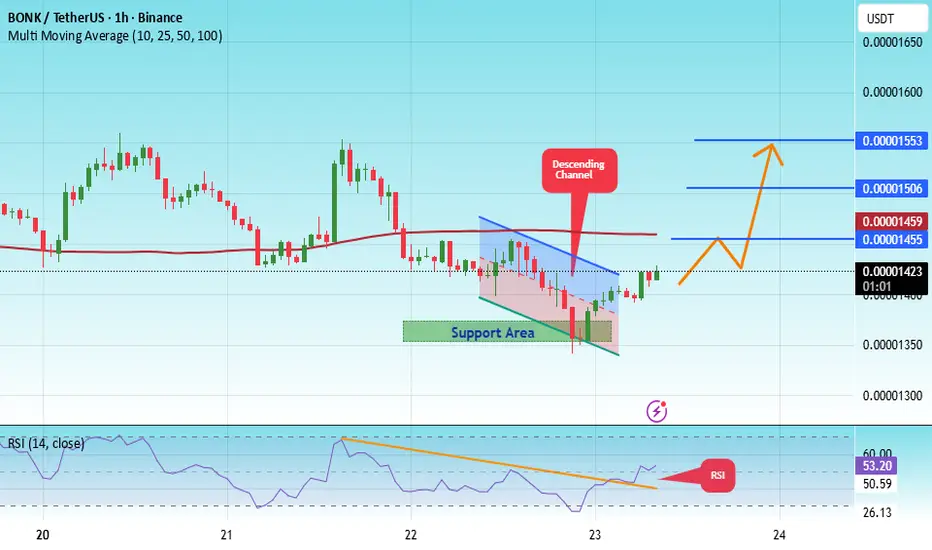
The price is moving within a descending channel on the 1-hour frame, adhering well to it, and is heading for a strong breakout and retest.
We have a bearish trend on the RSI indicator that is about to be broken and retested, which supports the upward breakout.
There is a major support area in green at 0.00001356, which represents a strong support point.
We are heading for consolidation above the 100 moving average.
Entry price: 0.00001422
First target: 0.00001455
Second target: 0.00001506
Third target: 0.00001553
Don't forget a simple matter: capital management.
When you reach the first target, save some money and then change your stop-loss order to an entry order.
For inquiries, please leave a comment.
Thank you.
$BONK: time to refill our bagsI believe we’re heading toward a new all-time high for Bitcoin (BTC).
Both CRYPTOCAP:OTHERS and CRYPTOCAP:TOTAL3 are showing strong bullish momentum, entering extremely oversold territory — a signal often preceding a major recovery.
November is also a historically bullish month for altcoins, which strengthens the case for an upcoming rally.
The probability of a +100% uptrend is very high.
The head and shoulders pattern was invalidated by the October 11th event, which completely shifted the market structure.
In my view, this is the perfect time to take positions and patiently wait for the market reset to play out.
🎯 Take-Profit Targets (based on Fibonacci levels):
TP1: $0.00001865
TP2: $0.00002145
TP3: $0.00002600
TP4: $0.00003220
Historically, when SEED_DONKEYDAN_MARKET_CAP:BONK starts pumping, it almost always reaches around $0.00003200 — and if that happens, we could see a parabolic move up to $0.00005000, marking the top of the altseason.
DYOR (Do Your Own Research).
#BTC #BONK #Altseason #CryptoMarket #Bullish #TradingSetup #Fibonacci #CryptoAnalysis #NovemberRally

BONK/USDT — Accumulation Zone Before a Potential Major Reversal?BONK is once again testing its historical demand zone between 0.000015–0.0000196 USDT, an area that has repeatedly acted as a strong defensive wall for buyers.
Each previous visit to this zone has sparked a surge in buying pressure, leading to significant rebounds. Now, the market faces the same critical point — a decisive moment that will determine whether this is the final phase of accumulation or the beginning of a deeper breakdown.
---
Technical Structure and Pattern Insight
On the 3-day timeframe, BONK has formed a clear triple-bottom pattern, marked by three rounded lows occurring around the same price range.
This formation typically represents institutional accumulation, as large players consistently defend a specific level to absorb selling pressure.
However, this pattern remains unconfirmed until the price manages to break and close above the key resistance near 0.00002710.
A breakout with strong volume from that level would confirm a potential mid-term bullish reversal and signal the start of a new accumulation-to-expansion phase.
---
Bullish Scenario — Reversal Potential
If BONK holds and rebounds from the current demand zone, it could mark the beginning of a major structural reversal.
The first leg of recovery would aim toward previous resistance levels, where prior distribution occurred.
A confirmed 3D close above the neckline would be a strong bullish validation, showing that buying pressure has regained market control.
In this case, BONK would likely form a macro higher low, reinforcing a shift in momentum from accumulation to a fresh bullish trend.
---
Bearish Scenario — Breakdown Risk
On the other hand, if BONK fails to defend this zone and closes a 3D candle below 0.000015, the bullish structure becomes invalidated.
Such a breakdown would open the door to a retest of lower support regions and indicate that the downtrend remains intact.
This would confirm that the market is not yet ready for a sustainable recovery and that further accumulation might be needed before any significant bullish move can develop.
---
Strategic Outlook
BONK currently stands at a critical equilibrium point — the boundary between reversal and continuation.
If the demand zone holds, the triple-bottom formation could trigger a strong upward expansion.
If it breaks, bearish continuation becomes highly probable, bringing the market into a new consolidation phase near previous lows.
Traders are advised to wait for confirmation before positioning, manage risk carefully, and avoid overexposure.
The next move will likely define BONK’s mid-term trend direction, determining whether this accumulation is the beginning of a new cycle — or merely a pause before the next leg down.
#BONK #BONKUSDT #CryptoAnalysis #AltcoinSetup #TechnicalAnalysis #MarketStructure #SwingTrade #TripleBottom #DemandZone #ReversalSetup #CryptoTA #PriceAction #BreakoutStrategy

BONK/USDT – Demand Zone Retest as Key SupportCurrently, BONK/USDT is once again testing its major demand zone (yellow box), which has acted as a strong battleground between buyers and sellers multiple times since early 2024. This area now serves as the “last line of defense” before the price risks entering a deeper corrective phase.
---
🔑 Key Levels
Main Support (Demand Zone): 0.0000227 – the decisive area.
Bullish Targets (Step-by-step Resistances):
🎯 TP1: 0.0000273
🎯 TP2: 0.0000354
🎯 TP3: 0.0000524
Recent Local High: 0.0000622
---
🐂 Bullish Scenario
As long as price holds and rebounds inside the yellow demand zone, there’s a strong chance of a reversal bounce.
Confirmation comes from a 3D bullish engulfing candle with strong volume.
If BONK breaks above TP1, momentum could extend toward TP2, and eventually TP3, offering more than +130% upside from current levels.
A new higher low structure would start forming, signaling a potential mid-term trend shift back to bullish.
---
🐻 Bearish Scenario
If the 3D candle closes below the yellow demand zone, this support flips into a new resistance.
A breakdown would open the door for BONK to revisit lower support levels from early 2024 consolidation.
Bearish momentum could accelerate as trapped buyers inside the demand zone exit their positions.
---
📌 Technical Pattern & Market Structure
The demand zone has historically acted as a reliable accumulation area, preventing deeper drops.
Repeated sharp rejections at resistance suggest significant supply pressure above.
In short, BONK is now in a “decisive range”: either it starts a new accumulation phase (bullish case) or breaks down into another bearish leg.
---
🎯 Trading Strategy
Conservative Entry: wait for a confirmed 3D bullish close above the demand zone.
Aggressive Entry: scale in within the demand zone, add more if bullish confirmation appears.
Stop Loss: below the demand zone (~10–15% lower).
Take Profit: scale out at TP1 → TP2 → TP3.
Risk Management: never risk more than 1–3% of your capital per trade.
---
📝 Conclusion
BONK is at a critical decision point. If the demand zone holds, there’s strong upside potential with staged targets up to +130%. But if it breaks down, the bearish trend regains dominance, exposing lower support levels.
⚖️ The market’s reaction at this demand zone will define the mid-term direction. Traders should wait for a 3D candle confirmation before committing to larger positions.
#BONK #BONKUSDT #Crypto #CryptoTrading #TechnicalAnalysis #SupportResistance #DemandZone #Breakout #SwingTrading

$BONK: my green zones are back. Time to refill our bags.💥 SEED_DONKEYDAN_MARKET_CAP:BONK – The Solana Meme King 💥
SEED_DONKEYDAN_MARKET_CAP:BONK is the Solana meme coin. It was launched when CRYPTOCAP:SOL was at the bottom, and every CRYPTOCAP:SOL whale remembers it. With a strong community of holders, when SEED_DONKEYDAN_MARKET_CAP:BONK pumps, it does it massively. 🚀
🔹 This altseason shouldn’t be different. If SEED_DONKEYDAN_MARKET_CAP:BONK retraces into my green buy zone, it’s a great “refill your bag” setup.
🔹 Meme coins are not long-term holds – buy as low as possible and take profits once RSI overheats.
🔹 Currently, SEED_DONKEYDAN_MARKET_CAP:BONK has retraced ~50% of its last pump. From here, either:
1️⃣ It starts flying now (then it’s too late to buy), or
2️⃣ It retraces fully – which it has done in every past pump cycle.
📊 Like many altcoins, SEED_DONKEYDAN_MARKET_CAP:BONK is in a descending range and recently got rejected. A solid entry often comes when price hits my green zone with RSI bottoming and confirmed by my RSI Divergence indicator (Daily timeframe).
⚠️ Reminder: Meme coins retrace faster and deeper than most alts, but they also pump higher and sharper than expected. Patience is key.
👉 DYOR & trade safe!
#BONK #Solana #Altseason #CryptoTrading #MemeCoins #RSI #TradingView

Bonk USDT Buy / Long SetupBonk performing well among all meme sectors, wait for the entry and take risk, if tp hits first then ignore. I already shared this setup on my group, we closed the trade at minor profit, but now this is showing strong momentum on 1hr tf also, that's why sharing.

BONKUSDT 1D AnalysisBONK ~ 1D Analysis
#BONK Buy on retesting this support block or buy after successfully breaking this resistance line with a short term target of at least 15%+ and a long term target of $0.000065+

$BONK here loks good for another 1000%SEED_DONKEYDAN_MARKET_CAP:BONK here looks good for another 1000%; cluster of htf levels with declining sell volume.
A run to ATH is 500%, and beyond to the fibs is over 1000%.
Easy invalidation just below pink yearly line.

$BONK: Prepping for a Potential Explosive Move🚀 SEED_DONKEYDAN_MARKET_CAP:BONK : Prepping for a Potential Explosive Move
SEED_DONKEYDAN_MARKET_CAP:BONK is known for its wild, high-volatility pumps—and we may be approaching another one.
After a significant bearish divergence on the daily chart, SEED_DONKEYDAN_MARKET_CAP:BONK has retraced to levels lower than last year. However, it's important to remember: SEED_DONKEYDAN_MARKET_CAP:BONK is the original meme coin of the Solana ecosystem, and it's strongly supported by Solana whales.
📈 If CRYPTOCAP:SOL rallies, SEED_DONKEYDAN_MARKET_CAP:BONK usually follows.
While a new all-time high might be out of reach in the short term, a significant move to the upside is on the table. Here's why:
✅ RSI is rising, forming a bullish divergence
✅ Price has entered my 2025 buy zone
✅ MACD has just crossed bullish on the 1D timeframe
✅ Volume is low, often a precursor to explosive moves
✅ CRYPTOCAP:OTHERS index is showing signs of strength—altcoin momentum is building
🧠 If momentum picks up, we could see a 2x to 3x move from current levels.
📌 Keep an eye on this one. As always, DYOR.
#BONK #Solana #MemeCoin #Altcoins #CryptoTrading #CryptoSignals #BONKArmy #MACD #RSI #DYOR #Altseason #CryptoAnalysis

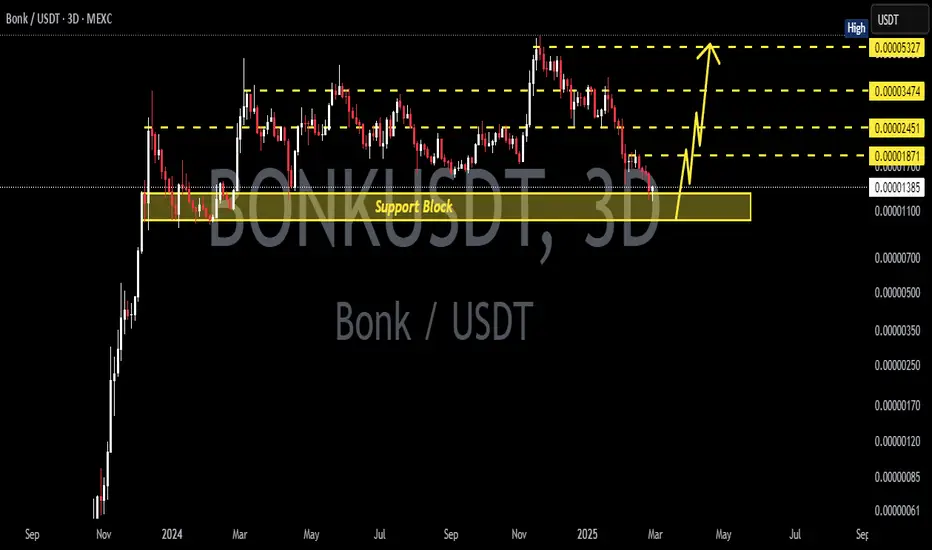
BONKUSDT 3DBONK ~ 3D Analysis
#BONK Buy gradually from here if you still have a Conviction on this coin.
Reason, This support block is still maintained.